Demonstration of Compliance for the BLUE MED FAB establishment - Overall added value based on cost-benefit analyses
←
→
Page content transcription
If your browser does not render page correctly, please read the page content below
Demonstration of Compliance
for the BLUE MED FAB establishment

Overall added value based on cost-benefit analyses

                                                     www.bluemed.aero
Some CBA assumptions
No infrastructural costs / investments required in addition to those already planned
by Partners and included in each LSSIP
No personnel / organizational variations envisaged
Costs for specific quick-win support activities considered (e.g. such as routes re-
design and optimisations), quantified on the basis of hourly gross personnel costs for
professional profiles for ANSPs involved
Focus of the analysis mostly related to airspace users
Compliance with the EU Commission Regulation 176/2011 that, among other
requirements, asks for:
Cost-benefit analysis providing a consolidated view of the impact of the establishment of
the functional airspace block on the civil and military airspace users
a Cost Benefit analysis demonstrating an overall positive financial result (net present
value and / or internal rate of return) for the establishment of the functional airspace
block
www.bluemed.aeroCBA Methodology
The methodology adopted (EMOSIA) and the final results of the CBA and the What-
If Analysis are compliant with the EU Commission Regulation 176/2011 (Annex –
Part 2.4 – Overall added value based on Cost Benefit analyses)
The following check list summarizes EU Commission Regulation 176/2011 vis-à-vis
EMOSIA features
EU Commission Regulation 176/2011 EMOSIA and results compliance with EU CR 176/2011
Cost Benefit analysis conducted according to EMOSIA Methodology allows performing the CBA analysis in accordance
industry standard practice, using among with the officially adopted European Commission Guidance Material,
others discounted cash flow analysis for the Establishment and Modification of FAB (edition December 3rd,
2010). Discounted cash flow analysis was used to evaluate the NPV of
the initiatives over the time horizon considered
Cost Benefit analysis providing a consolidated The CBA performed focuses primarily on benefits to civil Airspace Users
view of the impact of the establishment or (Airlines), with the evaluation of relevant potential impacts (e.g. in
modification of the functional airspace block terms of savings related to fuel consumption, delays, CO2 emissions,
on the civil and military airspace users maintenance and crew rescheduling costs). As for BLUE MED FAB
optimized ATS Route Network, Military users were consulted and
involved during the evaluation and analysis phase for the input data
Cost-benefit analysis demonstrating an overall All analyses developed, from 2012 to 2020, show a positive Net Present
positive financial result (net present value Value, even over a relatively short time horizon
and / or internal rate of return) for the
establishment or modification of the
functional airspace block
www.bluemed.aeroCBA Methodology
EU Commission Regulation 176/2011 EMOSIA and results compliance with EU CR 176/2011
Functional airspace block contributing to FAB implementation would guarantee benefits, regarding both CO2
a reduction of the aviation emissions and NOx and fuel consumption, in every economic
environmental impact scenario analyzed
Documented values for costs and In light of EMOSIA, operational / technical streams assessed benefits
benefits, their sources and the through tools in use at EUROCONTROL level; values for costs were
assumptions made to develop the Cost assessed with details of their sources. All the assumptions considered
Benefit are defined and detailed in the document
Main stakeholders were consulted and Main stakeholders were involved and / or consulted, directly or indirectly,
provided feedback on the costs and during the collection of input data
benefits estimates which are applicable to
their operations
www.bluemed.aeroCBA Input
In order to perform CBA and What-If Analyses input data related to three identified
macro-scenarios were collected
Short term (2012) Medium term (2015) Long term (2020)
This phase, corresponding to This phase, corresponding to This phase will see the
the establishment of the the complete deployment of improvement of the BLUE
FAB, will be characterized by the FAB, will be characterized MED FAB operations, which
the launch of the identified by the start of improved are expected to provide high
operational and technical modifications, functionalities benefits to the airspace users
quick-wins, and by the and systems specifically and will see the enlargement
improvements already in the tailored to fulfill the needs of of the FAB to additional
development pipelines of the FAB in terms of interested States
the various States interoperability and seamless
operations
Cost Benefit Analysis What-If Analysis
www.bluemed.aeroCBA benefits classification &
Key Improvement Areas
In order to provide a clear evidence and classification of the benefits coming from
specific FAB implementation scenarios, six Key Improvement Areas (KIAs) were
defined as follows: Capacity / Workload / Delay
Flight Efficiency the number of aircrafts that can be fitted into ATC
sectors at a given time; work required from ATCOs to
the capacity of ATM of granting each individual ensure adequate and safe separations to aircrafts in the
aircraft the possibility to fly a preferred and sector at a given time; en-route delay due to tactical
optimal profile in the shortest possible time and at instructions or ATFM restriction introduced to protect a
the minimal cost Sector from overload
Cost Effectiveness
Environmental Sustainability
Key the diminishing of global costs of
the capacity of limiting the impact of Improvement ATM/ANS provided by the ANSPs, which
directly reflect on the route charges, as
the air traffic on the environment, with
particular reference to the global Areas (KIAs) well as the monetary benefits brought to
the users
warming due to gas emissions, below an
acceptable threshold
Human Resources
Safety
the impact on the working conditions of the staff
the capacity to minimize the
involved in ATC provision, in particular in terms of
number of events below an
working methods, recruiting, training, licensing
acceptable threshold
within the FAB
www.bluemed.aeroCBA benefits & Savings evaluation
Benefits evaluation derived from the comparison between the hypothesis under
which the BLUE MED FAB will not be established (Baseline) and the hypothesis
under which the envisaged improvements will be implemented because the FAB is
established (BM Implementation)
• The baseline scenario, developed by operational / technical BM WPs,
considers a traffic increase from 2012 to 2020 according to STATFOR
BASELINE SCENARIO forecasts, while network remains unchanged. It considers the following
network and traffic values:
o in 2012 traffic increases and there is no FAB implementation
o in 2015 traffic increases and there is no FAB implementation
o in 2020 traffic increases and there is no FAB implementation
• The BLUE MED scenario is defined considering for each year (from 2012
to 2020) both traffic increase according to STATFOR forecasts and
BLUE MED SCENARIO network re-design for FAB implementation (in 2015 and 2020 also the
Free Route effect on top) for BLUE MED 7 Countries. BLUE MED
implementation case is defined considering:
o in 2012 traffic increases and there is FAB implementation
o in 2015 traffic increases with Free Route and there is FAB
implementation
o in 2020 traffic increases with Free Route and there is FAB
implementation
www.bluemed.aeroCBA benefits & Savings evaluation
Yearly fuel savings were calculated subtracting fuel consumptions, generated by
redesigned routes related to different BLUE MED FAB scenarios (short-term 2012 /
medium-term 2015 / long-term 2020) also with Free Route operations (medium-term
2015- long-term 2020) from the baseline (scenario without FAB implementation)
BLUE MED FAB - Yearly Fuel saving
Yearly Fuel consumptions Yearly Fuel consumptions Yearly Fuel saving
Scenarios [Kg] – BASELINE [Kg] -BLUE MED FAB [Kg]
2012 17.901.204.038 17.866.842.801 34.361.237
2015 19.744.312.149 19.688.002.733 56.309.416
2015+ Free Route 19.744.312.149 19.662.511.783 81.800.366
2020 + Free Route 23.174.145.278 23.063.925.872 110.219.406
The 2012 fuel saving is considered also in the period 2013-14; the value of 2015 is
considered up to 2019 (as for all the other flight efficiency savings)
The Free Route scenario is highlighted separately for 2015 in order to ponder its
specific relevance
www.bluemed.aeroCBA benefits & Savings evaluation
Yearly flight time savings amount was provided for each economic scenarios. The
difference between the baseline and each BM FAB economic scenario is represented
in the following table:
BLUE MED FAB - Yearly Time saving
Yearly Time consumptions Yearly Time consumptions Yearly Time saving
Scenarios [Min] – BASELINE [Min] -BLUE MED FAB [Min]
2012 331.684.000 330.997.220 686.780
2015 364.186.462 363.058.717 1.127.745
2015+ Free Route 364.186.462 362.571.226 1.615.236
2020 + Free Route 425.111.116 423.001.076 2.110.040
www.bluemed.aeroCBA benefits & Savings evaluation
Yearly CO2 savings, calculated by subtracting from baseline emissions the values of
daily CO2 emissions for each BM scenario, were defined as follows:
BLUE MED FAB - Yearly CO2 saving
Yearly CO2 consumptions Yearly CO2 consumptions Yearly CO2 saving
Scenarios [Ton] – BASELINE [Ton] -BLUE MED FAB [Ton]
2012 56.209.746 56.101.847 107.899
2015 61.997.102 61.820.287 176.815
2015+ Free Route 61.997.102 61.740.247 256.855
2020 + Free Route 72.766.773 72.420.678 346.095
www.bluemed.aeroCBA benefits & Savings evaluation
Yearly NOx savings amount was provided as well for each economic scenario. The
difference between baseline values and each BM FAB economic scenario is
presented in the following table
BLUE MED FAB - Yearly NOx saving
Yearly NOx consumptions Yearly NOx consumptions Yearly NOx saving
Scenarios [Ton] – BASELINE [Ton] -BLUE MED FAB [Ton]
2012 265.819.506 265.389.242 430.264
2015 294.489.158 293.777.539 711.619
2015+ Free Route 294.489.158 293.468.414 1.020.744
2020 + Free Route 344.640.589 343.225.663 1.414.926
www.bluemed.aeroTotal flight efficiency savings
In the following chart a summary of overall benefits deriving from the BLUE MED
FAB implementation are presented. These values were used for the CBA/What-If
Analysis
BLUE MED FAB - Flight Efficiency saving
Yearly Fuel saving Yearly CO2 saving Yearly Time saving Yearly NOx saving
Scenarios [Kg] [Ton] [Min] [Ton]
2012 34.361.237 107.899 686.780 430.264
2015 56.309.416 176.815 1.127.745 711.619
2015+ Free
81.800.366 256.855 1.615.236 1.020.744
Route
2020 + Free
110.219.406 346.095 2.110.040 1.414.926
Route
www.bluemed.aeroATM capacity and delay benefits evaluation
Capacity increase, calculated in the following table as the difference between the
overall capacity increase expected for BLUE MED FAB implementation scenarios
and the actual capacity for every BLUE MED Partner, is mainly impacting on the
decrease in delays, in particular for those situations with higher historical delay
values within the FAB
BLUE MED FAB - Capacity saving
Capacity increase
Scenario [% - value]
Capacity amount for each sector – due to FAB optimized ATS Route Network
2012
10% Increase - due to ATFCM H24 (Cyprus)
Capacity amount for each sector – due to FAB optimized ATS Route Network
Uniform en route Lateral separation minima (5 NM) - difference between the overall
2015
capacity increase expected for 2015 and the capacity increase for 2012
10% increase – due to FAB Sector configuration improvements
www.bluemed.aeroATM capacity and delay benefits evaluation
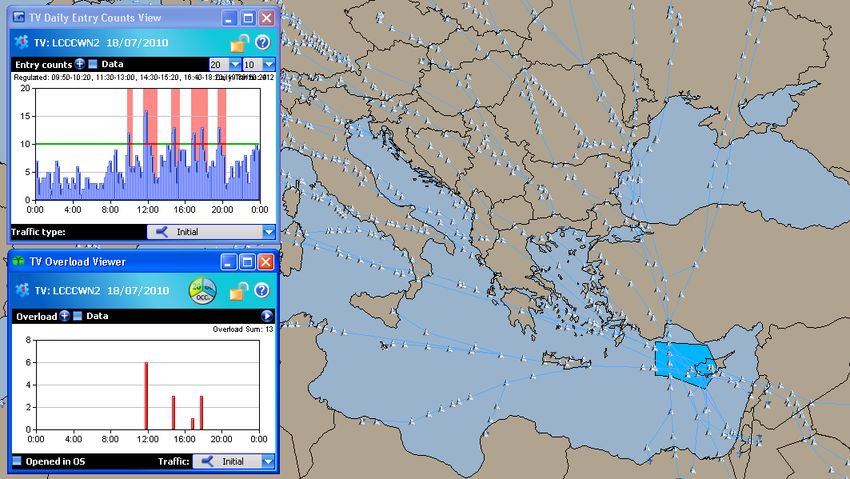
Delay savings related to BLUE MED FAB were calculated considering projection
scenarios in 2012 and 2015 both for the baseline and in case BM FAB is
implemented with the following settings:
EUROCONTROL tool NEVAC
Traffic Sample 18th July 2010
Flights below FL195 have been removed
Network organisation and ATC Sector configurations retrieved in accordance with BLUE
MED Route Network Catalogue, Project Deliverables “D1.2a FAB 2012 FTS Design
Report “ and “D1.2b FAB 2012 Design Report”
The Traffic Sample has been increased to 2012 and 2015 values according to STATFOR
hypothesis (Base)
All ATC sectors with demand above capacity have been “regulated” (even if for one
single flight)
www.bluemed.aeroNEVAC Analysis www.bluemed.aero
NEVAC Analysis

   www.bluemed.aero
CBA qualitative benefits
The concurrent implementation of different improvements expected within the
BLUE MED FAB allows to gain several benefits that, even if not quantitative, can
however optimize to a great extent ATM/ANS management of involved FAB
Partners
Safety Safety increase
Training Harmonized Training delivery and ANS Training Centers Integration
Procurement Common Procurement
Control Procedures Harmonized Interoperability and transfer of control procedures
Qualitative
Airspace Management Harmonization of Airspace Management
Reserved Airspace Harmonization management of the reserved airspace
AIS Harmonization of Aeronautical Information System data and procedures
Surveillance Data Harmonization and sharing Surveillance Data
CDM Development of Airport Collaborative Decision Making (CDM)
www.bluemed.aeroBLUE MED FAB establishment Costs
Having regard to the costs for the BLUE MED FAB establishment, main costs
considered are those related to the initial implementation of BLUE MED FAB quick-
wins activities (linked to technical and operational improvements), for each
professional profile involved
As for the costs considered on the 2012+ timeframe, strategic project’s assumptions
defined at FAB level were:
No infrastructural costs/investments required in addition to those already planned by
Partners and included in each LSSIP
No personnel/organizational variations envisaged
Governance and management costs of BLUE MED FAB in the 2012+ Implementation
Phase estimated (~ 3 M€ per year)
Costs for specific support activities considered (e.g. such as routes re-design and
optimizations), quantified on the basis of hourly gross personnel costs for professional
profiles for ANSPs involved
www.bluemed.aeroResults of the analysis:
NPV calculation
To assess the economic benefits induced by the BLUE MED FAB and to calculate
the Net Present Value of the project, three different macro-scenarios were identified:
Low concurrent impact of events that contribute to the lowest value of the NPV (typically
lowest values, except for discount rate and exchange rate that show inverse
proportionality to the NPV)
Base concurrent impact of events that contribute to an intermediate value of the NPV (base
values for selected parameters)
High concurrent impact of events that contribute to the highest value of the NPV (typically
highest values, except for discount rate and exchange rate that show inverse
proportionality to the NPV)
www.bluemed.aeroResults of the analysis:
NPV calculation
The main variables taken into account to determine scenarios’ outcome are: Fuel
price; CO2 price; Exchange rate; Cost of delay; Ratio of achievement of planned
results; Traffic forecasts (based on STATFOR forecasts); Discount rate. The
following table summarizes parameters value considered for each scenario:
www.bluemed.aeroResults of the analysis:
NPV calculation
62,2
47,7
Delay benefit
32,5
CO2 benefit
Time benefit
Fuel benefit
High Base Low
Figure 1 – CBA results for each scenario (2012, € millions)
227,1
ANSPs benefit
156,5
Delay benefit
115,6
CO2 benefit Figure 3 – Probabilistic distribution of overall NPV in the case of BLUE MED
FAB establishment (2012 – 2020)
Time benefit
Fuel benefit
High Base Low
Figure 2 – What-If deterministic results for each scenario (2015; € millions)
www.bluemed.aeroCBA conclusions
The overall Economic evaluations performed for the CBA (2012) and What-If
analyses (2015 and 2020) show a positive contribution to the overall BLUE MED
FAB financial case
Particularly, the overall probabilistic NPV of the BLUE MED FAB lies in the range 1,3 –
1,7 billions €
Such positive NPV results do not consider qualitative benefits that strongly contribute to
reinforce the overall business case of the BLUE MED FAB, in particular on such issues
as safety and training. Although not contributing directly to the numeric results of the
CBA and What-If analyses, each of these qualitative benefits constitutes a positive
indeterminate value to consider in addition to the results stemming from the considered
quantitative benefits
Economic evaluations have been performed according to a prudential approach, also in
order to take into account the uncertainties related to the macro-economic scenario. It is
worth noting that, not considering such current stringent uncertainties, it could be
estimated that the BLUE MED FAB might have a maximum theoretical overall NPV of
around 4 billion € over the 2012 – 2020 timeframe
www.bluemed.aero..questions??
www.bluemed.aeroYou can also read