Potential of national rail investments in France for mitigation of greenhouse gas emissions - IIP
←
→
Page content transcription
If your browser does not render page correctly, please read the page content below
Potential of national rail investments in France
for mitigation of greenhouse gas emissions

Sylvain Séguret
Advisor for sustainable mobility, Strategy / Regulation department

International Conference “Climate Change and Transport”
KIT / WCTRS, 9th October 2014
France and GHG emissions

Targets for cutting French GHG emissions are ambitious: -75% 2050/1990
   (« factor 4 »), but the country is on the right trend since 2006

Transports = 26 % of GHGE (sector nr 1), stable (≠ national trend)

GHGE mitigation is one of the              Evolution of French GHG emissions
few long term quantitative                and specific targets set out for France
targets impacting the whole
country and its activities

  What contribution of the transport
  sector?
       Short / long distance transport?
       Rail and modal shift?
             High speed rail?

   2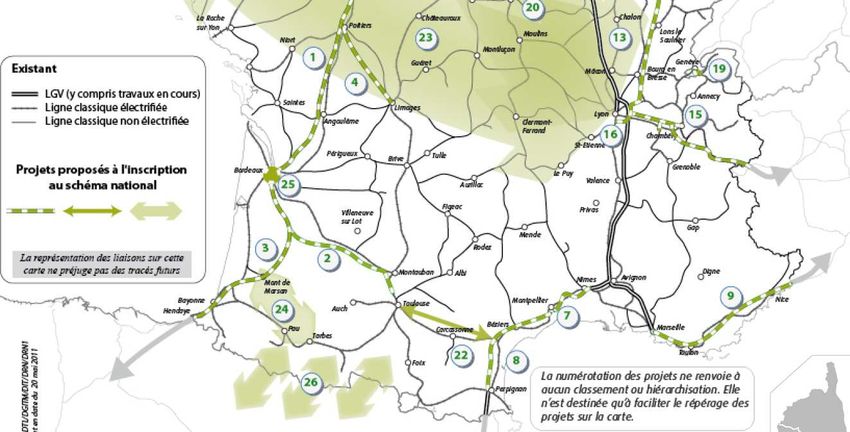
High speed rail in France

2.036 km of HSL in operation (28 % of EU’s total), starting 1981
                                                                   High speed rail transport
+ 700 km in construction to be open until 2017                         in Europe (2012)
About 470 HS train sets running 139,5 M train-km
   (2/3 performed on HSL)

54 billion pkm (58 % of passenger rail transport in France)

Competitiveness of the HS system based on:
     The geographical structure of the French territory,
     generating a concentred and high demand of transport at
     the national scale and cutting costs per passenger
     SNCF’s innovations (yield management applied to rail, low
     cost subsidies…)
  The most advanced high speed rail system in Europe
   … with still development potential (Toulouse, Côte
   d’Azur, etc.)
    3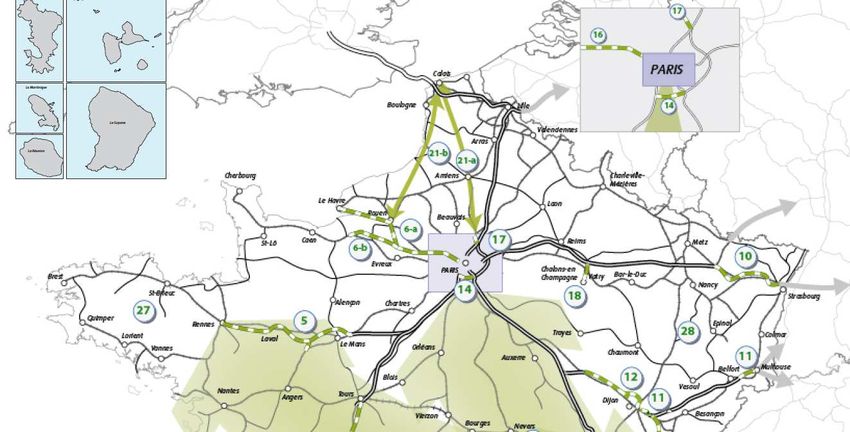
High speed rail as a mean of cutting GHG emissions

                                                                         CO2 emissions per HSR pkm in Europe (2005)
GHGE of HSR strongly varies from                                         50
  country to country, mainly depending

                                                  g CO2 / passenger-km
                                                                         40
  on:
                                                                         30
 1) GHG content of energy supplied to rail
                                                                         20
 operators (nuclear power: 80% of the
 French electricity supply)                                              10
 2) Energy efficiency of rail operation.
                                                                          0
 French HSR is despite speed as much as                                       BE CZ DE ES FI FR IT NL PL PT SE UK
 energy efficient per pkm than usual IC trains.                               Source: Eur. Com., MVV, Tractebel (2009)

France is almost where HSR has the best advantage by GHGE on other
   transport modes

        Mass transport system + Potential + Low carbon transport
                                           =
      France as a very good place to invest in HSR for cutting GHGE

  4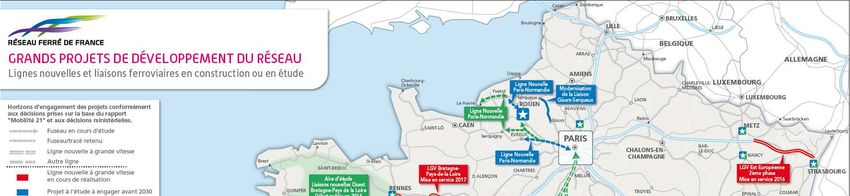
The contribution of high speed rail by mitigation of
              GHGE, backcasting methods
Key figures per mode in various mobility scenarios
       in the LET-Enerdata “Factor 4 study”
                                                                             LET-Enerdata “Factor 4 study” (H.
                     CO2 emissions                                           Lopez-Ruiz 2009) about needed
                 Factor 2                                                    conditions to cut GHGE by 75% until
                             Factor 3                                        2050 in transport (passenger &
                                          Factor 4
                                                                             freight together)

                                                                             Scenarios varying according to
                    Passenger traffic
                                                                             macro parameters (value of time,
                                                                             regulations, innovations…)
                                                                                HSR ridership should reach 157 to 186 Gpkm
                                                                                => X 3
                                                                                Investment in rail should be increased 6 times
                                                                                Is this sustainable?
              Investment in infrastructures
                                                                                Where investments should be done?
Investment       Average     Pégase       Chronos            Hestia
 / year bn€     2008-2012   until 2050    until 2050        until 2050

   Road           10,7         21               8                3
   Rail            3,4         15              31               20
          5                              Source: Lopez-Ruiz, Crozet (2011)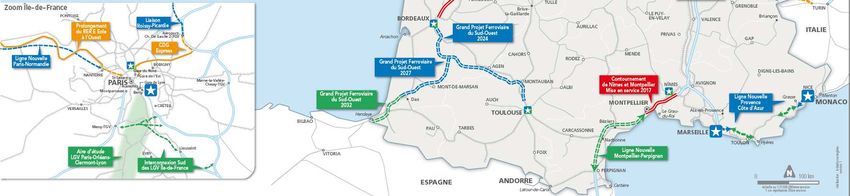
Main rail infrastructure projects in France before Mobilité 21 task force
 Main rail infrastructure projects
                 proposed for the
National Transport Infrastructure
              Scheme (SNIT, 2011)
SNIT results directly from :
    Government’s engagement
    (“Grenelle” 2009) to build
    2500+2000 km of new HSL
    Local pressures leading to a
    new HSL in each region
Over 110 bn€ investments in
 new rail infrastructures
 (= 45% of investments in all planed
 transport infrastructures)

Seen as unrealistic scheme:
    RFF’s debt was already close
    to 30 bn€
    Actual investments in HSL
    (2008-2012) only 1,3 bn€/year
  Mobilité 21 task force to
 prioritize investments
 according to actual needs
       6
 and available  budget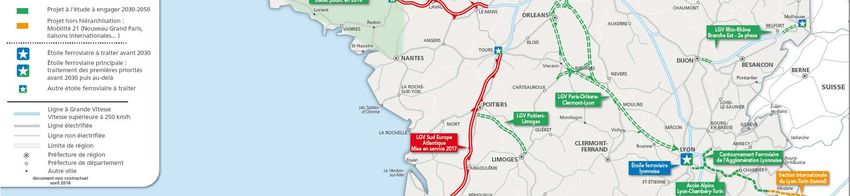
Main rail infrastructure projects in France after Mobilité 21 task force
and new government’s orientations

        HSL in construction
        Project to start < 2030
        Project to start < 2050

    7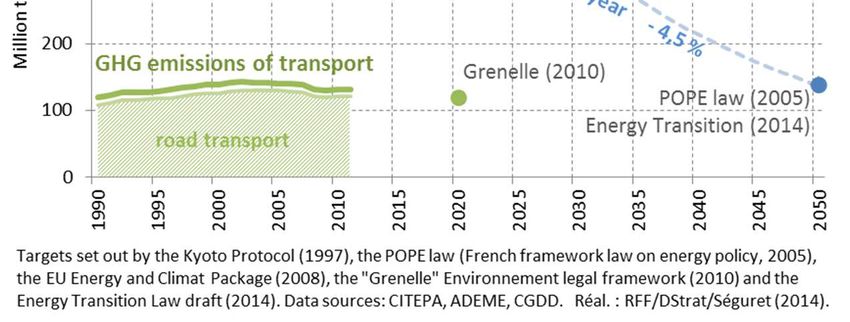
Impact of various
       long distance rail
       investment strategies
       on GHG emissions
       in France
Study by 3 independent experts Gérard MATHIEU, Jacques PAVAUX, Marc GAUDRY (2013)
for Réseau ferré de France / Strategy department (follow up: S. Séguret)
in association with
       FNE, the national federation of environment associations in France
       FNAUT, the national federation of public transport users
   8
       ADEME, the state agency for environment and energy saving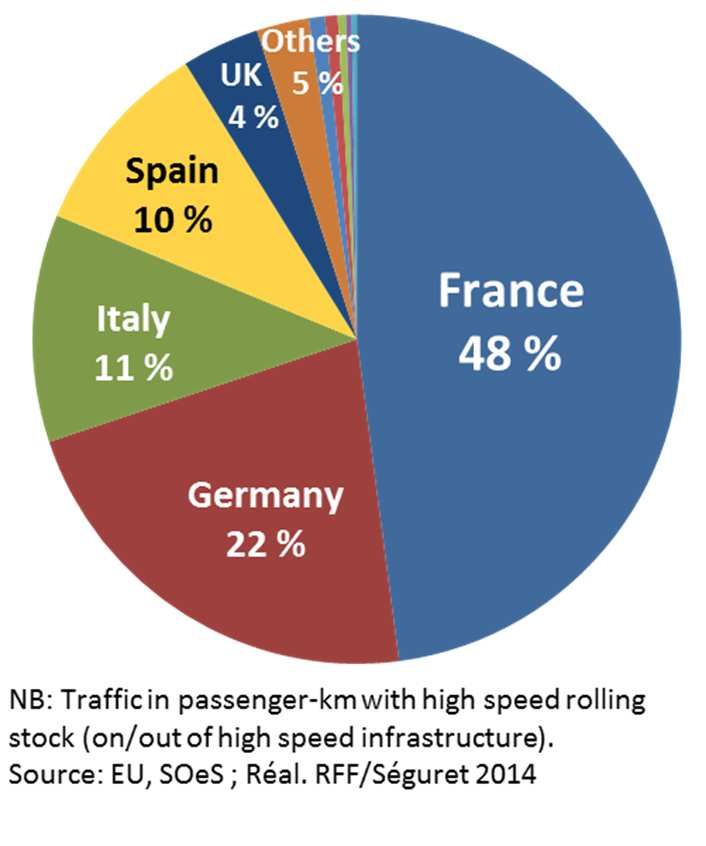
Purpose and context of the study

Purpose:
        to set a global vision about the potential of GHGE mitigation of rail
            ( ≠ usual vision project by project)
        to calm down the debate about network development and new HSL
        to open strategic studies to stakeholders in need of objective information
Context:
        Study done between late 2010 to early 2013, after the government announced
        4500 km of new high speed lines (Grenelle Environnement)
Title:
        « Evaluation de la contribution du réseau et de la politique ferroviaires à l’objectif
        du facteur 4 pour les déplacements des voyageurs à moyenne et longue distance »

    9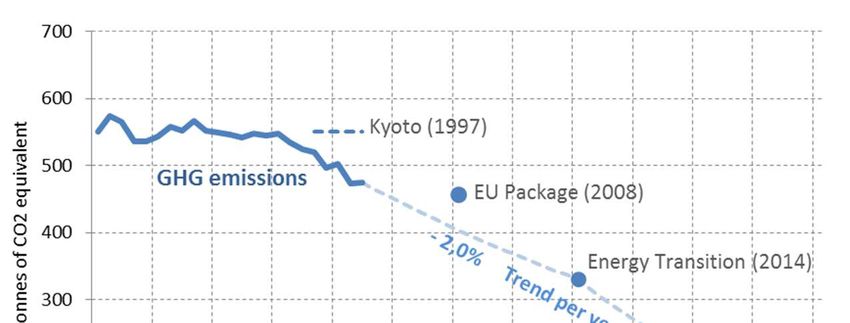
Key features of the study

Scope: only long distance passenger traffic on the main interurban corridors
Massive data got from previous studies concerning infrastructure projects
  (mainly HSL) which have been never summed up together before
Study based on 4 contrasted scenarios of rail network development until 2050,
   determining in each scenario a HSL or a conventional line (with maximum
   speeds) for sections of 100 to 200 km of corridor
Only one macro-economic framework (transport policy and prices, competition,
   etc.), to point the impact of various investment strategies on the network
      Main factor are the infrastructure features
Results per corridor have been anonymised, to focus attention on the
   development strategies and not interfere with project management

 10
Methodology (1)
Socio-economic features:
Energy price (oil barrel): 80 $ in 2010, 120 $ in 2020, 160 $ in 2050 (constant $)
Costs of transport modes: air = rail ; road: < rail until 2025 than > rail
Load of transport vehicles: car: 1,82 pass/veh in 2012, 2,15 in 2050
GHGE of transport modes (electric cars, green fuels, etc.) and construction of rail infrastructure
(see RFF carbon footprint of Rhin-Rhône HSL)
Hypothesis of GHGE per mode of transport (geqCO2/pkm)
Year Air * Car ** High speed train ***
2012 262 121 7
2030 220 96 7
2050 (1) 200 78 7
2050 (2) 200 71 7
* Including greenhouse effect of cirrus clouds and condensation trails (global warming potential => GHGE x 2)
** Including maintenance of infrastructure *** Excluding construction and infrastructure operation
All other emissions included (life cycle emissions of vehicles, GHG content of energy, etc.)
1) Without electric car and with 75 % electricity from nuclear power or renewable energy
2) With 40 % of electric cars and 75 % electricity from nuclear power or renewable energy
11Methodology (2)
4 « network orientations » representing various network development strategies:
A1 : active development of the HSL network (≈ equivalent to SNIT)
A2 : similar to A1 but with some mixed passenger/freight new lines
B1 : performance upgrade of the core network (including existing HSL) + some of the most
pertinent new HSL
B2 : similar to B1 but with performance upgrade on all corridors mentioned in the national
scheme SNIT 2011
Applying these network orientations on the 15 main corridors + 10 additional
corridors or functionalities mentioned in the SNIT 2011
Traffic forecasts per corridor and mode related to scenario assumptions (main
parameter: travel times)
Assessment of GHG emissions per corridor:
of infrastructure works defined in the network orientations
avoided thanks to modal shift from other modes to rail (including rail traffic induction)
12Results
2 parameters to compare the GHGE efficiency of development strategies:
Amortisation period of GHG emissions due to infrastructure works, i.e. time needed the
avoided GHG emissions reach the emissions of construction
Average cost of avoided GHG emissions (€ / tonne)
Example of corridor Bordeaux – Toulouse :
Bilanfootprint
Carbon carbone cumulé d'année
of the en année
planed HSL de Bordeaux-Toulouse
Bordeaux – Toulouse
(en millions de tonnes
Cumulative chronicle éqCO 2)
Carbon footprint of theannuels
Les bilans carbone planed HSL Bordeaux(A1)
de Bordeaux-Toulouse – Toulouse
(en milliers de tonnes d'éqCO2)
Yearly chronicle 2
400
Millions de tonnes d'éqCO 2
1
300
Emissions of construction
Milliers de tonnes d'éqCO2
200 0
15
17
19
21
23
25
27
29
31
33
35
37
39
41
43
45
47
49
20
20
20
20
20
20
20
20
20
20
20
20
20
20
20
20
20
20
100
-1
Emissions avoided due to modal shift
0
-2
15
17
19
21
23
25
27
29
31
33
35
37
39
41
43
45
47
49
20
20
20
20
20
20
20
20
20
20
20
20
20
20
20
20
20
20
-100
-3
-200
-300
-4
15/10/2014
Réal. J. Pavaux, in Mathieu, Pavaux, Gaudry (2013) Réal. J. Pavaux, in Mathieu, Pavaux, Gaudry (2013)
13Results
Network orientation A1 (« full HSL »)
Amortisation period varies strongly across corridors
From 5 to 50 years for passenger HSL
Durée d'amortissement des émissions de CO2 engendrées par la construction de
Amortisation
l'infrastruture ettime ofà GHG
calculée partir de emissions due
la mise en service pourto infrastructure
chacun works
des 15 axes étudiés
on the 15 main corridors
60
axe reliant Paris ou la
RIF directement ou en
50 prolongement d'un axe
existant
N o m b re d 'a n n é e s
40
Seul axe ne reliant pas
30 Paris ou la RIF ni
directement ni en
prolongement d'un axe
existant
20
axe ne détournant
10 presqu'aucun trafic
aérien
0
15/10/2014 1 2 3 4 5 6 7 8 9 10 11 12 13 14 15
Réal. J. Pavaux, in Mathieu, Pavaux, Gaudry (2013)
14Results
Network orientation A1 (« full HSL scenario »)
The point of carbon neutrality depends on when operation starts
and on the carbon efficiency of the project
Cumul carbon
Cumulative des émissions de CO
footprint on2 en fonction
time du temps
of 2 planed dansinl'orientation
HSL A1
different corridors
axe 2 axe 11
4
2
Millions de tonnes d'éqCO2
0
2020
2022
2024
2026
2028
2030
2032
2034
2036
2038
2040
2042
2044
2046
2048
2050
2052
2054
2056
2058
2060
-2
-4
-6
-8
-10
-12
15/10/2014
-14
15
Réal. J. Pavaux, in Mathieu, Pavaux, Gaudry (2013)Results
Network orientation A1 (« full HSL scenario »)
The point of carbon neutrality depends on when operation starts
and on the carbon efficiency of the project
Comparaison des bilans carbone cumulés d'année en année pour les
Cumulative
deux carbon footprint
axes qui sont for
les plus the 2 most
efficaces (1 et 2)(nr 1&
et les 2) qui
deux / less (nrle14 & 15)
le sont
moinsefficient planed
(14 et 15) dans HSL A1
l'orientation
Axe 1 Axe 2 Axe 14 Axe 15
4
2
Millions de tonnes d'éqCO2
0
2015
2017
2019
2021
2023
2025
2027
2029
2031
2033
2035
2037
2039
2041
2043
2045
2047
2049
2051
2053
2055
2057
2059
-2
-4
-6
-8
-10
-12
-14
-16
15/10/2014
-18
16
Réal. J. Pavaux, in Mathieu, Pavaux, Gaudry (2013)Results
Network orientation A1 (« full HSL scenario »)
Bilan carbone pour chaque année et pour la totalité des 15 axes dans
Cumulativel'orientation
carbon footprint in 2015
A1 entre the full scenario A1
et 2045
3,0
Construction of the first new lines
2,0
Millions de tonnes de CO2
1,0
First lines in operation, new lines in construction
0,0
2015
2017
2019
2021
2023
2025
2027
2029
2031
2033
2035
2037
2039
2041
2043
2045
2047
2049
2051
2053
2055
2057
2059
-1,0
-2,0
-3,0
HS network completed
-4,0
15/10/2014
Réal. J. Pavaux, in Mathieu, Pavaux, Gaudry (2013)
17Results
Network orientation A1 (« full HSL scenario »)
Traffic shift from air have a major impact on the carbon footprint of the planed HSL
Durée d'amortissement des émissions de CO2 à partir de la mise
Amortisation period of GHGE and traffic shift from air to rail
en service en fonction du volume de report aérien
of 12 corridors with air-rail competition
60
period (years)
50
N om bre d'années
40
30
Amortisation
20
10
0
0 200 400 600 800 1 000 1 200 1 400 1 600
Millions de PKT
Traffic shiftreportés
air to railpar an 2030)
(pkm (est. 2030)
15/10/2014
Réal. J. Pavaux, in Mathieu, Pavaux, Gaudry (2013)
18Results
Network orientation A1 (« full HSL scenario »)
Bilan carbone cumulé d'année en année avec la réalisation de la
Cumulative carbon footprint in the full scenario A1
totalité des solutions retenues dans l'orientation A1 pour les 15 axes
20
Construction of the first new lines
10
Millions de tonnes d'éqCO2
0
2015
2017
2019
2021
2023
2025
2027
2029
2031
2033
2035
2037
2039
2041
2043
2045
2047
2049
2051
2053
2055
2057
2059
-10
-20
First lines in operation, new lines in construction
-30
-40
-50
HS network completed
-60
-70
15/10/2014
Réal. J. Pavaux, in Mathieu, Pavaux, Gaudry (2013)
19Results
Network orientation A1 (« full HSL scenario »)
Bilans carbone cumulés d'année en année pour trois programmes
Cumulative carbon footprint for 3 various investment programs in A1
différents de l'orientation A1
Total
All 15des 15 axes
corridors The
Les 55 most
axes efficient corridors
les plus efficaces Les
The 33 axes
most les plus efficaces
efficient corridors
20
10
Millions de tonnes d'éqCO 2
0
2015
2017
2019
2021
2023
2025
2027
2029
2031
2033
2035
2037
2039
2041
2043
2045
2047
2049
2051
2053
2055
2057
2059
-10
-20
-30
-40
-50
-60
-70
Réal. J. Pavaux, in Mathieu, Pavaux, Gaudry (2013)
15/10/2014 2048 : balance of the 3 most efficient corridors = all 15 corridors
20
2052 : balance of the 5 most efficient corridors = all 15 corridorsResults
Network orientation A1 (« full HSL scenario »)
Corrélation entre la durée d'amortissement des émissions fixes
Amortisation
et le coûtperiod of GHGE
de la tonne de CO2and cost
évitée ofdix
pour avoided GHGE
axes dans
on 10 l'orientation
different corridors
A1
Amortisation
Durée period of GHG
d'amortissement du CO2 Cost
Coûtper avoided GHG ton
CO2/tonne
60 1 800
(euros)
1 600
(années)
50
ton (€)
GHG
1 400
évitées
period of
40 1 200
GHG
d'amortissement
de CO2
1 000
avoided
30
Amortisation
800
tonne
20 600
de laper
Durée
Coût Cost
400
10
200
0 0
1 2 3 5 10 11 12 13 14 15
15/10/2014 Réal. J. Pavaux, in Mathieu, Pavaux, Gaudry (2013)
21Results
Key figures about network orientations A1 (« full HSL »)
and B1 (the most likely scenario)
A1 B1
Number of corridors units 15 13
Total investment bn€ 82,6 75,4
GHG of construction Million tons CO2 eq. 24,9 21,8
Carbon footprint 2030 Million tons CO2 eq. 4,6 5,2
Carbon footprint 2050 Million tons CO2 eq. -34,6 -30
Carbon footprint 2060 Million tons CO2 eq. -64,3 -57,3
15/10/2014
22Results
Key figures about network orientations A1 (« full HSL »)
and B1 (the most likely scenario)
Émissions totales de CO2 engendrées par la construction sur les
GHG emissions of infrastructure development on the main corridors
15 axes des solutions retenues pour les orientations A1 et B1 (en
in network orientations A1 and B1
millions de tonnes)
A1 B1
5,0
Millions de tonnes d'éqCO2
4,5
4,0
3,5
3,0
2,5
2,0
1,5
1,0
0,5
0,0
1 2 3 4 5 6 7 8 9 10 11 12 13 14 15
15/10/2014
Réal. J. Pavaux, in Mathieu, Pavaux, Gaudry (2013)
23Results
Key figures about network orientations A1 (« full HSL »)
and B1 (the most likely scenario)
Comparaison des durées d'amortissement du CO de 2
Amortisation period of GHG emissions of infrastructure development in
l'infrastructure network
à partir de la mise enservice pour
orientations A1 and B1 les 13 axes
conservés dans l'orientation B1
Some line upgrading are
A1 B1 more efficient than new HSL
50
45
Some line upgrading are
40
less efficient than new HSL
Nombre d'années
35
30
25 Some corridors get the
same development in
20 every scenario
15
10
5
0
1 2 3 4 5 6 8 9 10 11 12 14 15
15/10/2014
Réal. J. Pavaux, in Mathieu, Pavaux, Gaudry (2013)
24Results
Key figures about network orientations B1 (the most likely
scenario) and B2 (B1 upgraded)
Comparaison des durées d'amortissement du CO de l'infrastructure à
2
Amortisation period of GHG emissions of infrastructure development in
partir de la mise enservice pour les 13 axes faisant l'objet d'une
network orientations B1 and B2
maximisation dans les orientations B1 et B2
B1 B2
50
45
Nombre d'années
40
35
30
25
20
15
10
5
0
1 2 3 4 5 6 8 9 10 11 12 14 15
Axes
Réal. J. Pavaux, in Mathieu, Pavaux, Gaudry (2013)
15/10/2014 Disparity is much stronger among corridors than among
25 network development strategiesResults
Comparison of the 4 network orientations
Cumulativeducarbon
Comparaison footprint
bilan carbone of d'année
cumulé infrastructure
en annéedevelopment
de l'axe 14 dans
les quatre
on corridor 14orientations
(Dijon – Lyon)
A1 A2 B1 B2
2,0
1,5
Millions de tonnes d'éqCO2
1,0
0,5
0,0
2015
2017
2019
2021
2023
2025
2027
2029
2031
2033
2035
2037
2039
2041
2043
2045
2047
2049
2051
2053
2055
2057
2059
2061
2063
2065
-0,5
-1,0
-1,5
Réal. J. Pavaux, in Mathieu, Pavaux, Gaudry (2013)
15/10/2014 In some cases, carbon amortisation can be shorter by
26 optimising the existing line than building a new HSLConclusions, some key figures
For comparable journeys within the study’s scope:
Each air passenger-km contributes 36 times more to climate change than with HSL
In 2030, the same ratio air / HSL will still be of 1/30
For car, actual ratio of 1/16, will be 1/13 en 2030
By every network orientation, no positive cumulative balance before 2035/2040
Between 2015 and 2050, 30 to 35 MtCO2eq can be saved by building new HSL and
upgrading the rail network, i.e.:
≈ 1 Mt par an (about 1% of the emissions of the total sector of transport in France)
≈ 0,2 % of French GHG emissions
After 2050, the net balance of the network development reaches about 3 MtCO2éq
avoided every year, i.e. :
≈ 0,5 % of total GHG emissions of France in 2012
≈ 2 % of total GHG emissions of the transport sector (25 %)
15/10/2014 200 % of actual GHG emissions of HSR
27Conclusions, some key figures
New HSL are mainly more GHG efficient than optimising existing infrastructure but not
in all cases, depending mainly on the among of traffic and the modal shift from air
The 5 corridors with the best carbon footprint in every network orientations are:
1. Marseilles – Italy
2. Montpellier – Perpignan
3. Lyon – Turin (passenger & freight)
4. South Paris bypass (2)
5. Bordeaux – Toulouse
HSR investments in France cut massively GHGE
… but less than people usually think (this is not THE solution for mobility)
… and at a very high cost per avoided emissions compared with over solutions
(optimise rail network use, urban planning, non motorised transport, low GHGE
activities…).
Don’t burn all the cash on building HSL!
28Thank you for
your attention
29You can also read