Sustainable Development Goals Progress Chart 2021 - United ...
←
→
Page content transcription
If your browser does not render page correctly, please read the page content below
Sustainable Development Goals Progress Chart 2021
Sustainable Development Goals Progress Chart 2021
The Sustainable Development Goals Progress Chart 2021 presents a snapshot of global and regional progress towards selected targets under the 17 Goals of the 2030 Agenda for Sustainable Development.
The assessment is based on the most up-to-date data available. However, the full impact of the COVID-19 pandemic is not yet known. Moreover, since 2020, the pandemic has disrupted statistical
operations worldwide, limiting the ability of many national statistical offices to deliver the data needed to monitor progress on the Sustainable Development Goals (SDGs).
The progress chart shows that the world was already off track in realizing the ambitions and fulfilling the commitments of the 2030 Agenda, even before COVID-19. As the pandemic continues to
unfold, it is also magnifying deeply rooted problems: insufficient social protection, weak public health systems and inadequate health coverage, structural inequalities, environmental degradation and
climate change. It is a crisis as well as an opportunity to make the transformations needed to deliver on the promise of the 2030 Agenda.
The progress chart presents two types of information: 1) a trend assessment using stoplight colours to measure progress towards the target (from a baseline year to the most recent data point), and
2) a level assessment using a gauge meter to measure the current level of development with respect to the distance from a target, using the latest data. The chart is based on a limited number of
indicators and on information available as of June 2021. A baseline year of around 2015 or 2010 is used for the trend assessment. For most of the indicators, the latest available data are from 2019 to
2020; for a few indicators, the data are from 2017.

                                                                                           Northern                  Eastern and Latin America
                                                                        Sub-Saharan        Africa and   Central and South-Eastern   and the                           Pacific island      Developed
 Goal and targets                                       World              Africa         Western Asia Southern Asia    Asia       Caribbean                           countries*         countries*

 Goal 1 | End poverty in all its forms everywhere

 Eradicate extreme poverty
 for all people everywhere1

 Achieve substantial social protection
 coverage 2

 Goal 2 | End hunger, achieve food security and improved nutrition and promote sustainable agriculture

 Ensure access by all people to safe, nutritious
 and sufficient food all year round

 By 2025, achieve a 40 per cent reduction
 from 2012 in the number of stunted children
 under 5 years3, 4

 Goal 3 | Ensure healthy lives and promote well-being for all at all ages

 Increase the coverage of births attended by
 skilled health personnel 5

                                                                                                    1
Northern Eastern and Latin America
Sub-Saharan Africa and Central and South-Eastern and the Pacific island Developed
Goal and targets World Africa Western Asia Southern Asia Asia Caribbean countries* countries*
Reduce under-5 mortality to at least
as low as 25 per 1,000 live births5
End the epidemic of malaria 6
Increase diphtheria-tetanus-pertussis
vaccine coverage among 1-year-olds
Goal 4 | Ensure inclusive and equitable quality education and promote lifelong opportunities for all
Ensure all girls and boys complete primary
education
Goal 5 | Achieve gender equality and empower all women and girls
Eliminate child marriage 5
Ensure women’s full participation and equal
opportunities in national parliaments
Goal 6 | Ensure availability and sustainable management of water and sanitation for all
Achieve universal access to safely managed
drinking water services7
Achieve universal access to safely managed
sanitation services7
2Northern Eastern and Latin America
Sub-Saharan Africa and Central and South-Eastern and the Pacific island Developed
Goal and targets World Africa Western Asia Southern Asia Asia Caribbean countries* countries*
Goal 7 | Ensure access to affordable, reliable, sustainable and modern energy for all
Achieve universal access to electricity
Double the global rate of improvement
in energy efficiency5, 8
Goal 8 | Promote sustained, inclusive and sustainable economic growth, full and productive employment and decent work for all
Sustain per capita economic growth 9
Achieve full employment
Goal 9 | Build resilient infrastructure, promote inclusive and sustainable industrialization and foster innovation
Significantly raise industry’s share of GDP
Substantially increase the expenditure for
scientific research and development as a
proportion of GDP
Increase access to mobile networks
Goal 10 | Reduce inequality within and among countries
Reduce inequality within countries5, 10
3Northern Eastern and Latin America
Sub-Saharan Africa and Central and South-Eastern and the Pacific island Developed
Goal and targets World Africa Western Asia Southern Asia Asia Caribbean countries* countries*
Goal 11 | Make cities and human settlements inclusive, safe, resilient and sustainable
Reduce the proportion of urban population
living in slums
Goal 12 | Ensure sustainable consumption and production patterns
Reduce the domestic material consumption
per unit of GDP
Rationalize inefficient fossil-fuel subsidies
per unit of GDP
Goal 13 | Take urgent action to combat climate change and its impacts
Reduce global greenhouse gas emissions11, 12
Goal 14 | Conserve and sustainably use the oceans, seas and marine resources for sustainable development
Increase the proportion of fish stocks within
biologically sustainable levels11
Increase the coverage of protected areas in
relation to marine Key Biodiversity Areas7
Goal 15 | Protect, restore and promote sustainable use of terrestrial ecosystems, sustainably manage forests, combat desertification, and halt and reverse land degradation and halt biodiversity loss
By 2020, ensure the conservation, restoration
and sustainable use of terrestrial ecosystems7
By 2020, protect and prevent the extinction
of threatened species7, 13
4Northern Eastern and Latin America
Sub-Saharan Africa and Central and South-Eastern and the Pacific island Developed
Goal and targets World Africa Western Asia Southern Asia Asia Caribbean countries* countries*
Goal 16 | Promote peaceful and inclusive societies for sustainable development, provide access to justice for all and build effective, accountable and inclusive institutions at all levels
Significantly reduce homicide rates14
Reduce the proportion of unsentenced
detainees14
Increase the proportion of countries with
independent national human rights institutions
in compliance with the Paris Principles
Goal 17 | Strengthen the means of implementation and revitalize the Global Partnership for Sustainable Development
Ensure full implementation of the net official
development assistance disbursements by
donor countries11
Enhance access to technology by increasing
internet use
Increase proportion of countries with a
national statistical plan that is fully funded15
Legend
Trend (colour and arrow, arrowhead) Current level
Substantial progress/on track Limited or no progress
Fair progress but acceleration needed Deterioration Target met Close to Moderate Far from Very far Insufficient
or almost target distance target from target data
met to target
5Notes
* The category “Pacific island countries” refers to Oceania excluding Australia and New Zealand. The category “developed countries” includes Europe, Northern America, Australia and New Zealand.
1
The latest data used for both trend and level assessments are 2020 nowcasts with high uncertainty.
2
Due to improvement in data quality and availability, 2020 estimates for Northern Africa and Western Asia, Latin America and the Caribbean, and Pacific island countries are not comparable with
baseline values. Only level assessments based on 2020 estimates are available for these regions.
3
Trend assessment uses a baseline year around 2012.
4
Level assessment is based on the level of stunting prevalence. From left to right of the gauge meter, the five levels are: very high, high, moderate, low, and very low stunting prevalence.
5
Trend assessment uses a baseline year around 2010.
6
Trend assessment is based on the World Health Organization Global Technical Strategy for Malaria 2016–2030, which is reducing malaria case incidence by at least 90 per cent by 2030. Level
assessment is based on the level of malaria incidence. From left to right of the gauge meter, the five levels are: very high, high, moderate, low and very low malaria incidence.
7
The assessment for “developed countries” refers to Europe and Northern America only.
8
Level assessment is based on the level of energy intensity. From left to right of the gauge meter, the five levels are: high, medium-high, medium, medium-low and low energy intensity.
9
Baseline value is the average annual growth rate of real GDP per capita from 2000 to 2015. The trend assessment is the comparison of the average annual growth rate of real GDP per capita from
2015 to 2019 with the baseline value or target value of 2 per cent.
10
This assessment is based on the Gini Index. From left to right of the gauge meter, the five levels are: very high, high, moderately high, moderately low and low inequality.
11
Assessment is only at the global level.
12
Lockdowns and other COVID-19 response measures resulted a temporary reduction in greenhouse gas emissions in 2020. However, emissions had almost fully rebounded in later 2020 and are
expected to rise further unless critical steps are taken to shift economies toward carbon neutrality.
13
Level and trend assessment are based on the Red List Index and regional disaggregations of the index.
14
From left to right of the gauge meter, the five levels are: very high, high, moderate, low, and very low level.
15
Trend assessment is based on progress from 2017 to 2020.
For regional groupings, country data and technical note for the progress chart, please refer to: https://unstats.un.org/sdgs. Country experiences in each region may differ significantly from the
regional average. Due to updated data and revised methodologies, this Progress Chart is not comparable with previous versions.
Sources
United Nations, based on the latest available data and estimates as of June 2021 provided by: Department of Economic and Social Affairs, Food and Agriculture Organization, International Energy
Agency, International Labour Organization, Inter-Parliamentary Union, International Renewable Energy Agency, International Telecommunication Union, International Union for Conservation of
Nature, Office of the United Nations High Commissioner for Human Rights, Organization for Economic and Cooperation and Development, Partnership in Statistics for Development in the 21st
Century, Secretariat of the United Nations Framework Convention on Climate Change, United Nations Children’s Fund, United Nations Educational, Scientific and Cultural Organization, United Nations
Entity for Gender Equality and the Empowerment of Women, United Nations Environment Programme, United Nations Human Settlements Programme, United Nations Industrial Development
Organization, United Nations Office on Drugs and Crime, World Bank Group, World Health Organization.
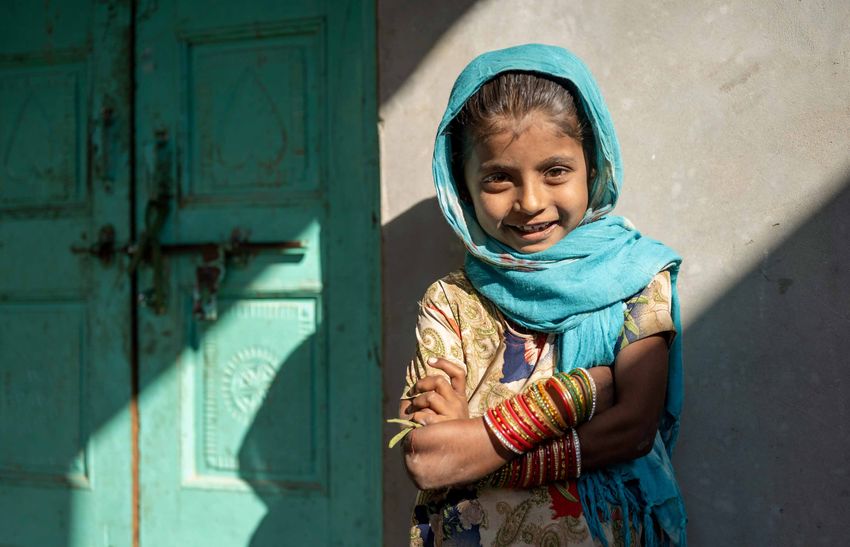
Photo on cover © UNICEF/Vinay Panjwani.
Compiled by the Statistics Division, Department of Economic and Social Affairs, United Nations.
6You can also read