MULTISPECTRAL CLEAR-SKY BRIGHTNESS TEMPERATURE OVER DESERT FOR AEROSOL RETRIEVAL
←
→
Page content transcription
If your browser does not render page correctly, please read the page content below
MULTISPECTRAL CLEAR-SKY BRIGHTNESS TEMPERATURE OVER
DESERT FOR AEROSOL RETRIEVAL
Bart De Paepe, Alessandro Ipe, Nicolas Clerbaux, Steven Dewitte
ROYAL METEOROLOGICAL INSTITUTE OF BELGIUM
abstract
The desert surface is characterized by periodical outbreaks of mineral dust storms. These dust aerosols
have an impact on the upwelling infra red radiance. The desert surface has a low emissivity in the 8.7
µm channel, compared to the 10.8 µm channel. This characteristic can be used to separate the TOA
brightness temperatures of clear-sky and aerosol events.
In order to do so, we have to take into account the surface contribution to the measured satellite sig-
nal. To separate this from the aerosol signal, we calculate the Top Of the Atmosphere (TOA) clear-sky
radiances (as brightness temperatures) of the 8.7µm, 10.8 µm and 12.0 µm channels. The clear-sky
brightness temperatures in those channels for a fixed time of the day are selected using a common
clear-sky criterion over the different days of a month. Different clear-sky criterions are tested, e.g. taking
the maximum 10.8 - 8.7 µm brightness temperature difference over the month. Empirical analyses of
the 8.7µm and 10.8 µm channels shows that the satellite measured radiance over desert decreases in
the presence of aerosols or clouds. The brightness temperature value of both channels is very sim-
ilar for aerosol pixels, whereas for clear-sky it differs significantly. The resulting clear-sky brightness
temperatures are valid during both night and day.
During day time we verify this method with the clear-sky detection by the RMIB-team in the context
of the GERB-processing. The RMIB GERB clear-sky detection only uses visible channels. We validate
the clear-sky brightness temperature values derived with the infrared method by comparison with the
brightness temperature values for the times identified as clear-sky by the RMIB GERB method.
The TOA clear-sky brightness temperature for desert will serve as reference image when calculating
the optical properties of aerosols. It will prove valuable for the implementation of a climatology of African
mineral dust, based on Meteosat-8 imagery.
1 INTRODUCTION
Aerosols are important for climate studies. They have an impact on the earth radiation budget, direct
when radiation interacts with a particle, but also indirect when aerosols interfere in cloud formation.
Desert aerosols in particular have a large influence on climate. Desert aerosols, dust aerosols, consist
of mineral dust particles of different size and shape. During dust storms over the desert, large amounts
of these particles are lifted up into the troposphere where they form increased aerosol concentrations
that are transported on relative low altitude. Similar events cause significant aerosol concentrations in
the troposphere that can be easily detected on satellite images. Another reason why desert aerosols are
particularly interesting is their regular occurrence. Mainly three to four times a year, a huge dust storm
breaks out over the desert, bringing large amounts of dust into the troposphere. If we want to calculate
the optical properties of these dust aerosols, we should take into account the surface contribution. The
signal measured at the satellite is composed both of the surface signal, and the radiance coming from
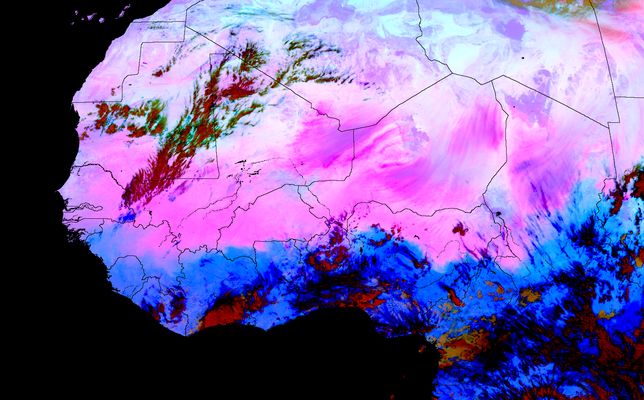
the atmosphere as well as from the aerosols.Figure 1: false color composite (IR12.0-IR10.8,IR10.8-IR8.7,IR10.8), 8 March 2006 12:00 UTC
The observed radiances by the satellite will not only change as a function of surface and atmo-
sphere. The radiance leaving the surface varies both on a daily and seasonal basis. The diurnal cycle
is charaterized by lower radiances during nighttime and higher radiances during daytime (Legrand et
al.[2]). The seasonal cycle has changing radiances according to the variations in sun-earth position.
Therefore radiances are not suited to estimate the surface contribution, and instead we should use the
surface emissivity. Surface emissivity depends on surface type, condition, and view angle. Therefore it
is less variable in time, and thus it is better suited as an estimation for the surface contribution. Once we
know the radiance coming from the surface, we can separate it from the observed radiance to obtain the
aerosol signal.
2 DATA
From 5 to 9 March 2006 there was a dust outbreak to the south of Algeria and over Niger. A cold air
mass coming from Europe was responsible for the dust storm that moved from West to East over the
Sahara. The dust aerosols were visible on the thermal infrared channels and we could follow its spatial
and temporal distribution over this time range. Figure 1 illustrates the dust storm over the Sahara.
For this study we used SEVIRI level 1.5 data. We selected the short wave bands at 0.6 µm and 0.8
µm, and the long wave channels at 3.9 µm, 8.7 µm, 10.8 µm, and 12.0 µm.
For the comparisons with the MODIS emissivity we used the Terra MOD11B1 and the Aqua MYD11B1
emissivity product. Band 31 was used for comparison with the SEVIRI 10.8 µm channel and band 32 for
the 12.0 µm channel. This MODIS data is online available at the EOS Data Gateway (http://delenn.gsfc-
.nasa.gov/ imswww/pub/imswelcome/index.html).
The processing of the GERB clear-sky image requires 2 months of SEVIRI data of the corresponding
time, preferable symmetric around the choosen date. Similar the clear-sky brightness temperature image
requires one month of SEVIRI data.Figure 2: 8.7 µm - 10.8 µm, 8 March 2006 12:00 UTC
3 METHOD
In order to estimate the surface contribution we calculate the top of atmosphere clear-sky images, that
are free from clouds and aerosols. Over desert we take advantage of a desert surface characteristic
to obtain these clear-sky images. The desert surface is characterized by low emissivity in the 8.7 µm
channel. This results in significant lower radiances compared to the 10.8 µm channel over clear-sky
regions. In the presence of aerosols or clouds on the other hand, the emissivities at 8.7 µm and 10.8 µm
are much more similar. We use this characteristic to calculate the clear-sky radiances for a certain place
and time. We take one month of long wave data for the channels 8.7 µm and 10.8 µm and calculate
the difference of the radiance (as brightness temperature) between 10.8 and 8.7 for each day. This is
repeated for all days over one month. Figure 2 shows the difference between 8.7 and 10.8, here clear-
sky correspond with the darkest regions which have a difference value lower than -10 and appear as
black on the image. For these pixels the radiance at 8.7 µm is at its minimum and the radiance at 10.8
µm is at its maximum. The maximum difference, corresponding to the minimum 8.7 radiance and the
maximum 10.8 radiance, is the best estimation for a clear-sky event. We take then the corresponding
radiance for each channel as the clear-sky value for that channel.
We use the GERB clear-sky reflectances to validate our clear-sky radiances. The GERB clear-sky
product gives clear-sky reflectances in the 0.6 µm, and the 0.8 µm channel. It uses a threshold technique
over two months of data to estimate the clear-sky reflectances (Ipe et al. [1]). We plot the observed
reflectances against the clear-sky reflectances for the same place and time over a one week range. If
the observed reflectances coincide with the clear-sky reflectances on a particular day, than we assume
that this day is a good clear-sky estimation. Then we expect that the estimated clear-sky radiances will
be close to the observed radiances. If this is the case, then we have proven that our clear-sky retieval is
consistent with the GERB clear-sky reflectances.
Since surface temperature varies significantly both diurnal and seasonal, we calculate surface emis-
sivity instead as surface contribution. Surface emissivity varies with wavelength, soil type and moisture
content, and vegetation type and condition as well as viewing angles. Because of these dependencies,
the spectral variations of the surface emissivity are important for remote sensing of aerosols and re-
trievals of their properties. Surface emissivity is calculated by solving a set of equations to obtain thesurface skin temperature, that is required to calculate the surface emissivity (Minnis et al.[3]). We need
observations from both daytime and nighttime over the same area in the channel 3.9 µm and 10.8 µm.
First we need to estimate the apparent surface temperature in both channels. The relationship between
the TOA and surface radiances can be represented as in equation (1).
Bi (Ti ) = ai Bi (Tai ) + (1 − ai )Bi (Tsi ) (1)
Here B is the Planck function, a and Ta are the atmospheric effective emissivity and effective tem-
perature respectively. The radiance for Tsi , the apparent skin radiating temperature for channel i, is
determined by adjusting the radiance for atmospheric absorption and emission. This is done by means
of the Santa Barbara DISORT Atmospheric Radiative Transfer (SBDART) model to take into account
atmospheric absorption using atmospheric profiles of temperature, relative humidity and ozone taken
from the European Centre for Medium-Range Weather Forecasts (ECMWF). We selected a dataset
consisting of pixels equally spread every two degrees over the Sahara to calculate the apparent surface
temperature in the same way as we just described. For the remaining pixels we obtained the apparent
surface temperature by means of a parameterization of total precipitable water (ECMWF) against the
difference of radiance between the surface and the top of atmosphere. At night both T3.9 and T10.8 can
be derived using (1) and the emissivity ratio 3.90 can be computed. We assume that the ratio is constant
for a given location during both day and night, what allows to retrieve 3.9 from daytime data. During day,
the apparent channel-3.9 surface temperature is given by equation (2).
B3.9 (Ts3.9 ) = 3.9 [B3.9 (Tskin )] + α3.9 [χS3.90 + La3.9 ] (2)
Here the value of χ is assumed to be constant over desert, α is the surface albedo and S3.9 , the
solar radiation reaching the surface is computed by SBDART as well. According to Kirchoff’s law we get
3.9 = (1 − α3.9 ) and after substitution for the emitted component and the albedo and rearranging gives
equation (3).
{B3.9 (Ts3.9 ) − 3.90 [B3.9 (Ts10.8 )] − (1 − 3.90 )La3.9 }
3.9 = 1 − (3)
χS3.90
Using this equation 3.9 is derived, Tskin can now easily be solved using equation (4).
Tskin = Bi−1 [{Bi (Tsi ) − Lai }/i + Lai ] (4)
If we know Tskin we can compute the emissivity for the remaining channels using equation (5).
[Bi (Ti ) − Lai ]
i = (5)
[Bi (Tskin ) − Lai ]
4 RESULTS
We estimated the top of atmosphere clear-sky radiances for the thermal channels at 8.7 µm, 10.8 µm,
and 12.0 µm for 8 March 2006. The method works both during daytime as well as during nighttime.
During day aerosols cause a decrease of the radiance outgoing to space while during night aerosols
are responsible for an increase of this radiance. A desert pixel without significant aerosols and without
clouds has a higher radiance at 10.8 µm compared to 8.7 µm. In the presence of aerosols this difference
disappears, and both radiances are much more similar. For clouds we even observe the inverse situation,
with higher radiances for the 8.7 µm. For all channels the clear-sky radiances are higher during day and
lower during night. Figure 3 illustrates the clear-sky brightness temperatures for channel 8.7 and channel
10.8 during day and night.
We retrieve surface emissivity over desert in the 8.7 µm, 10.8 µm, and 12.0 µm for 8 March 2006.
The 8.7 µm emissivity is significantly lower compared to the others. Figure 4 illustrates the surface
emissivity for channel 8.7, channel 10.8, and channel 12.0.
5 VALIDATION
The Terra/MODIS and Aqua/MODIS surface emissivity products, MOD11B1 and MYD11B1 respectively,
are used to compare with our emissivity estimation. The MODIS Band 31 is compared with the 10.8 µmFigure 3: clear-sky brightness temperatures : (a) 8.7 µm 8 March 2006 12:00 UTC, (b) 10.8 µm 8 March 2006 12:00 UTC, (c) 8.7 µm 9 March 2006 00:00 UTC, (d) 10.8 µm 9 March 2006 00:00 UTC Figure 4: surface emissivity 8 March 2006 12:00 UTC : (a) 8.7 µm, (b) 10.8 µm, (c) 12.0 µm
channel and Band 32 with the 12.0 µm channel. We selected the data of 8 March 2006 at 12:00 UTC for
validation. The Terra overpass over the Sahara that lies closest to this time was at 10:25 UTC, and the
Aqua overpass was at 13:30 UTC. We selected a match-up pixel dataset for both satellites that could
be used for statistical analysis. Figure 5 shows the difference statistics we obtained for the match-up
datasets. The graphs are histograms of the difference between MODIS and our emissivity. For all cases
we observe that the MODIS emissivities are higher. The Terra Band 31 comparison shows a mean
difference of 0.047, the Terra Band 32 has a mean difference of 0.043. The differences with Aqua are
0.065 and 0.068 for Band 31 and Band 32 respectively.

Figure 5: emissivity difference statistics 8 March 2006 : (a) MOD11B1 band31-IR10.8, (b)
MOD11B1 band32-IR12.0, (c) MYD11B1 band31-IR10.8, (d) MYD11B1 band31-IR12.0

    These differences can be explained by the parameterization we used, and in which we didn’t take
into account the total ozone concentration, neither the viewing angle. Secondly we assumed that the
anisotropic correction factor over desert is constant.

6    CONCLUSION

An accurate estimation of the surface emissivity is required to retrieve aerosol properties. Good knowl-
edge of the geographical, temporal, and angular variabilities of emissivity is needed to separate the
aerosol signal from the surface contribution over land. We presented a straightforward method to obtain
surface emissivity over desert for SEVIRI in the three thermal channels. The desert surface is charac-
terized by a low emissivity in the 8.7 µm channel. This results in low radiance at this wavelength for
clear-sky events. The clear-sky radiance in the 10.8 µm channel is significantly higher. In the presence
of clouds or aerosols the radiance in both channels is similar. This is valid during day as well as during
night, although for the latter the difference is smaller. We calculate clear-sky radiances for a given place
and time using this characteristic. The method requires a large amount of satellite input data to calculate
the clear-sky images. Additional atmospheric data is needed to calculate the radiances near the surface.
Surface radiance (as brightness temperature) varies on diurnal and seasonal basis. These variations
make radiances unsuitable as reference image. Therefore we calculate the surface emissivity. Surface
emissivity depends on surface type, condition, and view angle. It is less variable in time and place.
Minnis et al.[3] presented a method to estimate the surface emissivity based on satellite observations
in the 3.9 µm channel and the 10.8 µm channel during both day and night. The method retrieves the
surface skin temperature using observations in both channels. Once we know the skin temperature we
can calculate the surface emissivity for the remaining channels using the Planck-function.
In order to obtain the surface emissivity we used the clear-sky images as reference image. Using
the same method we can calculate the aerosol emissivity. Therefore we replace the reference images
by cloud-screened real-time observations. The emissivity we obtain will be a function of the surface and
the aerosols. Since we know the surface emissivity this will allow us to quantify the aerosol signal. The
main advantage of this method lies in the similar approach that is used to retrieve the emissivities. The
differences we measure can only be a result of the aerosol loading.
References
[1] Ipe, A., Bertrand, C., Clerbaux, N., Dewitte, S., and Gonzalez, L. (2003). Pixel-scale composite top-
of-the-atmosphere clear-sky reflectances for Meteosat-7 visible data. Journal Geophysical Research,
(108(D19)):40612, doi:10.1029/2002JD002771.
[2] Legrand, M., Plana-Fattori, A., and N’doumé, C. (2001). Satellite detection of dust using the IR im-
agery of Meteosat 1.Infrared Difference Dust Index. Journal Geophysical Research, (106):pp 18251–
18274.
[3] Minnis, P. and Young, D. F. (2002). Surface and clear-sky albedos and emissivities from MODIS and
VIRS with application to SEVIRI. In EUMETSAT Proceedings, number 36, pages pp 600–607.You can also read