Use of Acceleration Sensors in Archery - MDPI
←
→
Page content transcription
If your browser does not render page correctly, please read the page content below
Proceedings

Use of Acceleration Sensors in Archery †
Markus Eckelt 1,*, Franziska Mally 1 and Angelika Brunner 2
 1 Department Life Science Engineering, University of Applied Sciences Technikum Wien, 1200 Vienna,
   Austria; mally@technikum-wien.at
 2 Archery Austria, 5071 Wals Siezenheim, Austria; co-bt-scheibe@oebsv.com

 * Correspondence: eckelt@technikum-wien.at; Tel.: +43-1-3334077-6240
 † Presented at the 13th conference of the International Sports Engineering Association, Online,

   22–26 June 2020.

 Published: 15 June 2020

 Abstract: Archery is a quasi-static sport. Nevertheless, it requires maximum concentration, as well
 as precision from the archer. Previous research used combinations of several sensors, video
 analysis and electromyography to analyse the motion sequence and to identify parameters leading
 to a worse score. Therefore, the aim of this study is to verify if solely an acceleration sensor on the
 archer’s hand, without complex data processing, could be used to set up a feedback system. For
 testing, six participants with a three dimensional acceleration sensor on each hand shot indoors at a
 vertical triple target. The parameters analysed were the duration of the movement, the range of
 motion and the coefficient of variation. The results indicate that the analysis of the coefficient of
 variation shows no correlation with the score reached, whereas the analysis of the duration and the
 range of motion does.

 Keywords: archery; feedback system; acceleration sensor

1. Introduction
     Archery is a highly complex sport. Therefore, exact subdivisions of the individual movement
phases and precise descriptions of what should take place in which phase exist. After the bow has
been taken, the shooter steps to the shooting line and the first phase (stance) begins, in which one
should concentrate. After loading and nocking an arrow, the bow is lifted and the anchoring phase
starts. From this point on, the position of the fingers on the string, every movement of the arm, every
muscle activity and every breath can influence the trajectory of the arrow, and thus also the score [1–3].
As even the smallest factor can have a big impact, many studies have been carried out to analyse
various biomechanical parameters (e.g., movement, force, velocity, muscle activities) and, in the best
case, point out correlations between these parameters and the score reached [4–7].
     In addition to biomechanical studies, there have been attempts to use the data of sensors for
training and feedback systems to support the archer to reach a high score, or at least give feedback as
to why no high score could be reached. For example, in a study, a laser distance sensor to capture the
location of the target, a flex sensor to measure the drawback force and a smartphone to measure the
angle of the bow were used. Out of this data, the trajectory of the arrow was calculated, and the
archer got feedback via the smartphone, if the target was hit [8].
     To reduce the amount of sensors that have to be used for a feedback system, as well as the time
needed for data processing, the aim of this study was to find out if the unfiltered data of an
acceleration sensor on each of the archer’s hands could be used for a feedback system. Furthermore,
as a previous study found out that a human’s decision time is approximately 200 ms [9], another
research question for this study came up: is it possible to find correlations between the score and any
of the measured parameters (e.g., range of motion, standard deviation)?

Proceedings 2020, 49, 98; doi:10.3390/proceedings2020049098               www.mdpi.com/journal/proceedings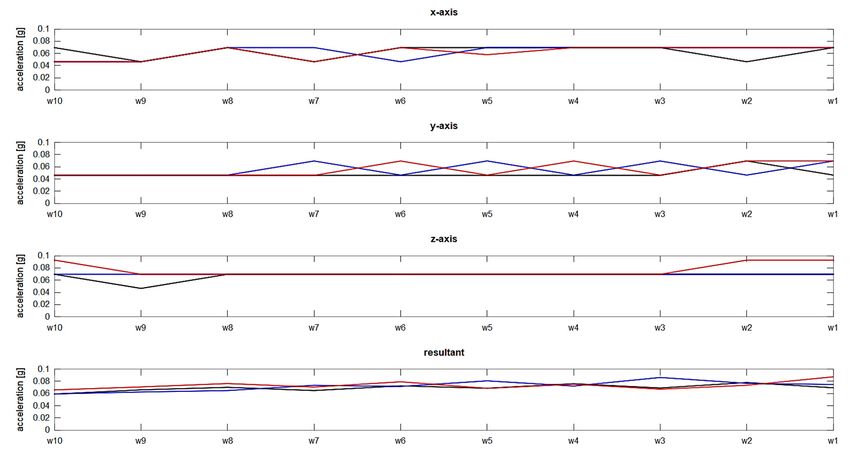
Proceedings 2020, 49, 98 2 of 6
2. Materials and Methods
2.1. Sensor
For this study, a three-dimensional acceleration sensor (MMA7341LC, Freescale Semiconductor
Inc., Austin, TX, USA) with a measurement range of +/−3 g was attached to each hand of the
participants using medical double-sided adhesive tape. In addition, the sensor was further fixed
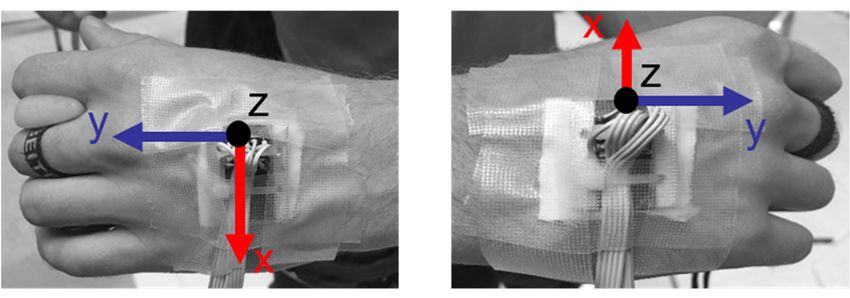
with tape on top. The sensor was positioned so that the origin of the sensor was at the level of the
phalanx proximalis of the digitus manus III and the y-axis pointed in the direction of the digitus
manus III (Figure 1). Data of all axes was digitized using the data acquisition card NI USB-6008
(input range: +/−10 VDC; single-ended; National Instruments Corporation, Austin, TX, USA) at a
sampling frequency of 1000 Hz, and stored with a LabVIEW routine (National Instruments
Corporation).
Figure 1. Position of the sensor on the hands of one subject. The origin of the sensor was always at
the level of the phalanx proximalis of the digitus manus III.
2.2. Experimental Setup
All measurements were carried out on two days at the Vienna Indoor Archery Center (VIAC,
Vienna, Austria). Six archers (4 male, 2 female) with different skill levels (Table 1) participated
voluntarily in this study, based on given oral consent, and no further ethical approval was
requested. As two archers were available on both days, tests were carried out twice with those two.
Table 1. Overview about the participants of this study.
Number Gender Bow Arm Skill Level Measurement Days
P1 M Right Amateur 2
P2 M Left Elite 2
P3 M Left Amateur 1
P4 W Left Recreational 1
P5 W Right Amateur 1
P6 M Right Elite 1
All shots were carried out on two FITA 3-spot vertical target faces. Hits were classified in three
categories. Category 1 (C1) covers hits scored with ten points (gold middle and gold first ring),
category 2 (C2) covers hits scored with nine points (gold second ring) and category 3 (C3) covers all
other hits. Every archer shot four sets of six arrows per set. The distance between the target and the
shooting line was 18 m.
2.3. Data Treatment
As the unfiltered data should be used for the analysis, the data of the acceleration sensors were
not filtered, and also were not integrated to calculate velocity or displacement. The acceleration of
the y-axis was used to identify the beginning and the end of the movement. While nocking the bow,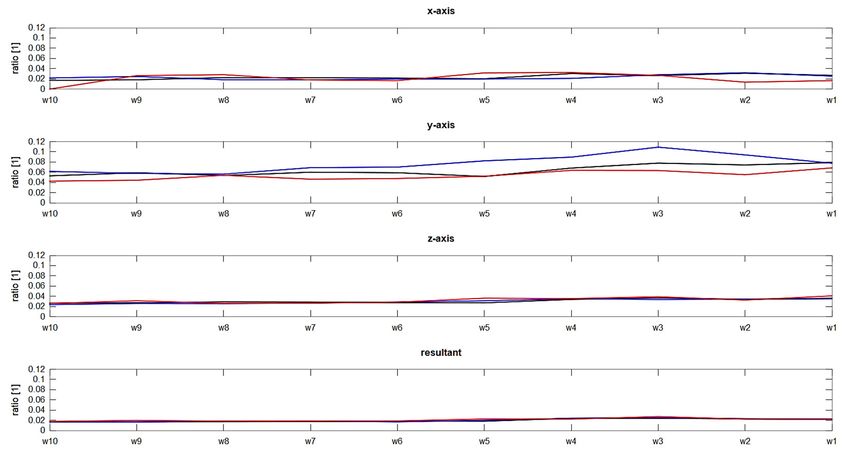
Proceedings 2020, 49, 98                                                                                         3 of 6

the arm points to the ground; thus, the acceleration in y-direction of its sensor is about +1 g. Next, the
bow is lifted and the acceleration in y-direction becomes lower. As the bow arm is lifted above the
horizontal, the acceleration in the y-direction crosses the baseline. This point in time was set as the
beginning of the movement. The end of the movement (EOM) was identified based on the signal
curve of the y-axis of the acceleration sensor on the drawing arm. The sudden movement of the
drawing arm at the beginning of the releasing phase [6] can also be seen in the unfiltered data of the
acceleration sensor. Therefore, the sudden increase of its signal in the y-direction indicates the
beginning of the releasing phase, and was set as the EOM. After identifying the beginning and the
end of the movement, the duration for the whole movement was calculated.
     Furthermore, the range of motion (ROM) and the coefficient of variation (CV) were calculated
for every axis, as well the resultant accelerations of both hands. The ROM was defined as the
difference between the maximum and minimum acceleration, whereas the CV was calculated as the
ratio of the standard deviation to the mean [4]. These calculations were carried out for multiple
windows (Table 2), with a window size of 20 ms for the last 200 ms before the EOM. Thus, ROM and
CV were calculated 10 times for each axis, as well as for the resultant acceleration.

                                               Table 2. Window expression.
   Period of time before
                           200–180   180–160     160–140   140–120   120–100   100–80   80–60   60–40   40–20   20–0
        EOM [ms]
     Window number          w10        w9          w8        w7        w6       w5       w4      w3      w2     w1

      All results were grouped according to the achieved category.

3. Results

3.1. Duration
     The calculated median duration for the movement (Figure 2) is lowest for C1 shots. However,
the shots leading to the worst category (C3) do not show the highest median duration, which was
observed for C2 shots.

      Figure 2. Duration of the movement for the three categories (C1, C2 and C3). The figure shows the
      calculated minimum, 1st quartile, median (red line), 3rd quartile and maximum for every category.

3.2. Range of Motion
     The median values of the ROM for the acceleration sensor of the bow arm (Figure 3) do not
show big differences between the three categories. Only for the x-axis can a decrease in the last 20 ms
(w1) be observed. The median values of the ROM for the acceleration sensor of the string arm
(Figure 4) are higher than those of the bow arm and, with the exception of the z-axis, the changes of
the median value from one window to the next are bigger.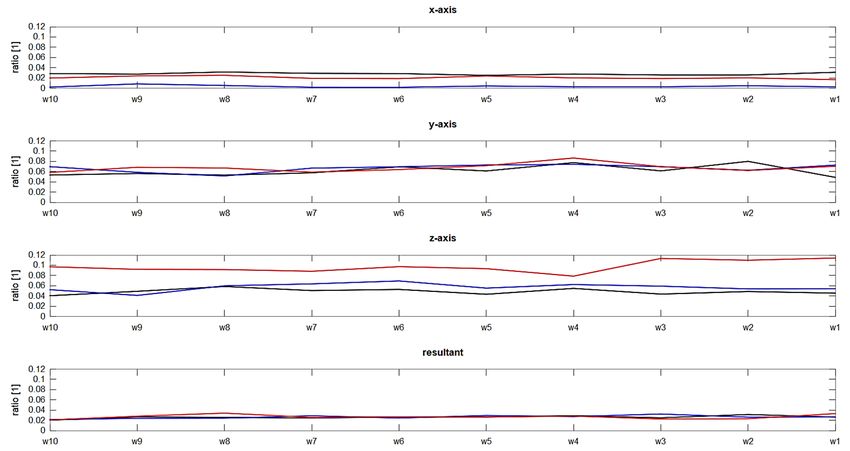
Proceedings 2020, 49, 98                                                                                     4 of 6

      Figure 3. Median values of the ROM for the three axes and the resultant acceleration of the bow arm.
      Every graph contains the values for C1 (black), C2 (blue) and C3 (red).

      Figure 4. Median values of the ROM for the three axes and the resultant acceleration of the string
      arm. Every graph contains the values for C1 (black), C2 (blue) and C3 (red).

3.3. Coefficiant of Variation
     Figure 5 shows the calculated median values of the CV for the bow arm. It can be seen that, with
exception of the y-axis, the change of the median value from one window to the next is very small.
For the x-axis and the y-axis, the lowest ratio was observed for C3 shots. With the exception of the
resultant acceleration, the calculated mean values of the CV for the string arm (Figure 6) shows
differences between the three categories. The lowest ratio just before the beginning of the release
phase (w1) was observed for C1 shots at the y-axis and the z-axis, whereas C2 shots led to the lowest
ratio for the x-axis.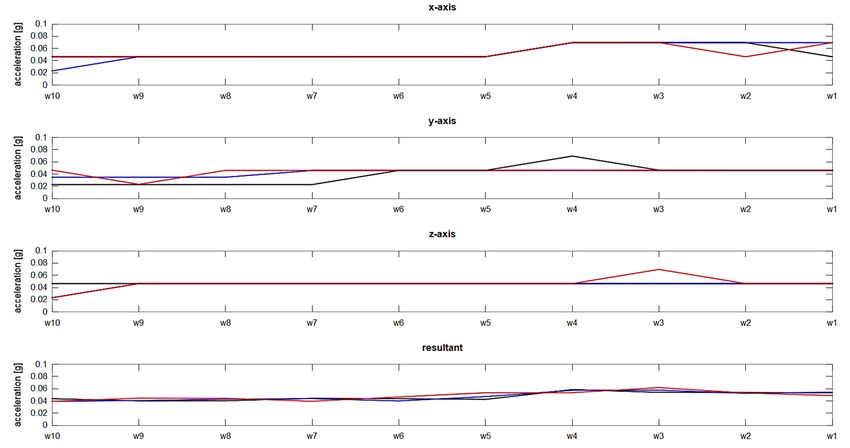
Proceedings 2020, 49, 98                                                                                       5 of 6

      Figure 5. Median values of the CV for the three axes and the resultant acceleration of the bow arm.
      Every graph contains the values for C1 (black), C2 (blue) and C3 (red).

      Figure 6. Median values of the CV for the three axes and the resultant acceleration of the string arm.
      Every graph contains the values for C1 (black), C2 (blue) and C3 (red).

4. Discussion
     As no statistical evaluation was carried out, the results can only be used to point out possible
trends.
     Nevertheless, based on the results of this study, it can be assumed that the lowest duration
leads to the best category shot and therefore to the highest score. This finding is also confirmed by
the results of a previous study [6]. However, the calculated durations of this study are higher than
the ones in the previous study [6], and the supposition that the longest duration would lead to the
worst category (score) cannot be confirmed. A reason for this could be the chosen beginning of the
movement, which is before the beginning of the aiming phase.
     With regard to the category achieved, it can be said that the calculations of the CV for all axes,
and the resultant acceleration and the ROM for the resultant acceleration, do not seem to be the
appropriate methods. It seems that, if the ROM of the axes is lowest during the 200 ms, the shot will
lead to a high category. However, as the ROM for all axes at the time of decision (w10) was not the
lowest for C1 shots, it is not clear if solely acceleration sensors can be enough to be used in a
Proceedings 2020, 49, 98 6 of 6
feedback system. Furthermore, the size of the window has to be discussed: is 20 ms too long or too
short? To evaluate whether solely acceleration sensors can be used for a feedback system, further
analysis should be carried out with smaller and bigger window sizes.
5. Conclusions
In this paper, two three-dimensional acceleration sensors were attached to the archer’s hands,
and unfiltered data was analysed to determine possible correlations to the score that was reached.
The results show that the calculation of the CV of all axes and the resultant acceleration do not seem
to be an appropriate method, whereas the calculation of the ROM of single axes seems to be.
Conflicts of Interest: The authors declare no conflict of interest. This study was conducted without external
sources of funding.
References
1. Haidn, O.; Weineck, J.; Haidn-Tschalova, V. Bogenschießen, 2., Überarbeitete und Erweiterte Auflage; Spitta
GmbH: Ballingen, Germany, 2010
2. Coaching Manual—Level 1. Available online: https://worldarchery.org/Coaching (accessed on 4 June
2019).
3. Coaching Manual—Level 2. Available online: https://worldarchery.org/Coaching (accessed on 4 June
2019).
4. Heller, M. Evaluation of arrow release in highly skilled archers using an acoustic measurement system.
Procedia Eng. 2012, 34, 532–537, doi:10.1016/j.proeng.2012.04.091
5. Ertan, H.; Soylu, A.R.; Korkusuz, F. Quantification the relationship between FITA scores and EMG skill
indexes in archery. J. Electromyogr. Kinesiol. 2005, 15, 222–227.
6. Taha, Z.; Mat-Jizat, J.A.; Omar, S.F.S.; Suwarganda, E. Correlation between archer’s hands movement
while shooting and its score. Procedia Eng. 2016, 147, 145–150, doi:10.1016/j.proeng.2016.06.204
7. Ganter, N.; Matyschiok, K.C.; Partie, M.; Tesch, B.; Edelmann-Nusser, J. Comparing three methods for
measuring the bow in the aiming phase of Olympic archery. Procedia Eng. 2010, 2, 3089–3094,
doi:10.1016/j.proeng.2010.04.116
8. Vervaeke, J.; Saldien, J.; Verstockt, S. ArcAid Interactive Archery Assistant. In Proceedings of the 2015 7th
International Conference on Intelligent Technologies for Interactive Entertainment (INTETAIN), Turin,
Italy, 10–12 June 2015; doi:10.4108/icst.intetain.2015.259385.
9. Trevena, J.A., Miller, J. Cortical Movement Preperation before and after a Conscious Decision to Move.
Conscious. Cogn. 2002, 11, 162–190, doi:10.1006/ccog.2002.0548.
© 2020 by the authors. Licensee MDPI, Basel, Switzerland. This article is an open access
article distributed under the terms and conditions of the Creative Commons
Attribution (CC BY) license (http://creativecommons.org/licenses/by/4.0/).You can also read