Future prospects for the measurement of direct photons at the LHC
←
→
Page content transcription
If your browser does not render page correctly, please read the page content below
Future prospects for the measurement of direct
photons at the LHC
David Joffe1 on behalf of the ATLAS and CMS Collaborations
1
    Southern Methodist University Department of Physics, 75275 Dallas, Texas, USA

DOI: will be assigned

        The energy scale of the LHC, as well as the large size of the ATLAS and CMS experiments,
        present new challenges for the detection of direct photons as well as new opportunities for
        physics observations. This talk will examine the direct photon energy and momentum
        measurement capabilities of the two general purpose experiments for both converted and
        unconverted photons, and the resulting prospects for diphoton physics channels such as
        H→ γγ.

    The Large Hadron Collider at CERN will provide an exciting new window into the physics
of high-energy direct photons. For the LHC running at design energy, direct photon production
(for photons with pT ≥ 20 GeV) is expected to have a cross-section of 100 nb, and for photon
pairs (both with pT ≥ 20 GeV) the expected cross-section is 15 nb. The diphoton channel
is also considered to be key for the discovery of a low-mass (120-140 GeV) Standard Model
Higgs boson, but the relatively low diphoton branching ratio (∼ 10−3 ) means that the effective
cross-section for H→ γγ at the LHC is of the order of 20 fb, 6 orders of magnitude below the
non-resonant direct diphoton cross-section. The ability to observe such a rare decay requires a
very good understanding of the detectors. The relatively narrow (MeV-scale) decay width of
the Standard Model Higgs boson in the low-mass range means that the measured width of any
Higgs boson signal will be dominated by the detector resolution; such a signal should be visible
as a small enhancement of the diphoton mass spectrum, requiring a detector resolution of order
σ(m)/m ∼ 1%, as well as a high level of rejection of jets and neutral pions. This note will
attempt to summarize the energy and momentum measurement capabilities of the two general
purpose experiments, and their ability to observe H→ γγ and other rare TeV-scale diphoton
decays such as those predicted in universal extra-dimension theories [1].

1       The ATLAS and CMS detectors at the LHC
The ATLAS and CMS detectors are located at the Large Hadron √     Collider (LHC) at CERN. For
proton-proton collisions, the LHC is designed to run with s=14 TeV, with a bunch crossing
frequency of 25 ns. The design luminosity for the LHC is 1033 cm−2 s−1 for low-luminosity initial
operation, and 1034 cm−2 s−1 for high-luminosity operation. These energies and luminosities
require a very large size and fine granularity for the detectors. Because of the unprecedented
amount of material in the tracking detectors, particular attention has to be paid to material
effects, particularly to photon conversions in the context of this paper. Further information

PHOTON09                                                                                              1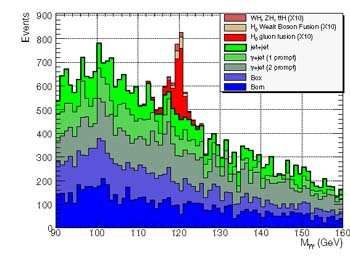
about the construction and expected performance of the general-purpose experiments can be
found in refs. [2] and [3] for ATLAS, and refs. [4], [5] and [6] for CMS.
The dimensions of the ATLAS detector are 25 m in height and 44 m in length, with a
2 Tesla solenoidal magnetic field in the inner volume, and an overall mass of the detector of
approximately 7000 tonnes. The CMS detector is more compact, but also more massive; it
measures 15 m in height and 21 m in length, with a 4 Tesla solenoidal magnetic field and
an overall mass of ∼12500 tonnes. The most crucial components of the detectors for direct
photon measurements are the electromagnetic (EM) calorimeters; ATLAS and CMS use very
different techniques in their calorimetry. The ATLAS EM calorimeter is a Liquid Argon (LAr)
sampling calorimeter with three sampling layers with the middle sampling layer consisting of
86,400 channels. The CMS EM calorimeter is composed of ∼80,000 lead tungstate (PbWO4 )
scintillating crystals. These two very different calorimeters each have their own strengths; the
ATLAS LAr calorimeter, with its multiple sampling layers, is able to reconstruct shower shapes
in all three dimensions, thereby providing excellent electron and photon identification, while
the CMS EM calorimeter has extremely accurate energy reconstruction.
Both the ATLAS and the CMS EM calorimeters are highly segmented. The front layer of
the ATLAS calorimeter is comprised of narrow strips with widths of 0.003 in η, and middle
and back layers with widths of 0.025 in φ. The CMS EM calorimeter has a granularity of
∆η × ∆φ = 0.0175 × 0.0175 in the barrel region. This fine segmentation is crucial for accurate
reconstruction of narrow diphoton resonances.
Both the ATLAS and CMS detectors contain multi-layered inner trackers which direct pho-
tons must cross before reaching the calorimeters. The material in these inner trackers is sub-
stantial; in the case of ATLAS, there is approximately 0.5 radiation lengths of inner-detector
material in the central region, and as much as 2 radiation lengths in the region around |η| =
1.7, and for CMS the numbers range from 0.4 radiation lengths in the central region to as much
as 1.5 radiation lengths around |η| = 1.7. As the probability for photons to convert to e+ e−
pairs is proportional to the number of radiation lengths traversed, this large amount of material
means that direct photons have a probability of ∼ 20% of converting in the central region, and
up to a maximum probability of ∼ 60% of converting at larger |η|. Figure 1 shows probabilities
of conversion for photons in the ATLAS detector as well as the positions of photons converted in
the ATLAS inner detector as simulated in GEANT4 [3]; the tracking layers are clearly visible.
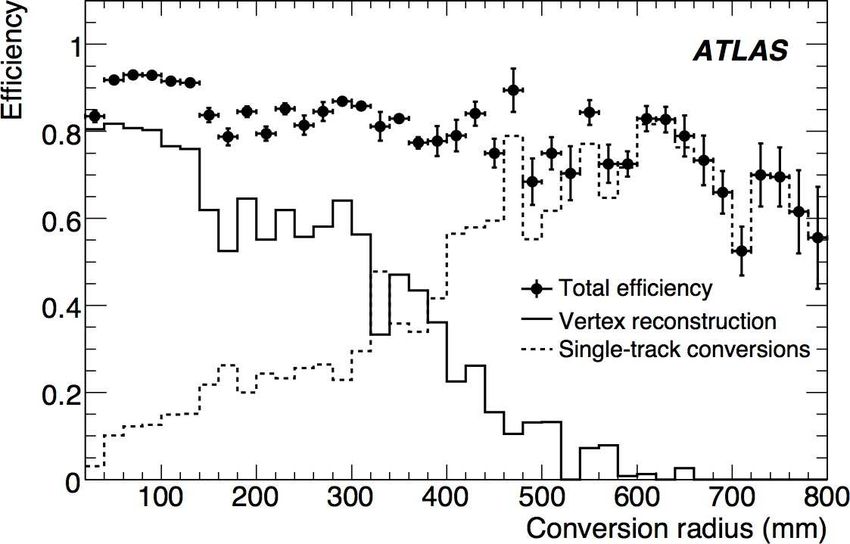
Efficiently reconstructing and identifying photon conversions while preserving the best pos-
sible EM calorimeter resolution is a challenging task. Figure 2 shows the efficiency of recon-
struction of photon conversions in the ATLAS detector as a function of conversion radius and η,
for photons from H→ γγ decay. In this figure, the points with error bars show the total recon-
struction efficiency, the solid histograms show the conversion vertex reconstruction efficiency,
and the dashed histograms show the single-track conversion reconstruction efficiency. Using
both tracks with silicon hits, as well as tracks from the Transition Radiation Tracker (TRT),
the total reconstruction efficiency ranges from ∼ 90% for photons converting within 15 cm of
the beam axis, to ∼ 60% for conversions occuring more than 70 cm from the beam axis; these
efficiencies are mostly independent of |η| over the geometrical acceptance of the TRT which
extends only to |η| ∼ 2.
Both ATLAS and CMS have extremely good energy resolution in their EM calorimeters. For
direct photons with energies of 100 GeV, the ATLAS LAr calorimeter has a resolution of better
than 1.4% at |η| = 1.075 [3], while the CMS EM calorimeter has a resolution of better than 0.7%
for 120 GeV electrons, after corrections [4]. Figure 3 shows the energy resolution for photons
in the ATLAS detector as a function of energy and η; Figure 4 shows the energy resolution
2 PHOTON09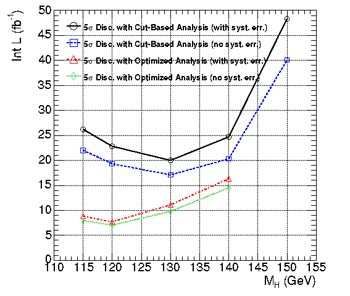
of the ATLAS detector for 100 GeV photons (normalised to the true energy) and the energy
resolution for unconverted barrel photon showers in CMS with R9 ≥ 0.943, reconstructed
in a 5 × 5 crystal array, as a function of energy, together with the fitted parametrization.
The equation for the energy√resolution in the barrel of the ATLAS LAr calorimeter can be
2
√ as2 σE /E ≈ 10%/ 2E + 0.7% 2[3], while for CMS the relation is given as (σ/E) =
expressed
(3.6%/ E) +(185(MeV)/E) +(0.66%) [4]. The different equations for the relative resolutions
reflect the very different properties of the two calorimeters.
To first order, the angular resolution for direct photons is determined by the granularity
of the calorimeters; Figure 5 shows the angular resolution for photons in the ATLAS detector;
the polar
√ angle resolution from calorimeter layers 1 and 2 for 100 GeV photons is σθ ∼ 50
mrad/ E. The angular resolution in ATLAS is improved for the case of converted photons due
to the high segmentation of the tracker, particularly in polar angle. For converted photons, the
polar angle can be determined to a resolution of 0.3 mrad for photons originating from H→ γγ
decays with mH = 120 GeV [3].
Due to the large hadronic backgrounds present at the LHC, rejections of the order of 103
or better are required to separate direct photons from jets and neutral pions; this rejection is
done primarily through the shower shapes. If isolation cuts are included, rejection rates of up
to 104 may be achieved [3].
Photons may be reconstructed with quite high efficiencies in the LHC detectors; for photons
from H→ γγ with pT ≥ 50 GeV simulated in the ATLAS detector, the efficiency ranges from
80-90% depending on the selection cuts. This efficiency is largely independent of |η|, with the
exception of the region between the barrel and end-cap of the LAr calorimeter around |η| = 1.5,
where it is somewhat reduced [3]. These high efficiencies can be extended up to the TeV energy
range; Figure 6 shows the photon reconstruction efficiency for high-pT photons from the decay
of gravitons with a mass of 500 GeV in the ATLAS detector [3].
2 Physics with diphoton resonances
The decay of the Standard Model Higgs boson into two photons is considered a key discovery
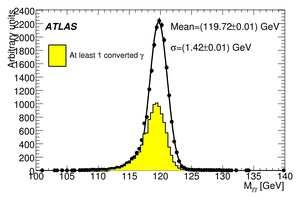
channel and has been extensively studied in simulation by both ATLAS and CMS. Given the
narrow Higgs boson width expected in the low-mass range (115-150 GeV), the shape of the
signal is dominated by the energy and angular resolution of the detectors; the observed width
of a Higgs boson with a mass of 120 GeV in the ATLAS detector is ∼1.4 GeV, with half of the
signal events having at least one converted photon.
Due to the large number of diphoton events coming from QCD direct photon production,
as well as the misidentification of jets and neutral pions as photons, the Standard Model Higgs
boson signal will be observable only on top of a large background; this background is on the
order of ∼100 times larger than the signal for the inclusive analyses. Thus, sizable statistics
will be required to observe any Higgs boson signal with significances of 3σ or more. For the
ATLAS standard cut-based combined analysis [3], 10 fb−1 of integrated luminosity allows for
an observed signal significance of between 3σ and 4σ, depending on the Higgs boson mass. For
the CMS optimized analysis [5], a 5σ signal may be observed with between 7 fb−1 and 15 fb−1
of data, depending on the Higgs boson mass.
The significance vs. luminosity plot for the H→ γγ signal in ATLAS, as well as an invariant
mass plot of the signal, are shown in Fig. 7. In the significance plot the solid circles correspond
to the sensitivity of the inclusive analysis using event counting. The solid triangles linked
PHOTON09 3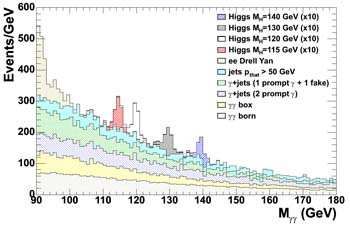
with solid and dashed lines correspond to the sensitivity of the inclusive analysis by means
of one dimensional fits, with a fixed and floating Higgs boson mass, respectively. The solid
squares linked with solid and dashed lines correspond to the maximum sensitivity that can be
attained with a combined analysis. The CMS invariant mass plots for various diphoton channels,
including the H→ γγ channel, can be seen in Fig. 8, showing the results of a categorized
kinematic neural net analysis on the left for all barrel events with a neural net output greater
than 0.85, and the cut-based analysis on the right. The neural net analysis is normalised to an
integrated luminosity of 7.7 fb−1 , and the cut-based analysis to 1 fb−1 ; the Higgs boson signal
in all CMS plots is scaled upwards by a factor 10 for visibility.
    As an example of the decay of a high-mass exotic resonance into two photons, both ATLAS
and CMS have studied the possibility of observing the diphoton decay of the TeV-scale gravi-
ton [1]. Plots showing the significance of discovery for various integrated luminosities in both
the H→ γγ channel and the G→ γγ channel for CMS can be seen in Fig. 9; the left part of the
G→ γγ discovery limit curve is the region where the significance exceeds 5σ. The limit is shown
as a function of the coupling parameter c and the graviton mass for integrated luminosities of
10, 30 and 60 fb−1 ; the signal is generally observable for graviton masses up to 2 TeV, and may
be observable for masses as high as 4 TeV depending on the strength of the coupling parameter.

References
[1] L. Randall and R. Sundrum, Phys. Rev. Lett. 83, 3370 (1999).
[2] ATLAS Collaboration (G. Aad et al.), JINST 3:S08003 (2008).
[3] ATLAS Collaboration, Expected Performance of the ATLAS Experiment, Detector, Trigger and Physics,
    CERN-OPEN-2008-020, Geneva (2008).
[4] CMS Collaboration, CMS Physics TDR: Volume I, Detector Performance and Software, CERN-LHCC-
    2006-001, Geneva (2006).
[5] CMS Collaboration, CMS Physics TDR: Volume II, Physics Performance, CERN-LHCC-2006-021, Geneva
    (2006).
[6] CMS Collaboration (S Chatrchyan et al.), JINST 3:S08004 (2008).
    Probability of conversion

                                                                                  Radius (mm)

                                0.6   η=0
                                                                                            1000
                                      η=1
                                0.5   η = 1.5
                                      η=2                                                       500
                                0.4

                                0.3                                                               0

                                0.2
                                                                                                -500

                                0.1
                                                                                       -1000
                                 0
                                  0   200       400   600   800    1000    1200                        -3000   -2000   -1000   0   1000   2000   3000
                                                                  Radius (mm)                                                                    z (mm)

Figure 1: Probability of a high-energy photon to convert as a function of radius for different
values of η in the ATLAS inner detector (left) and graphical representation of the ATLAS inner
detector material in the (z-R) plane as obtained from the true positions of simulated photon
conversions in minimum-bias events (right) [3].

4                                                                                                                                                PHOTON09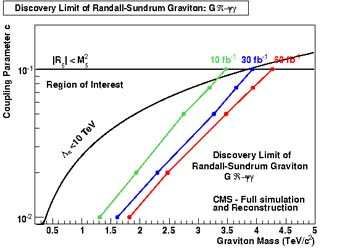
Efficiency
                                                                                                                            1                                                      ATLAS

                                                                                                                          0.8

                                                                                                                          0.6
                                                                                                                                          Total efficiency
                                                                                                                                          Vertex reconstruction
                                                                                                                          0.4             Single track conversions

                                                                                                                          0.2

                                                                                                                            0
                                                                                                                             0           0.5             1           1.5       2            2.5
                                                                                                                                                                                           |η|

Figure 2: Reconstruction efficiencies for converted photons from H→ γγ decays in the ATLAS
detector as a function of conversion radius (left) and pseudorapidity (right) [3].

                       0.05                                                                                           0.08
 Relative resolution

                                                                                                              true
                                                                                                                                                                                20 GeV

                                                                                                        -Etrue)/E
               0.045                                    |η| = 0.3                     ATLAS                           0.07       ATLAS                                          50 GeV
                                                                                                                                                                                75 GeV

                                                                                                              rec
                       0.04                             |η| = 1.1                                                                                                              100 GeV

                                                                                                       σ(E
                                                                                                                      0.06
               0.035                                                                                                                                                           200 GeV
                                                        |η| = 2.0                                                     0.05
                       0.03
               0.025                                                                                                  0.04
                       0.02                                                                                           0.03
               0.015
                                                                                                                      0.02
                           0.01
               0.005                                                                                                      0.01

                             0                                                                                              0
                              0      20     40     60   80      100 120 140 160 180 200                                      0       0.5             1          1.5        2         2.5
                                                                               Energy (GeV)                                                                                                η

Figure 3: Energy resolution for all photons in ATLAS (left) and energy resolutions for photons
in ATLAS (5×5 clusters) (right). [3]
         Arbitrary units

                           140
                                    ATLAS
                                                                           σ = (1.37 ± 0.05)%
                           120

                           100

                            80

                            60

                            40

                            20

                              0
                             -0.2    -0.15       -0.1   -0.05       -0   0.05   0.1      0.15  0.2
                                                                                      (E-E )/E
                                                                                         true   true

Figure 4: Difference between measured and true energy at E = 100 GeV for ATLAS photons
with |η| = 1.075 (left) [3] and CMS barrel photon energy resolution (right) [4].

PHOTON09                                                                                                                                                                                          5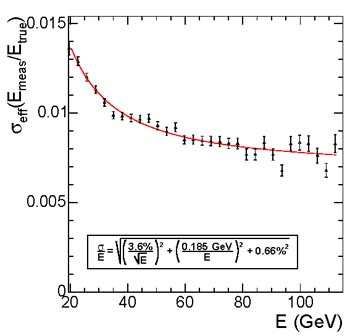
1                                                                                             2.5

             σ(η)×1000

                                                                                                               σ(φ )×1000
                         0.9                    All clusters
                         0.8                                                                                                     2      e
                                                  z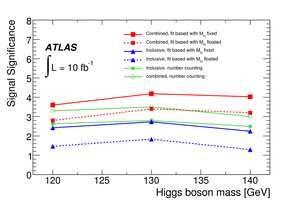
Figure 8: CMS diphoton mass distribution for H→ γγ signal and background after the appli-
cation of a kinematic neural-net analysis (left), and a cut-based analysis (right) [5].

Figure 9: Integrated luminosity needed for a 5σ discovery in CMS for the H→ γγ channel (left)
and the reach of the CMS experiment in the search for a heavy graviton decaying into the
diphoton channel (right) [5].

PHOTON09                                                                                   7
You can also read