Net-Zero America February 23, 2021 - Clean Energy States Alliance (CESA)
←
→
Page content transcription
If your browser does not render page correctly, please read the page content below
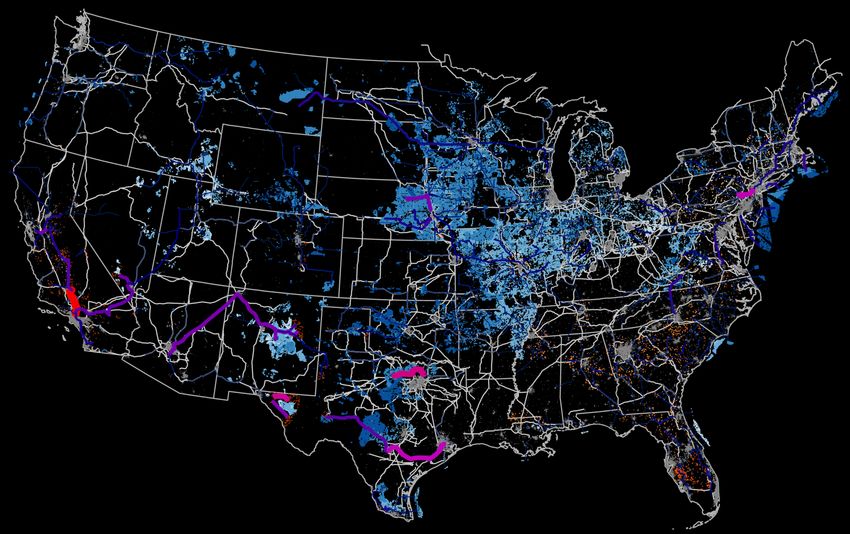
Net-Zero America February 23, 2021
Webinar Logistics
        Join audio:
        • Choose Mic & Speakers to use VoIP
        • Choose Telephone and dial using the
           information provided

        Use the orange arrow to open and close
        your control panel

        Submit questions and comments via the
        Questions panel

        This webinar is being recorded. We will
        email you a webinar recording within 48
        hours. This webinar will be posted on
        CESA’s website at www.cesa.org/webinars
www.cesa.org
Webinar Speakers
• Eric Larson, Senior Research Engineer, Andlinger Center for Energy and the
  Environment, Princeton University
• Jesse Jenkins, Assistant Professor, Mechanical and Aerospace Engineering
  Department and Andlinger Center for Energy and the Environment,
  Princeton University
• Warren Leon, Executive Director, Clean Energy States Alliance (moderator)
Clean Energy States Alliance webinar
                                                                        23 February 2021

    E. Larson, C. Greig, J. Jenkins, E. Mayfield, A. Pascale, C. Zhang, J. Drossman, R. Williams, S. Pacala, R. Socolow, EJ Baik, R. Birdsey, R. Duke, R. Jones, B. Haley, E. Leslie,
    K. Paustian, and A. Swan, Net-Zero America: Potential Pathways, Infrastructure, and Impacts, interim report, Princeton University, Princeton, NJ, December 15, 2020.
    Full report available for download at https://environmenthalfcentury.princeton.edu/.

1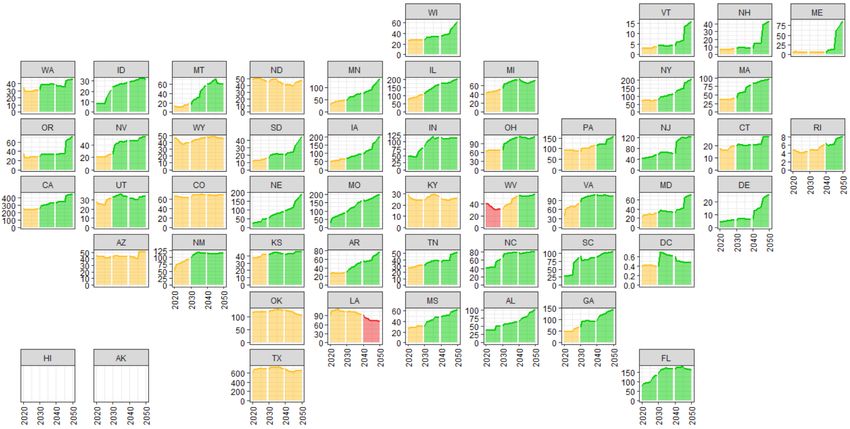
FIVE MODELED LEAST-COST PATHS TO NET-ZERO IN 2050 SHOW
                     IMPLICATIONS OF DIFFERENT APPROACHES
                                            2020         2050                                   Net-Zero America pathways, 2050
                                                          REF                    E+                     E-                 E- B+                 E+ RE-                 E+ RE+
                                                       No new policies   High electrification        Less high       Less electrification,   High electrification, High electrification,
                                                      (EIA, AEO 2019)     (vehicles & bldgs)       electrification      high biomass           constrained RE        all RE by 2050

                                            uranium
    Primary Energy Supply, EJ (HHV basis)

                                            coal

                                             gas
                                                                                                                                                                               wind
                                                                          76%                    64%                  67%                    56%                   100%
                                                                          less
                                                                         oil &
                                                                           gas
                                                                         than
                                             oil                         2020                                                                                                   sun

                                                                                                0.9 to 1.7 GtCO2/y sequestered in 2050                                           bio        0.7 GtCO2/y
2                                                                                                          in these 4 scenarios                                                            captured/used
BIG, BUT AFFORDABLE, TRANSITION: SHARE OF GDP SPENT ON
    ENERGY IS BELOW HISTORICAL LEVELS
                                                      Oil price shocks                                                    E+ RE+
                                                                                                                          E-
                                                                                                                          E- B+
                                                                                                                          E+
       Energy System Cost (% of GDP)

                                                                                  Global financial crisis                 E+ RE-
                                                                                                                          REF

                                                                                                                                   E+ RE+
                                                                                                                                   E-
                                                              Energy System Cost                                                   E- B+
                                                                 (% of GDP)                                                        E+
                                                                                                                                   E+ RE-
                                       Notes
                                                                                                                                   REF
                                       • Significant reduction in exposure to oil price shocks in net-zero scenarios.
                                       • All modeled cases, including REF, assume low oil & gas prices. Because demand
                                         for oil and gas is higher in REF, it is plausible that oil and gas prices would also
                                         be higher. In that case, net-zero pathways may cost less than REF.

3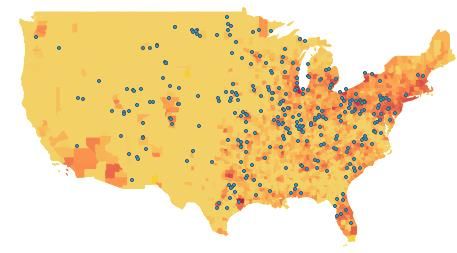
ALL PATHS EMPLOY SIX KEY PILLARS OF DECARBONIZATION

    1   End-use energy efficiency and electrification

    2   Clean electricity: wind & solar generation, transmission, firm power

    3   Bioenergy and other zero-carbon fuels and feedstocks

    4   CO2 capture, utilization, and storage

    5   Reduced non-CO2 emissions

    6   Enhanced land sinks

4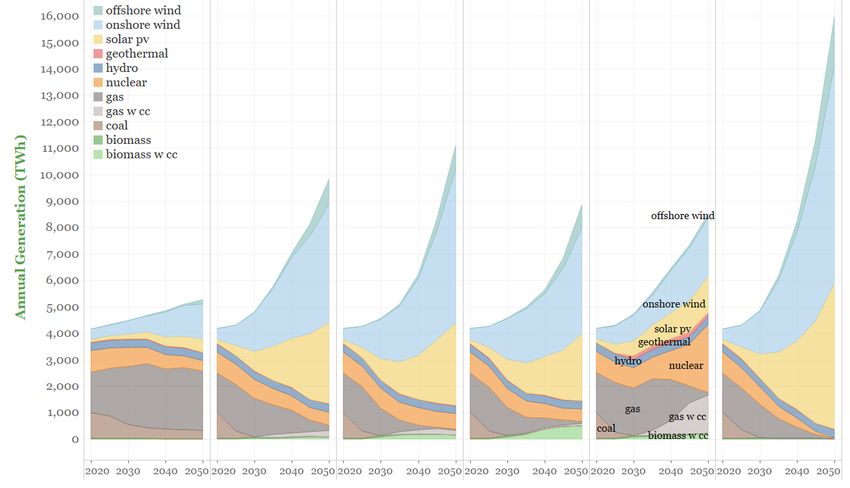
CHALLENGES RELATIVE TO BUSINESS-AS-USUAL IN EXECUTING THE
    TRANSITION VARY ACROSS NET-ZERO PATHWAYS
    ordinal ranking
    100 = most challenging                                                                          E+
                                                  Electrification
      0 = least challenging                         100                                             E-
                                                     90
                                                                          Solar/wind                E-B+
                           CO2 pipelines             80
                                                                           capacity
                                                     70                                             E+RE-
                                                     60
                                                                                                    E+RE+
                                                     50
                                                     40
                                                     30
                                                     20                              High-voltage
                     CO2 storage
                                                     10                              transmission
                                                      0

                           Nuclear                                                   Labor
                           capacity                                                mobilization

                                      Bioenergy                       Capital
                                       industry                     mobilization

5
SOLAR AND WIND ARE CORNERSTONES FOR EACH PATH
REF E+ E- E- B+ E+ RE- E+ RE+
No new policies High electrification Less high Less electrification, High electrification, High electrification,
(EIA, AEO 2019) (vehicles & bldgs) electrification high biomass constrained RE all RE by 2050
• In 2030, solar + wind generation is similar in 4 of 5 scenarios, supplying ~50% of US electricity
• Requires ~550-600 GW of new solar + wind capacity installed by 2030
• New wind + solar installed at 55-60 GW/year on average (vs ~35 GW peak rate in 2020)
2,228 2,312 2,342 1,574 2,542
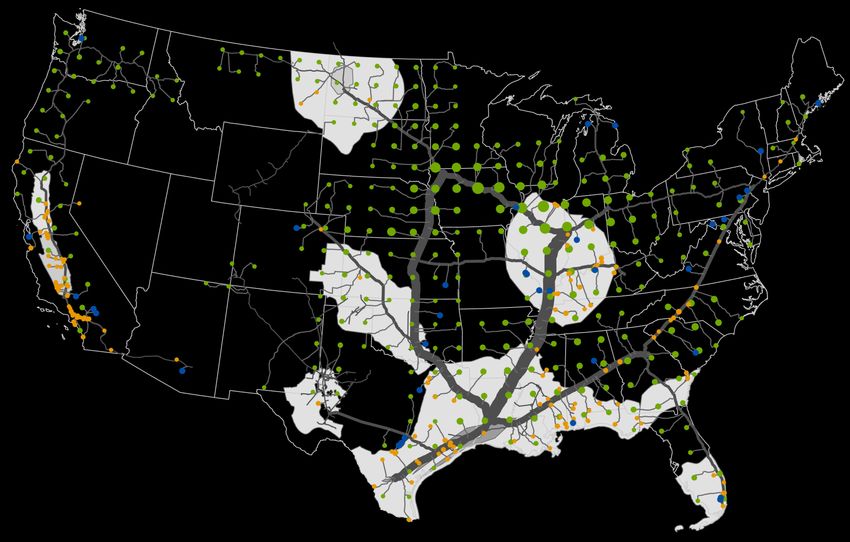
6EXTENSIVE SOLAR, WIND & TRANSMISSION BUILD ACROSS U.S.
As of end of 2020
(modeled year) 2020
Wind Solar
Capacity installed (TW)
0.15 0.07
Land used (1000 km2)
Total 58 1.08
Direct 0.6 0.97
Transmission capacity
GW-km 320,000
Transmission Capacity (GW)
7 Note: Transmission expansion is visualized along existing rights of way (>160 kV); paths are indicative not definitive.EXTENSIVE SOLAR, WIND & TRANSMISSION BUILD ACROSS U.S.
2020 - 2050
(cumulative) 2050 E+
Wind Solar
Capacity installed (TW)
1.48 1.45
Land used (1000 km2)
Total 550 38.3
Direct 5.5 34.5
Capital invested (2018$)
Trillion $ 1.84 1.39
Transmission capacity
1,012,000
GW-km
(3.2x 2020)
Transmission Capacity (GW)
8 Note: Transmission expansion is visualized along existing rights of way (>160 kV); paths are indicative not definitive.CLEAN FIRM CAPACITY IS KEY; H 2 TURBINES PLAY BIG ROLE
Note:
To reduce the carbon
intensity of CCGT and CT
generation, H2 is blended
as an increasing fraction
Installed capacity (GW)
of fuel to these units, up to
an exogenously specified
Firm cap of 60% (HHV basis).
resources In sensitivities with
100% H2 firing allowed,
the model prefers 100%
blend which modestly
reduces total energy
system costs.
Firm capacity
(across all years)
~500-1000 GW
RETURN TO
TABLE OF
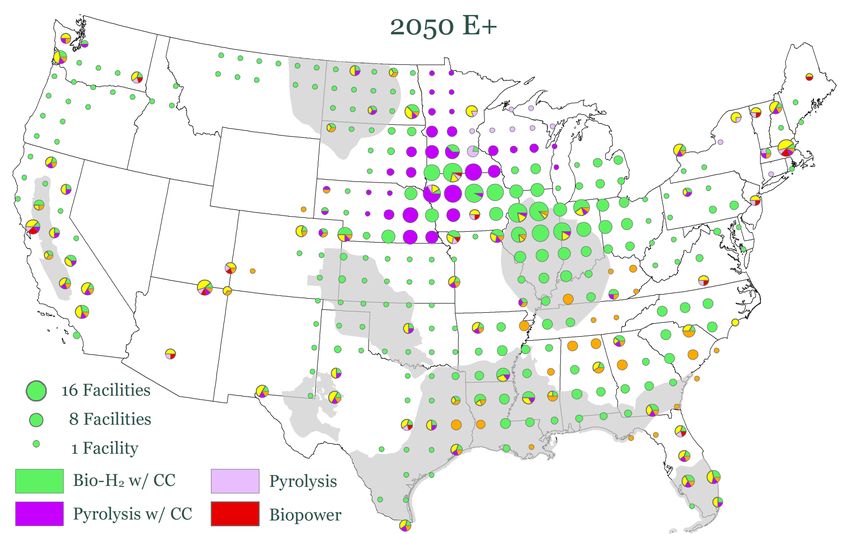
9 CONTENTS750 B$ IN CAPITAL INVESTED ACROSS RURAL AMERICA BY 2050
TO BUILD AN ENTIRELY NEW BIOENERGY INDUSTRY
2050 non-food biomass use:
• 618 million dry t (12.2 EJ) 2050
2050 E+
• 17% of primary energy
• Sources:
CRP energy grasses
Forest Corn-EtOH
residues land energy
grasses (or
equivalent)
Crops
residues
Wastes
Each circle represents
facilities drawing biomass
* Other includes a collectively small from a surrounding grid
Average facility capacity is
level of biomass converted to diesel,
10 2,100 dry t/day biomass input
synthetic methane, and/or electricity. cell area 100 mi x 100 mi.CO 2 CAPTURE AND SOME CO 2 UTILIZATION IN ALL PATHWAYS;
SIGNIFICANT CO 2 STORAGE IN ALL BUT ONE PATHWAY
• 0.7 to 1.8 Gt/y CO2 captured.
By 2050 • 0.9 to 1.7 Gt/y CO2 sequestered.
• 0.1 to 0.7 Gt/y CO2 converted to fuels.
CO2 sources CO2 sources
Direct air capture
Natural gas hydrogen (autothermal reforming)
BECCS electricity (gasifier-Allam cycle)
Natural gas electricity (Allam cycle)
BECCS hydrogen (gasifier/water gas shift)
BECCS pyrolysis (hydrocatalytic)
Cement via 90% capture (post-combustion).
CO2 uses
CO2 uses
Synthetic liquids = synthesis of fuels from H2 + CO2.
Synthetic gas = methane synthesis from H2 + CO2.
Sequestration = geological storage
RETURN TO
TABLE OF
CONTENTS
11A NEW NATIONAL CO2 TRANSPORT & STORAGE NETWORK
The 2050 U.S. CO2 2050 E+
transport network
• ~1 billion tCO2/yr
transported
• ~106,00 km of pipelines
• $170 billion in capital
12A SUCCESSFUL TRANSITION TO NET-ZERO IN 2050 IMPLIES IMPACTS
(RELATIVE TO BUSINESS-AS-USUAL) THAT VARY ACROSS PATHWAYS
ordinal ranking
100 = most impact E+
Added land use
0 = least impact 100 E-
90
E-B+
80
70 E+RE-
Added biomass 60 Added E+RE+
supply logistics 50 pipes/wires
40
30
20
10
0
Added Added energy
transition cost jobs
Added health
benefits
13MOST STATES SEE NET GROWTH IN ENERGY-RELATED EMPLOYMENT,
BUT MAJOR SHIFTS IN LOCAL ECONOMIES MUST BE MANAGED
Annual employment based on
downscaled E+ scenario
(thousand jobs)
Green, yellow, and red indicate average annual employment
in a decade is >15% above, within + 15%, or >15% below
2021 employment, respectively.
Note: Spatial redistribution of solar and wind manufacturing facilities and increasing the domestic manufacturing share offer opportunities
to ameliorate losses in fossil fuel extraction states. For assumptions used here in siting solar and wind manufacturing jobs.
14CLEAN ELECTRICITY AND ELECTRIFYING VEHICLES DELIVER LARGE
AIR QUALITY AND PUBLIC HEALTH IMPROVEMENTS ACROSS STATES
Coal Plants
premature deaths per
county (log scale)
- 300
Coal power plant
2020
Motor Vehicles
premature deaths per
county per 100,000 people
15200,000-300,000 PREMATURE DEATHS AVOIDED THROUGH 2050 BY
A NET-ZERO TRANSITION (~$2-3T IN DAMAGES)
Coal Plants
premature deaths per
county (log scale)
- 300
Coal power plant
2050
E+
Motor Vehicles
premature deaths per
county per 100,000 people
16ENERGY SPENDING IS MUCH MORE CAPITAL INTENSIVE:
2.5 T$ OF ADDITIONAL CAPITAL SPENT OVER THE NEXT DECADE
Total additional capital invested, 2021-2030, by sector and subsector for any of the net-zero pathways vs. REF (billion 2018$)
Includes capital invested pre-financial investment decision (pre-FID) and capital committed to projects under construction in 2030 but in-service in later years.
All values rounded to nearest $10b and should be considered order of magnitude estimates. Incremental capital investment categories totaling less than $5B excluded from graphic.
Other potentially significant capital expenditures not estimated in this study include establishment of bioenergy crops, decarbonization measures in other industries
17 besides steel and cement, non-CO2 GHG mitigation efforts, and establishing enhanced land sinks.NET-ZERO BY 2050 REQUIRES AGGRESSIVE ACTION TO START NOW.
EIGHT KEY PRIORITIES FOR THE 2020’S:
1 Build societal commitment, investment environment, and delivery capabilities
2 Improve end-use energy productivity and efficiency
3 Electrify energy demand, especially transportation and buildings
4 Decarbonize and expand electricity
5 Prepare for major expansion and transformation of the bioenergy industry
6 Build infrastructures: electricity transmission and CO2 transport/storage
7 Enhance land sinks and reduce non-CO2 emissions
8 Innovate to enlarge the net-zero-carbon technology toolkit
18Upcoming Webinars
• State of the U.S. Energy Storage Industry: 2020 Year in Review (2/25)
• Designing Hybrid Combined Heat and Power Systems: An Introduction to New Features in NREL’s
REopt Lite Tool (3/2)
• Solar+Storage for Puerto Rico Fire Station Resilience (3/3)
• Building Community Resilience Hubs: A Conversation with the Asian Pacific Environmental Network
and RYSE Center (3/10)
• ConnectedSolutions: How a New Program Improves the Economics and Social Benefits of
Solar+Storage in Massachusetts and Beyond (3/12)
• Collaborating with Community-Based Organizations: An Energy Justice Primer for States (3/23)
Read more and register at: www.cesa.org/webinarsThank you for attending our webinar Warren Leon Executive Director Clean Energy States Alliance wleon@cleanegroup.org Learn more about the 100% Clean Energy Collaborative at www.cesa.org/projects/100-clean-energy-collaborative
You can also read