Monthly Climate Bulletin - December 2020 - ISSN: 2617-3565 Photo Credit: T.Tofaeono (Sunset -Manono Island, Samoa) - SPREP
←
→
Page content transcription
If your browser does not render page correctly, please read the page content below
Monthly Climate Bulletin
December 2020

                                               ISSN: 2617-3565

                Photo Credit: T.Tofaeono (Sunset —Manono Island, Samoa)
CONTENTS

Summary                        2
El Niño–Southern Oscillation   3
Madden–Julian Oscillation      5
Wind                           6
Cloud and Rainfall             7
Oceanic Conditions             10
Mean Sea Level Pressure         14
Model Outlooks                  15
Cyclones                        19
Further Information             20

1 | Monthly Climate Bulletin
SUMMARY
Issued 05 January 2021

•       La Niña has likely reached its peak but impacts likely through January to March of 2021.

•       A weak pulse of the Madden-Julian Oscillation (MJO) is located over the Indian Ocean. The
        climate models forecast suggest that the MJO will not influence tropical weather in the Aus-
        tralian region in the coming fortnight.

•       The OLR total and anomaly maps suggest the Intertropical Convergence Zone (ITCZ) was
        less active than normal, in contrast to the situation in November. The South Pacific Conver-
        gence Zone (SPCZ) on the other hand, was active especially over Vanuatu, Fiji, Samoa,
        Tonga and Niue. This enhanced activity spawned severe Tropical Cyclone Yasa.

•       The December Rainfall image is dominated by a large area of reduced convection stretch-
        ing over the western to central equatorial Pacific, with the main center west of the Date
        Line.

•       The December mean sea level pressure (MSLP) anomaly map shows relaxation of the sub-
        tropical highs and an active broad area of low pressure present over Vanuatu, Fiji Samoa
        region.

•       Apart from some isolated small patches, sea level was above normal in December over CO-
        SPPac countries.

•       For January to March 2021, the dynamical models (as well as SCOPIC) agree on above
        normal rainfall for Palau, central to northern Marshall Islands, areas in Southern Regions of
        PNG, central and eastern Solomon Islands, New Caledonia, Vanuatu, Fiji, Tonga, Niue,
        southern Cook Islands and southern French Polynesia. The models also agree on below
        normal rainfall for southern Marshall Islands, New Guinea's Momase and Islands regions,
        Nauru, Kiribati, Tuvalu, Tokelau, northern Cook Islands and central and northern French
        Polynesia.

    © SPREP 2020
    This copyright statement protects our work from commercial exploitation, while ensuring that the information can be freely used for scien-
    tific, educational or research purposes, provided SPREP and the source document are acknowledged.

    2 | Monthly Climate Bulletin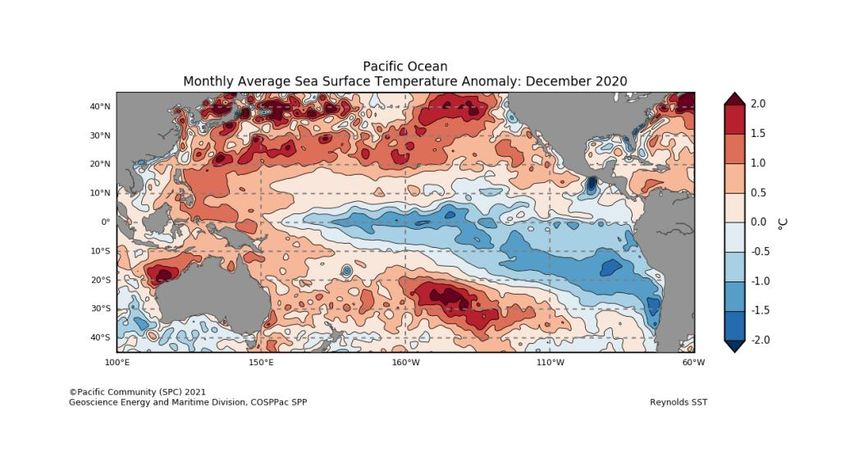
EL NIÑO–SOUTHERN OSCILLATION
La Niña has likely reached its peak, but impacts likely through first quarter
of 2021.
Climate Driver Update issued on 5th January 2021

 The 2020-21 La Niña is likely to have peaked in terms of sea surface temperatures in the Pacific
 Ocean. However, impacts associated with La Niña such as above-average rainfall, are expected
 to persist across the western pacific through January to March.

 Over the past fortnight here has been little change in sea surface temperatures across the cen-
 tral Pacific Ocean, which have been close to the La Niña threshold of 0.8°C below average since
 early December. However, the Southern Oscillation Index has risen sharply and is currently at
 +18.8, well above the La Niña threshold of +7.

 Model outlooks indicate the strength of La Niña is likely to ease in the coming weeks with a likely
 return to neutral conditions during the late southern summer or early autumn.
 The 30-day Southern Oscillation Index (SOI) for the 30 days ending 3 January was +18.8. The
 90-day SOI value was +11.8.

 3 | Monthly Climate Bulletin
EL NIÑO–SOUTHERN OSCILLATION
La Niña has likely reached its peak, but impacts likely through first quarter of
2021.
Climate Driver Update issued on 5th January 2021

                                Bureau of Meteorology NINO3.4 ENSO Model Outlooks .

                        Bureau of Meteorology NINO3.4 International Model Outlooks

 Bureau of Meteorology summary of international model outlooks for NINO3.4:

 4 | Monthly Climate Bulletin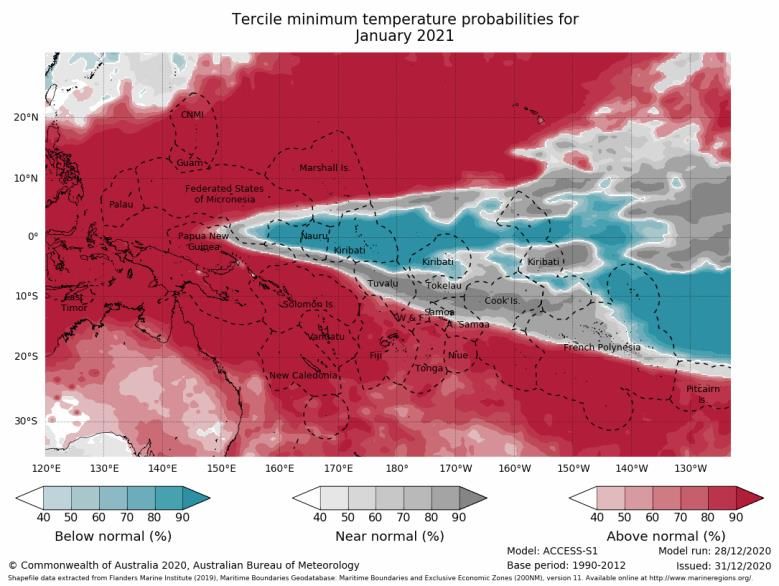
MADDEN–JULIAN OSCILLATION
Weekly Tropical Note [Issued on 05th January 2021]

The Madden-Julian Oscillation (MJO) is located
over the Indian Ocean. It is relatively weak, alt-
hough most models indicate it may strengthen mar-
ginally in the coming week. The MJO is not ex-
pected to significantly influence tropical weather in
the Australian region in the coming fortnight.

This is an abbreviated version of the Weekly Tropi-
cal Note. Click on the link below for the full version.

 5 | Monthly Climate Bulletin
WIND
Display link

The trade winds were mainly stronger than normal over the western and central equatorial Pa-
cific during December, which is consistent with the La Niña. In the eastern Pacific, the Trades
tended to be weaker than average, which is consistent with the slight rise in NINO3.
During La Niña events, there is a sustained strengthening of the trade winds across much of
the tropical Pacific, while during El Niño events there is a sustained weakening, or even rever-
sal, of the trade winds.

 6 | Monthly Climate Bulletin
CLOUD AND RAINFALL
OLR link
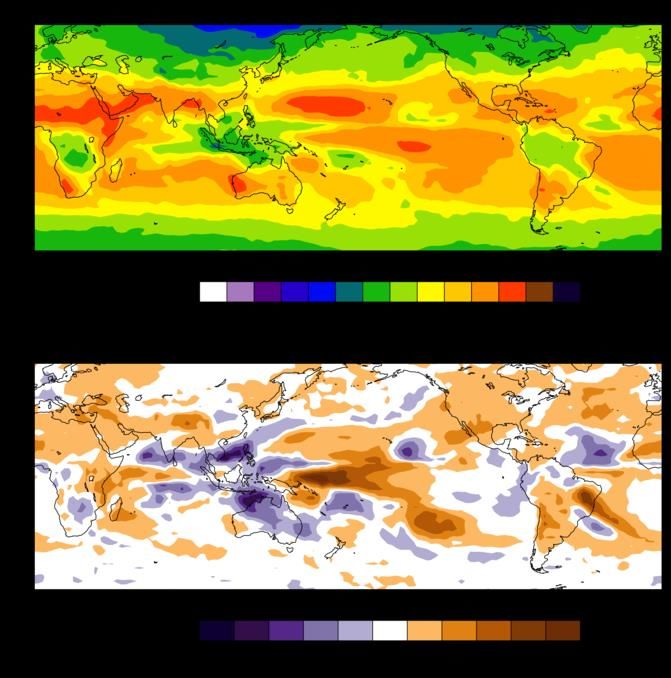
The December 30-day OLR total and anomaly maps suggest the Intertropical Convergence
Zone (ITCZ) was less active than normal, in contrast to the situation in November. The South
Pacific Convergence Zone (SPCZ) on the other hand, was active especially over Vanuatu, Fiji,
Samoa, Tonga and Niue. This enhanced activity spawned severe Tropical Cyclone Yasa. Else-
where, the SPCZ was shifted to the southwest.
Note: Global maps of OLR below highlight regions experiencing increased or decreased cloudi-
ness. The top panel is the total OLR in Watts per square metre (W/m 2) and the bottom panel is
the anomaly (current minus the 1979-1998 climate average), in W/m2. In the bottom panel, neg-
ative values (blue shading) represent above normal cloudiness while positive values (brown
shading) represent below normal cloudiness.
OLR Total and Anomalies, 30 Day OLR
7 | Monthly Climate Bulletin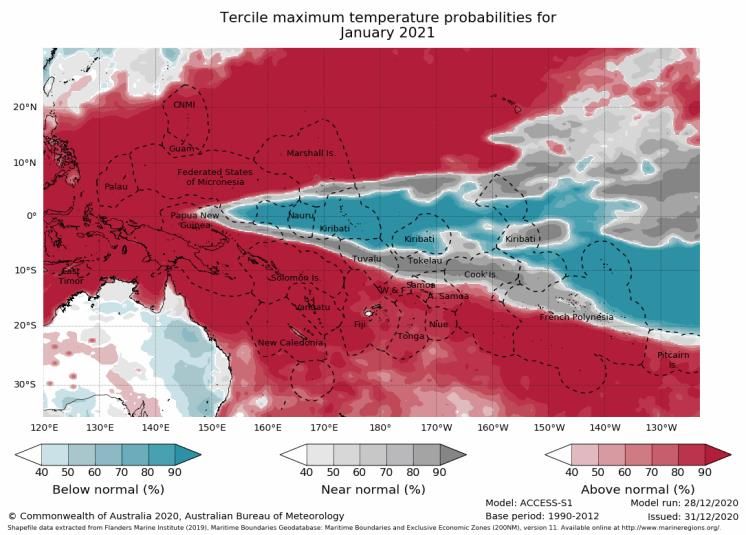
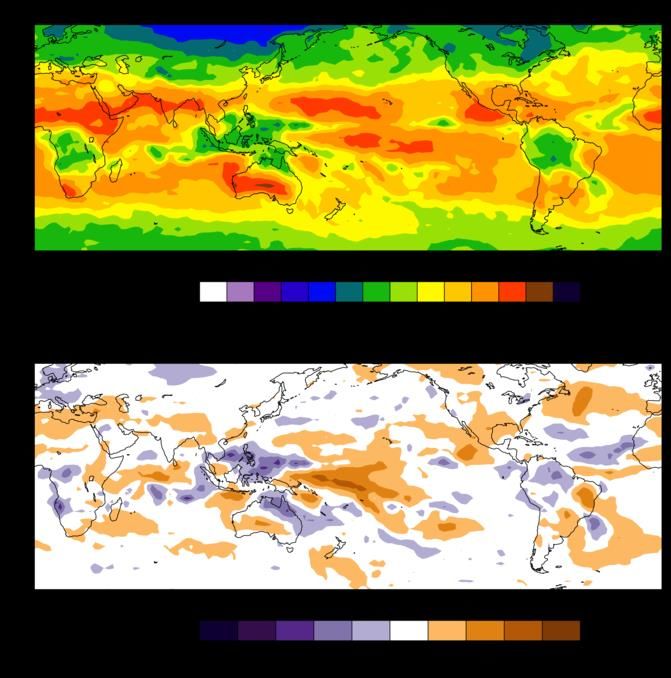
OLR Total and Anomalies, 7 Day OLR

The December Rainfall image is dominated by a large area of reduced convection stretching
over the western to central equatorial Pacific, with the main center west of the Date Line. Re-
duced convection is also evident along the normal axes of the ITCZ and SPCZ, indicating a
northward shift of the former, and a southwestward shift in the latter. Further west, increased
convection is indicated over the Maritime Continent, with filaments extending into each hemi-
sphere (e.g. across Australia). The overall picture is consistent with a mature La Niña.

 8 | Monthly Climate Bulletin
30-Day Rainfall Anomalies

NOAA Climate Prediction Centre - NCEP CMAP precipitation:

9 | Monthly Climate Bulletin
OCEAN CONDITIONS
SEA SURFACE TEMPERATURE
Pacific Community COSPPac Ocean Portal

The SST anomaly pattern in December showed the classic La Niña shape, with cool anomalies
along the equator surrounded by a boomerang-shape of positive anomalies. In the central Pacif-
ic, negative anomalies were not as strong as in November, reaching -1.5C to -2.0C in a few
small patches near the equator between 160°W and 140°W. A local cool bullseye near Vanua
Levu, Fiji, is a result of severe TC Yasa. Kiribati had anomalies in the -1.0C to -1.5C range,
while weak negative anomalies occurred in Nauru, the northern Cook Islands, and southern
Marshall Islands. Remaining COSPPac countries recorded positive anomalies between +0.5C
and +1.5C. Between November and December, there was a mix of warming and cooling in the
equatorial Pacific: modest cooling occurred between 150°E and 145°W, while somewhat strong-
er warming was observed between 150°W and 90°W. The strongest warming occurred east to
southeast of Tonga.

                            Mean Sea Surface Temperature

10 | Monthly Climate Bulletin
OCEAN CONDITIONS
SEA SURFACE TEMPERATURE
Anomalous Sea Surface Temperature
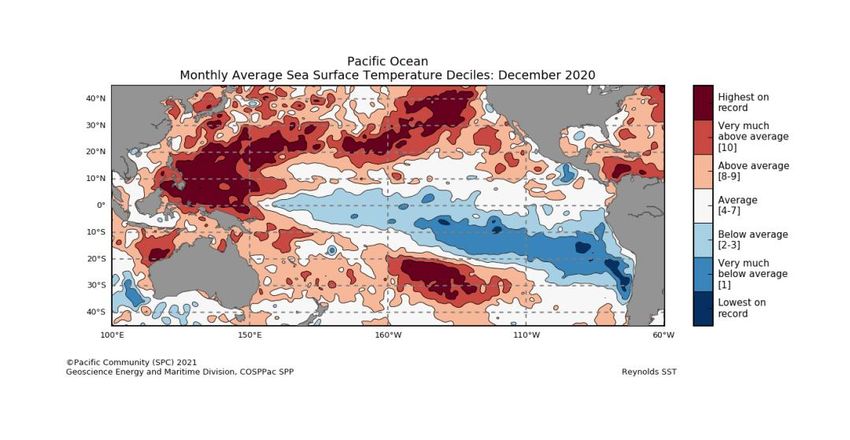
Sea Surface Temperatures Deciles
11 | Monthly Climate BulletinOCEAN CONDITIONS
SUB SURFACE
Cool anomalies persisted in the central to eastern Pacific sub-surface during December, in line
with the maturing La Niña. The cool signal strengthened in the central Pacific in line with the en-
hanced trade winds and rising SOI.
Weekly Temperatures Mean and Anomalies Monthly Temperatures Anomalies
Bureau of Meteorology Sea Temperature Analy-
sis:
TAO/TRITON Data Display:
12 | Monthly Climate BulletinOCEAN CONDITIONS
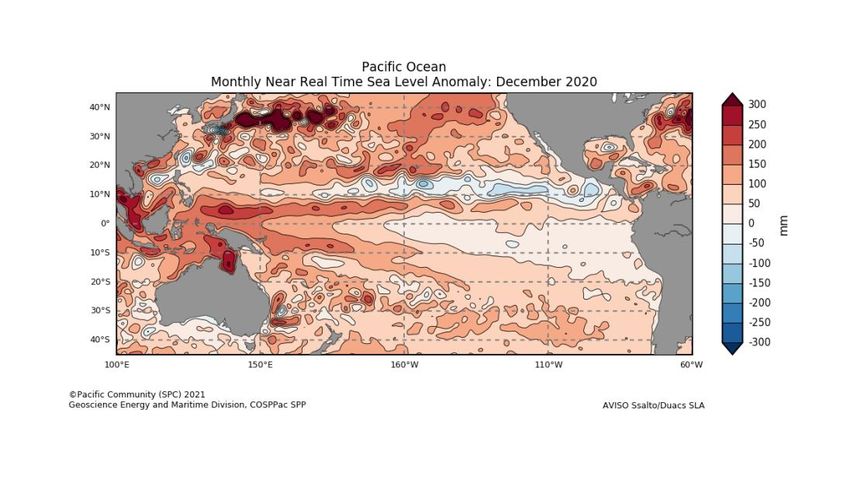
OCEAN SURFACE CURRENTS AND SEA LEVEL
OCEAN SURFACE CURRENTS AND SEA LEVEL
Apart from some isolated small patches, sea level was above normal in December over COSPPac coun-
tries. Even though La Niña has persisted, there was very little change in the small area of below average
sea level along the equator near 135°W. Affecting Palau, FSM, RMI and Kiribati was a band of positive
anomalies between 5°N and 7°N, with values between +150mm and +250mm, plus some small areas over
+250mm in FSM and Palau. Another weaker band of positive anomalies extended southeastward from
PNG across the Solomon Is, Tuvalu, Samoa to the central and northern Cook Is.
Monthly Sea Level Anomalies
Source: Pacific Community COSPPac Ocean Portal
13 | Monthly Climate BulletinMEAN SEA LEVEL PRESSURE
The December mean sea level pressure (MSLP) anomaly map shows relaxation of the subtropical
highs and an active broad area of low pressure present over Vanuatu, Fiji Samoa region.
Areas of above (below) average MSLP usually coincide with areas of suppressed (enhanced) con-
vection and rain throughout the month.
Mean
Anomalous
Bureau of Meteorology South Pacific Circulation Patterns:
14 | Monthly Climate BulletinSEASONAL RAINFALL OUTLOOK
January — March 2021
The ACCESS-S model forecast for January 2021 strongly favours below normal rainfall for Nauru, Kiribati, Tuvalu, To-
kelau, the northern Cook Islands and parts of central and northern French Polynesia, extending as far west as the
northern and eastern areas of the PNG mainland. Above normal rainfall is favoured in a boomerang-shaped zone
wrapping around the below normal wedge. Countries affected include Palau, FSM, northern and central Marshall Is-
lands, southern parts of PNG mainland, the far south of the Solomon Islands, New Caledonia, Vanuatu, Fiji and central
and southern Tonga. The three-month rainfall outlook (January-March) is very similar to the January pattern: it shows
a strong dry signal along the equator, surrounded by bands of increased chance wetter in both hemispheres. It is a
typical La Niña pattern. Note the very strong gradient in probabilities as you transition from drier to wetter in both hem-
ispheres. FSM is a good example because in the northern two-thirds of the region there is a very strong chance of
wetter than average, while the reverse is true in the southern parts of its EEZ. Above normal maximum and minimum
temperatures are favoured for all COSPPac countries, except for areas close to the equator east of 150°E, namely the
far southern Marshall Islands, Nauru, Kiribati, northern Tuvalu, Tokelau, northern Cook Islands and northern and cen-
tral French Polynesia where near-normal to below normal temperatures are favoured.
Monthly ACCESS-S Maps
The Copernicus multi-model outlook for January to March favours below normal rainfall for the northern Momase and
New Guinea Islands region of PNG, western Solomon Islands, Nauru, Kiribati, Tuvalu, Tokelau, northern and central
Cook Islands and northern and central French Polynesia. Above normal rainfall is favoured for Palau, parts of south-
ern PNG, central and eastern Solomon Islands, New Caledonia, Vanuatu, Fiji, southern Tuvalu, Tonga, Samoa, Niue
and southern Cook Islands.
The SCOPIC statistical model for January to March favours below normal rainfall for northern PNG, Kiribati, northern
and central Tuvalu, and northern Cook Islands. Above normal rainfall is favoured for Palau, FSM, southern Marshall
Islands, the southern region of PNG, Solomon Islands, Vanuatu, Fiji, southern Tuvalu, Tonga, Samoa, Niue, and
southern Cook Islands.
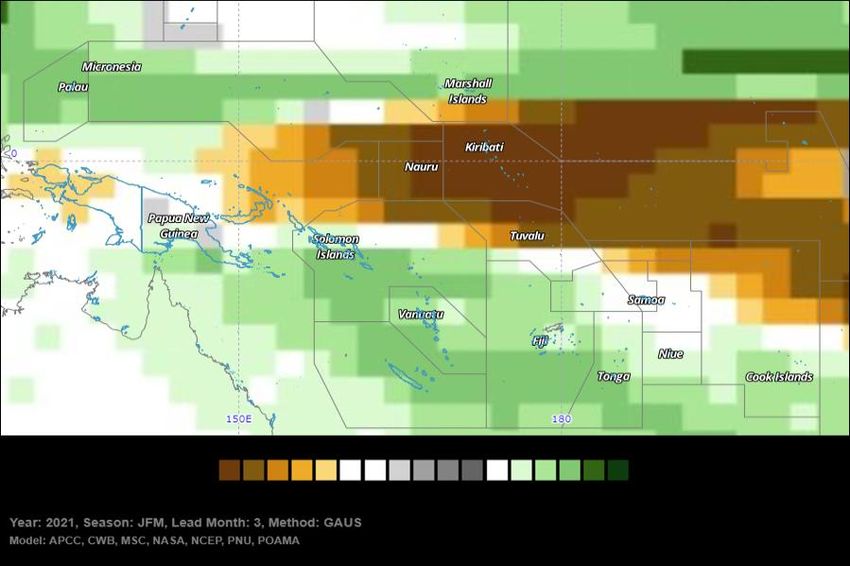
The APEC Climate Centre multi-model for January to March favours below normal rainfall for eastern FSM, far south-
ern Marshall Islands, the northern Momase, Highlands and New Guinea Islands regions of PNG, western Solomon
Islands, Nauru, Tuvalu, Kiribati, Tokelau, northern Cook Islands and northern and eastern French Polynesia. Above
normal rainfall is favoured for Palau, western and central FSM, southern PNG, Solomon Islands, New Caledonia, Va-
nuatu, Fiji, Tonga, Samoa, Niue, central and southern Cook Islands and parts of southern French Polynesia.
For January to March 2021, the dynamical models (as well as SCOPIC) agree on above normal rainfall for Palau,
central to northern Marshall Islands, areas in Southern Regions of PNG, eastern Solomon Islands, New Caledonia,
Vanuatu, Fiji, southern Tonga, Niue, southern Cook Islands and southern French Polynesia. The models also agree
on below normal rainfall for southern Marshall Islands, New Guinea's Momase and Islands regions, Nauru, Kiribati,
Tuvalu, Tokelau, northern Cook Islands and central and northern French Polynesia.
15 | Monthly Climate BulletinSEASONAL TEMPERATURE OUTLOOK
January — March 2021
Monthly ACCESS-S Maps
16 | Monthly Climate BulletinSEASONAL RAINFALL OUTLOOK
January — March 2021
Seasonal ACCESS-S maps
SCOPIC
About: SCOPIC
17 | Monthly Climate BulletinSEASONAL RAINFALL OUTLOOK
November 2020—January 2021
Copernicus (C3S multi-system)-Rainfall
Copernicus Rainfall
APEC Climate Information Toolkit for the Pacific:
18 | Monthly Climate BulletinTROPICAL CYCLONE
2020/2021 Season
In December 2020, there were three (3) Tropical Depression
(TD) developed over the Southwest Pacific Region, where 2 ACCESS-S Weekly Forecasts –Northwest Pacific
TD's intensified into Tropical Cyclone (TC's) namely TC Yasa
(Category 5) and TC Zasu (Category 2).
The weekly tropical cyclone forecast from ACCESS-S model
shows elevated risk in the week ending 13 January 2021 for
the southwest Pacific; especially areas in between 15° to 20°
South and 140°E to 165°E. For the northwest Pacific areas
between 10°N and 115°E to 140°E.
Click for the tropical cyclone season outlook for 2020-21
ACCESS-S Weekly Forecasts –Southwest Pacific
Individual Model Links
UKMO Global long-range model probability maps:
ECMWF Rain (Public charts) - Long range forecast:
POAMA Pacific Seasonal Prediction Portal:
APEC Climate Center (APCC):
NASA GMAO GEOS-5:
NOAA CFSv2:
IRI for Climate and Society:
19 | Monthly Climate BulletinOTHER INFORMATION
Southern Oscillation Index
The Southern Oscillation Index, or SOI, gives an indication of the development and intensity of El Niño and
La Niña events across the Pacific Basin. The SOI is calculated using the difference in air pressure between
Tahiti and Darwin. Sustained negative values of the SOI below −7 often indicate El Niño episodes. These
negative values are usually accompanied by sustained warming of the central and/or eastern tropical Pacific
Ocean, and a decrease in the strength of the Pacific Trade Winds. Sustained positive values of the SOI
greater than +7 are typical of La Niña episodes. They are associated with stronger Pacific Trade Winds and
sustained cooling of the central and eastern tropical Pacific Ocean. In contrast, ocean temperatures to the
north of Australia usually become warmer than normal.
Multivariate ENSO Index (MEI)
The Climate Diagnostics Center Multivariate ENSO Index (MEI) is derived from a number of parameters
typically associated with El Niño and La Niña. Sustained negative values indicate La Niña, and sustained
positive values indicate El Niño.
20 degrees Celsius Isotherm Depth
The 20°C Isotherm Depth is the depth at which the water temperature is 20°C. This measurement is im-
portant, as the 20°C isotherm usually occurs close to the thermocline, the region of most rapid change of
temperature with depth, or the division between the mixed surface layer and deep ocean. A deeper than
normal 20°C isotherm (positive anomaly) implies a greater heat content in the upper ocean, whilst a shal-
lower 20°C isotherm (negative anomaly) implies a lower than normal heat content in the upper ocean.
Regions
SST measurements may refer to the NINO1, 2, 1+2, 3, 3.4 or 4 regions. These descriptions simply
refer to the spatially averaged SST for the region described. The NINO regions (shown in the figure
below) cover the following areas:
Region Latitude Longitude
NINO1 5-10°S 80-90°W
NINO2 0-5°S 80-90°W
NINO3 5°N to 5°S 150-90°W
NINO3.4 5°N to 5°S 120-170°W
NINO4 5°N to 5°S 160°E to 150°W
NOTE: NINO1+2 is the combined areas 1 and 2
20 | Monthly Climate BulletinYou can also read