Monthly Climate Bulletin - March 2021 - ISSN: 2617-3565 Photo Credit: Tuvalu Meteorological Services (2011 Drought Impacts on water supply) - SPREP
←
→
Page content transcription
If your browser does not render page correctly, please read the page content below
Monthly Climate Bulletin
March 2021

                                                                           ISSN: 2617-3565
        Photo Credit: Tuvalu Meteorological Services (2011 Drought Impacts on water supply)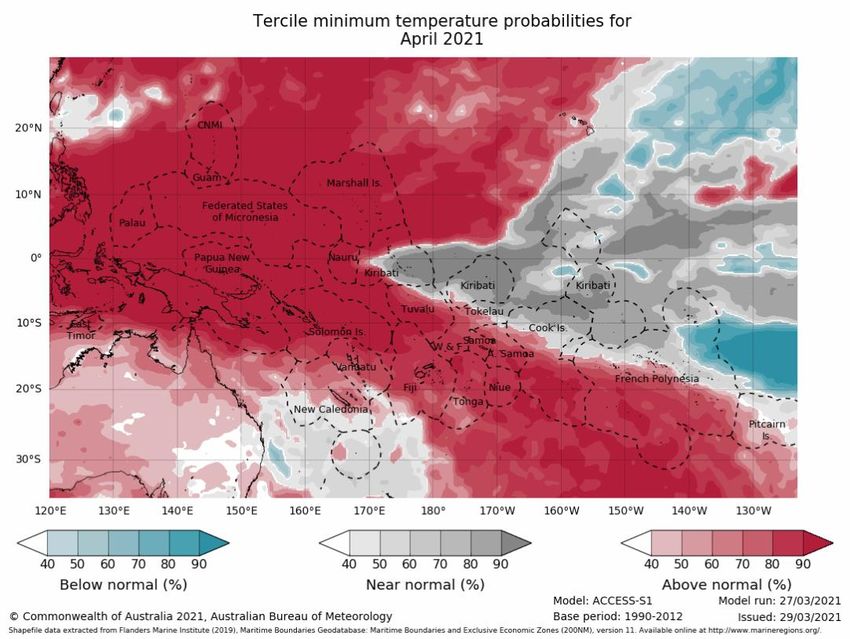
CONTENTS

Summary                        2
El Niño–Southern Oscillation   3
Madden–Julian Oscillation      4
Wind                           5
Cloud and Rainfall             6
Oceanic Conditions             9
Mean Sea Level Pressure        13
Model Outlooks                 14
Cyclones                       17
Further Information            18

1 | Monthly Climate Bulletin
SUMMARY
Issued 09 April 2021

• La Niña 2020-21 fades as El Niño Southern Oscillation returns to neutral.
• The Madden-Julian Oscillation (MJO) is moderately strong and recently moved into
  western Maritime Continent longitudes, to the north of Australia. Climate models in-
  dicate it will maintain or increase strength in the coming week as it tracks eastwards
  across the Australian region.

•     The Intertropical Convergence Zone (ITCZ) was active along it's normal position. The
      South Pacific Convergence Zone (SPCZ) was active and shifted to the southwest of
      normal.

•     Satellite imagery showed active convection over the Maritime Continent, northern
      Australia, and the southwestward-shifted SPCZ.

•     Coral bleaching was on Alert Level 1 and 2 just north and east of PNG and southern
      Cook Islands.

•     For April to June 2021, the dynamical models (as well as SCOPIC) agree on above
      normal rainfall for Palau, FSM, Marsh all Islands, southern and Momase Regions of
      PNG, New Caledonia, Vanuatu, Fiji, Tonga, Niue, southern Cook Islands and south-
      ern French Polynesia. The models also agree on below normal rainfall for Nauru,
      Kiribati, Tuvalu, Tokelau, northern Cook Islands and central and northern French
      Polynesia.

    © SPREP 2021
    This copyright statement protects our work from commercial exploitation, while ensuring that the information can be freely used for scien-
    tific, educational or research purposes, provided SPREP and the source document are acknowledged.

    2 | Monthly Climate Bulletin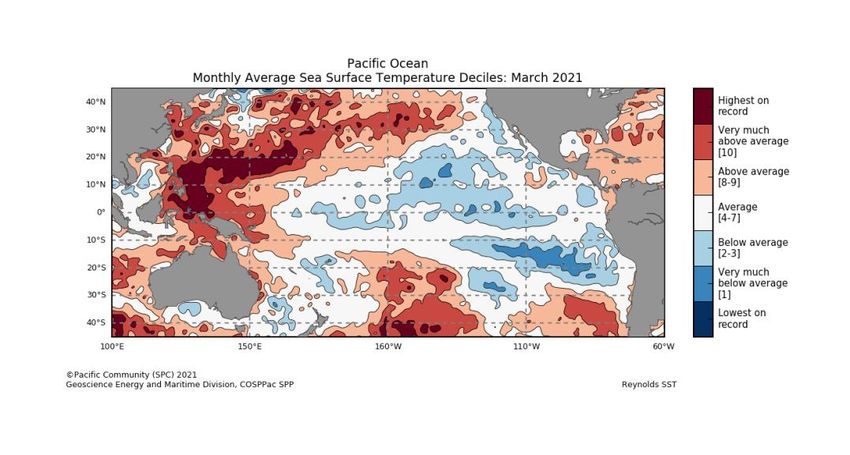
EL NIÑO–SOUTHERN OSCILLATION
La Niña 2020 -21 fades as El Niño Southern Oscillation returns to neutral

Click link to access    Climate Driver Update issued on 30 March 2021

The Bureau's ENSO Outlook has moved from La Niña to INACTIVE as most El Niño Southern
Oscillation (ENSO) indicators have now returned to neutral levels. Climate model outlooks sug-
gest the Pacific will remain at neutral ENSO levels at least until the August 2021.

Tropical Pacific Ocean sea surface temperatures have persisted at ENSO neutral values for sev-
eral weeks. Below the surface, much of the tropical Pacific is now at near average temperatures.
Atmospheric indicators are also generally at neutral ENSO levels. The Southern Oscillation Index
(SOI) is close to zero, while trade winds are currently being enhanced by the Madden Julian Os-
cillation (MJO). Only cloudiness near the Date Line continues to show a weak La Niña like signa-
ture.

The 30-day Southern Oscillation Index (SOI) for the 30 days ending 28 March was +0.5. The 90-
day SOI value was +10.9. The 30-day value has remained within ENSO neutral values over the
past two weeks.

 3 | Monthly Climate Bulletin
EL NIÑO–SOUTHERN OSCILLATION
 La Niña 2020 -21 fades as El Niño Southern Oscillation returns to neutral

 Click link to access             Climate Driver Update issued on 30 March 2021

Bureau of Meteorology NINO3.4 ENSO Model Outlooks for April, June and August

                 Bureau of Meteorology NINO3.4 International Model Outlooks

 Bureau of Meteorology summary of international model outlooks for NINO3.4: http://www.bom.gov.au/climate/model-summary/#tabs=Pacific-Ocean

   4 | Monthly Climate Bulletin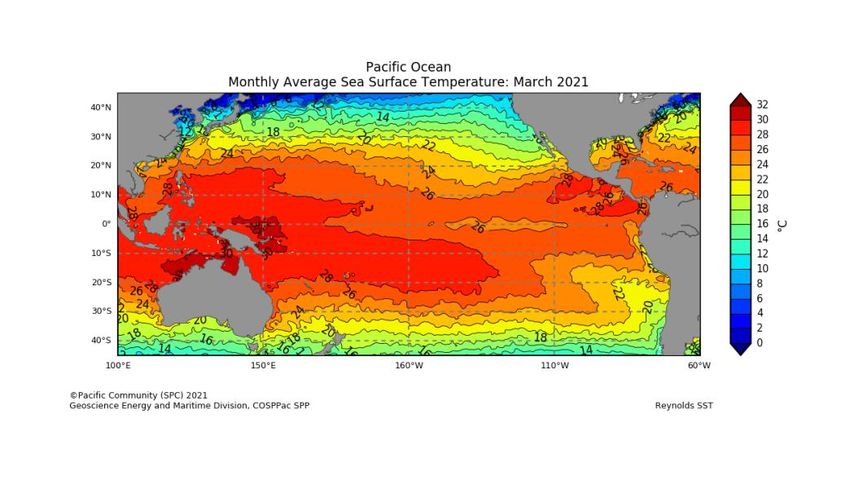
MADDEN–JULIAN OSCILLATION
Click link to access            Weekly Tropical Note [Issued on Tuesday 06 April 2021

A pulse of the Madden-Julian Oscillation (MJO)
which has been tracking eastwards across the Mar-
itime Continent to Australia's north, is likely to move
further east into the Western Pacific region in the
coming days. This pulse remains moderately
strong, but as it tracks further east, its influence on
rainfall patterns across northern Australia is likely to
lessen. At this time of the year, an MJO in the tropi-
cal Western Pacific typically increases the chance
of above-average rainfall across the islands of the
South-west Pacific, with some increased chance of
above-average cloudiness and rainfall for far north-
ern Australia.

This is an abbreviated version of the Weekly Tropi-
cal Note. Click on the Weekly Tropical for more in-
formation

 5 | Monthly Climate Bulletin
WIND
Click link to access            Wind plots link

The trade-winds in March were close to average over the central and eastern equatorial Pacific,
but were stronger than normal close to, and west of the Date Line.
During La Niña events, there is a sustained strengthening of the trade winds across much of
the tropical Pacific, while during El Niño events there is a sustained weakening, or even rever-
sal, of the trade winds.

 6 | Monthly Climate Bulletin
CLOUD AND RAINFALL
Click link to access OLR
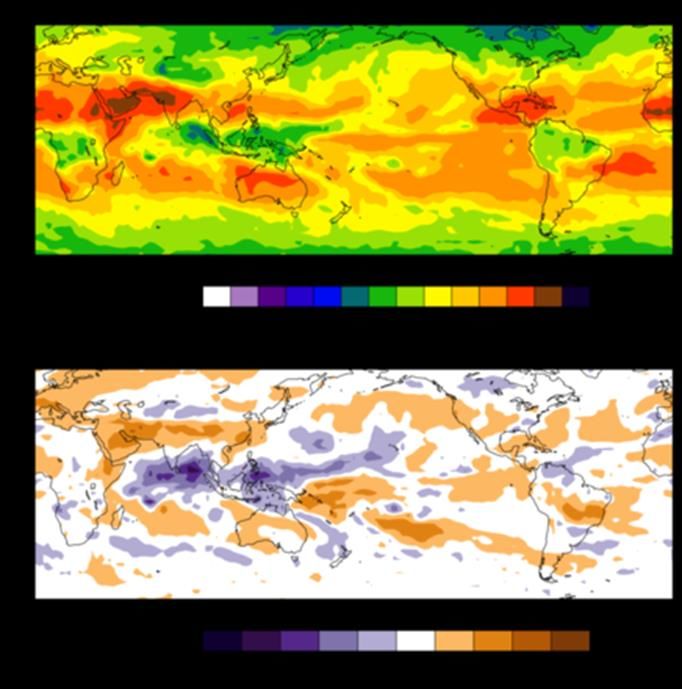
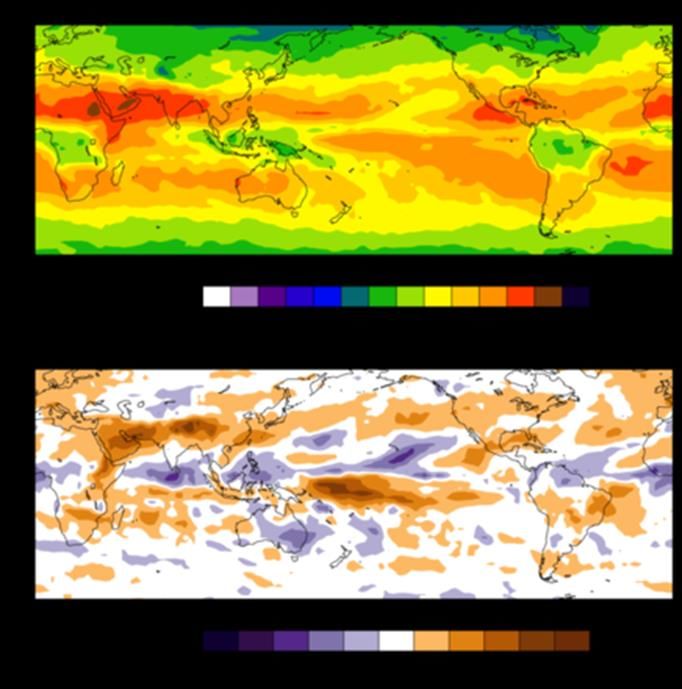
The March 30-day OLR total and anomaly maps suggest the Intertropical Convergence Zone
(ITCZ) was active in its normal position. The South Pacific Convergence Zone (SPCZ) on the
other hand, was active and shifted southwestwards over Fiji and Tonga.
Note: Global maps of OLR below highlight regions experiencing increased or decreased cloudi-
ness. The top panel is the total OLR in Watts per square metre (W/m 2) and the bottom panel is
the anomaly (current minus the 1979-1998 climate average), in W/m2. In the bottom panel, neg-
ative values (blue shading) represent above normal cloudiness while positive values (brown
shading) represent below normal cloudiness.
OLR Total and Anomalies, 30 Day OLR
7 | Monthly Climate Bulletin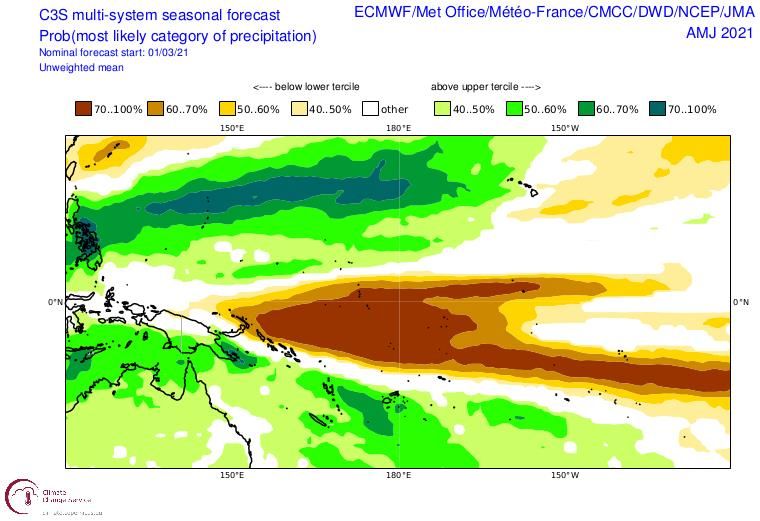
OLR Total and Anomalies, 7 Day OLR

8 | Monthly Climate Bulletin
30-Day Rainfall Anomalies

NOAA Climate Prediction Centre - NCEP CMAP precipitation:
https://ww.cpc.ncep.noaa.gov/products/Global_Monsoons/Global-Monsoon.shtml

9 | Monthly Climate Bulletin
OCEAN CONDITIONS
SEA SURFACE TEMPERATURE
Click link to access Pacific Community COSPPac Ocean Portal
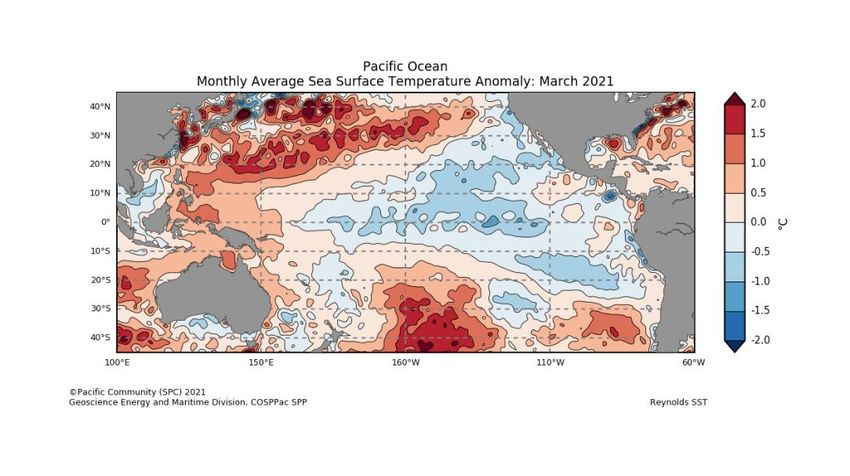
The SST anomaly pattern in March continued to show the classic La Niña shape, with below av-
erage temperatures prevailing along the equator up to Nauru. The usual boomerang shape of
above average temperatures surrounding the cool equatorial anomalies, had a break around Fiji
where negative anomalies prevailed. Highest anomalies were experienced by southern Cook
Islands where ocean temperatures were 1.5 to 2.0 degrees above average. Similarly, PNG,
FSM and Palau experienced positive anomalies of 1.0 to 1.5 degrees. The Kiribati group contin-
ued to experience cool anomalies of 0.5 to 1.5 degrees.
In terms of the deciles, regions of Highest-on-Record for March occurred in much of Palau, parts
of FSM, PNG, and Cook Islands. Regions of above average to very much above average
(deciles 8-10) SSTs spanned RMI, Tonga, Samoa, Niue and central Cook Islands. In contrast,
below average to very much below average (deciles 1-3) SSTs were observed in Kiribati, central
and southern Vanuatu and Fiji-particularly around Vanua Levu and Viti Levu where a region of
lowest on record persisted.
Mean Sea Surface Temperature
10 | Monthly Climate BulletinOCEAN CONDITIONS
Click link to access SEA SURFACE TEMPERATURE
Anomalous Sea Surface Temperature
Sea Surface Temperatures Deciles
11 | Monthly Climate BulletinOCEAN CONDITIONS
SUB SURFACE
The four-month sequence of equatorial Pacific sub-surface temperature anomalies (to 25th
March) shows cooler than average water extending across the top 100 to 150 m of the sub-
surface of the equatorial Pacific east of the Date Line. The strength and depth extent of the cool
anomalies has decreased significantly compared with February, in line with the break down of
the 2020-21 La Niña. Warm anomalies persist across large parts of the column depth west of
160 ° W, with stronger anomalies west of the Date Line. These warm anomalies remain similar
in strength compared with last month but have extended farther eastward during March.
Weekly Temperatures Mean and Anomalies Monthly Temperatures Anomalies
Bureau of Meteorology Sea Temperature Analy-
sis: http://www.bom.gov.au/marine/sst.shtml
TAO/TRITON Data Display: http://www.pmel.noaa.gov/tao/jsdisplay/
12 | Monthly Climate BulletinOCEAN CONDITIONS
CORAL BLEACHING
The daily Coral Bleaching Alert for 4th April 2021 shows 'Watch' for much of the COSPPac partner coun-
tries, peaking at Alert Level 1 and 2 just north and east of PNG and southern Cook Islands. The four weeks
Coral Bleaching Outlook to 25th April shows the 'Watch' alert continuing for most of the countries in the re-
gion with PNG and Solomon Islands on alert level 1 and 2.
Daily Coral Bleaching Alert
(Source: Pacific Community COSPPac Ocean Porta Coral Bleaching)
4-Weeks Coral Bleaching Outlook
(Source: Pacific Community COSPPac Ocean Portal)
13 | Monthly Climate BulletinOCEAN CONDITIONS
OCEAN SURFACE CURRENTS AND SEA LEVEL
OCEAN SURFACE CURRENTS AND SEA LEVEL
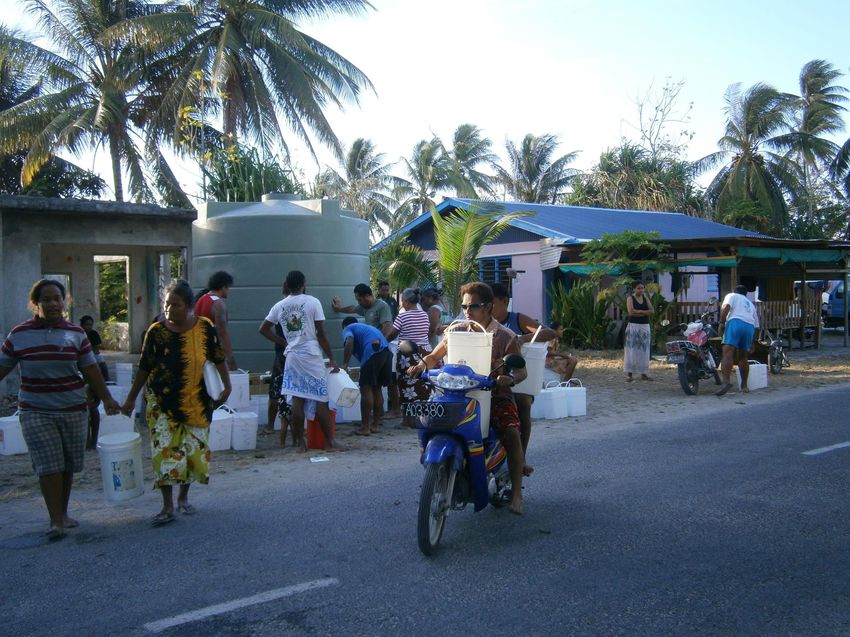
Sea level was above normal for most of the western Pacific region. The distinct boomerang shape was still
present with highest anomalies above +200mm spanning from Palau, FSM, across PNG, through Solomon
Islands, Tuvalu, Fiji, Samoa and Cook Islands. Marshall Islands, and Nauru were also above average from
100 mm to 150 mm.
Ocean Surface Current (Last 7-Days)
Monthly Sea Level Anomalies
Source: Pacific Community COSPPac Ocean Portal
14 | Monthly Climate BulletinMEAN SEA LEVEL PRESSURE
The March mean sea level pressure (MSLP) anomaly map shows negative anomalies over east of
about 155° in the tropical Pacific. Positive anomalies were present over the Vanuatu, Fiji and Ton-
ga region.
Areas of above (below) average MSLP usually coincide with areas of suppressed (enhanced) con-
vection and rain throughout the month.
Mean
Anomalous
Bureau of Meteorology South Pacific Circulation Patterns: http://www.bom.gov.au/cgi-bin/
climate/cmb.cgi?variable=mslp&area=spac&map=anomaly&time=latest
15 | Monthly Climate BulletinSEASONAL RAINFALL OUTLOOK
April—June 2021
The ACCESS-S model forecast for April 2021 strongly favours below normal rainfall for far northern PNG and Solo-
mon Islands, Nauru, Kiribati, Tuvalu, Tokelau, Wallis and Futuna, Samoa, American Samoa, the northern Cook Is-
lands, and parts of northern French Polynesia. Above normal rainfall is favoured in most parts of Palau, FSM, north-
ern and central Marshall Islands, southern and Momase regions of PNG, western Solomon Islands, New Caledonia,
Vanuatu, parts of Fiji and Tonga, Niue and parts of southern French Polynesia.
The three-month rainfall outlook (April-June) is very similar to the March pattern: it shows a strong dry signal along
the equator, surrounded by bands of increased chance wetter in both hemispheres. Above normal maximum and
minimum temperatures are favoured for many COSPPac countries, except for some areas east of 170°E, namely
Kiribati, northern Tuvalu, northern Cook Islands, plus northern and central French Polynesia, and areas southwest of
New Caledonia where near-normal to below normal temperatures are favoured.
Monthly ACCESS-S Maps
The Copernicus multi-model outlook for April to June favours below normal rainfall for northern PNG, western and
northern Solomon Islands, Nauru, Kiribati, Tuvalu, northern and central Cook Islands, and northern and central
French Polynesia. Above normal rainfall is favoured for Palau, FSM, RMI, southern and western PNG, New Caledo-
nia, Vanuatu, Fiji, Tonga, Niue and southern Cook Islands.
The SCOPIC statistical model for April to June favours below normal rainfall for Kiribati, Tuvalu, and northern Cook
Islands. Above normal rainfall is favoured for Palau, western FSM, Marshall Islands, parts of southern and Momase
region of PNG, eastern Solomon Islands, Vanuatu, Fiji, central Tonga, and southern Cook Islands.
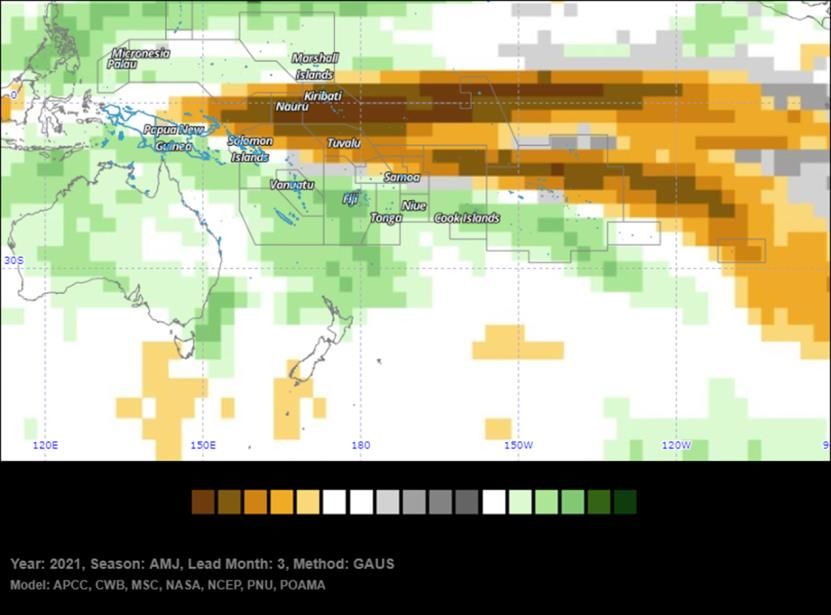
The APEC Climate Centre multi-model for April to June favours below normal rainfall for New Guinea Islands, north-
ern regions of the Solomon Islands, Nauru, Tuvalu, Kiribati, Tokelau, Samoa, northern Cook Islands, and central to
northern French Polynesia. Above normal rainfall is favoured for Palau, most of RMI, southern PNG, New Caledonia,
Vanuatu, Fiji, Tonga, Niue, southern Cook Islands and parts of southern French Polynesia.
For April to June 2021, the dynamical models (as well as SCOPIC) agree on above normal rainfall for Palau, FSM,
Marshall Islands, the southern and Momase regions of PNG, New Caledonia, Vanuatu, Fiji, Tonga, Niue, southern
Cook Islands and southern French Polynesia. The models also agree on below normal rainfall for Nauru, Kiribati,
Tuvalu, Tokelau, northern Cook Islands and central and northern French Polynesia.
16 | Monthly Climate BulletinSEASONAL TEMPERATURE OUTLOOK
April—June 2021
Monthly ACCESS-S Maps
17 | Monthly Climate BulletinSEASONAL RAINFALL OUTLOOK
April—June 2021
Seasonal ACCESS-S maps
SCOPIC
‘About SCOPIC’ www.pacificmet.net/project/climate-
and-ocean-support-program-pacific-cosppac
18 | Monthly Climate BulletinSEASONAL RAINFALL OUTLOOK
April—June 2021
Copernicus (C3S multi-system)-Rainfall
Copernicus Rainfall:https://climate.copernicus.eu/charts/
APEC Climate Information Toolkit for the Pacific: http://clikp.sprep.org/
19 | Monthly Climate BulletinTROPICAL CYCLONE
2020/2021 Season
There were twelve (10) Tropical Depressions (TD) where 6
TD's intensified into Tropical Cyclone (TC's) namely TC Yasa
(Category 5), TC Zasu (Category 2), TC Ana (Category 3), TC
Bina (Category 1, TC Lucas (Category 2) and TC Niran ACCESS-S Weekly Forecasts –Northwest Pacific
(Category 5).
The weekly tropical cyclone forecast from ACCESS-S model
shows some risk in the weeks beginning 10 April and ending
23 April 2021 for the southwest Pacific, especially in areas
around Vanuatu, New Caledonia and the central Coral Sea.
There is also some tropical cyclone risk for the northwest Pa-
cific in the week ending 23 April.
The tropical cyclone season outlook for 2020-21 is available
via: http://www.bom.gov.au/climate/cyclones/south-pacific/
ACCESS-S Weekly Forecasts –Southwest Pacific
Individual Model Links
UKMO Global long-range model probability maps: http://
www.metoffice.gov.uk/research/climate/seasonal-to-decadal/gpc-outlooks/
glob-seas-prob
ECMWF Rain (Public charts) - Long range forecast: http://www.ecmwf.int/en/
forecasts/charts/seasonal/rain-public-charts-long-range-forecast
POAMA Pacific Seasonal Prediction Portal: http://poama.bom.gov.au/
experimental/pasap/index.shtml
APEC Climate Center (APCC): http://www.apcc21.org/eng/service/6mon/ps/
japcc030703.jsp
NASA GMAO GEOS-5:http://gmao.gsfc.nasa.gov/research/ocean/
NOAA CFSv2:http://www.cpc.ncep.noaa.gov/products/CFSv2/
CFSv2seasonal.shtml
IRI for Climate and Society: http://iri.columbia.edu/our-expertise/climate/
forecasts/seasonal-climate-forecasts/
20 | Monthly Climate BulletinOTHER INFORMATION
Southern Oscillation Index
The Southern Oscillation Index, or SOI, gives an indication of the development and intensity of El Niño and
La Niña events across the Pacific Basin. The SOI is calculated using the difference in air pressure between
Tahiti and Darwin. Sustained negative values of the SOI below −7 often indicate El Niño episodes. These
negative values are usually accompanied by sustained warming of the central and/or eastern tropical Pacific
Ocean, and a decrease in the strength of the Pacific Trade Winds. Sustained positive values of the SOI
greater than +7 are typical of La Niña episodes. They are associated with stronger Pacific Trade Winds and
sustained cooling of the central and eastern tropical Pacific Ocean. In contrast, ocean temperatures to the
north of Australia usually become warmer than normal.
Multivariate ENSO Index (MEI)
The Climate Diagnostics Center Multivariate ENSO Index (MEI) is derived from a number of parameters
typically associated with El Niño and La Niña. Sustained negative values indicate La Niña, and sustained
positive values indicate El Niño.
20 degrees Celsius Isotherm Depth
The 20°C Isotherm Depth is the depth at which the water temperature is 20°C. This measurement is im-
portant, as the 20°C isotherm usually occurs close to the thermocline, the region of most rapid change of
temperature with depth, or the division between the mixed surface layer and deep ocean. A 20°C isotherm
that is deeper than normal (positive anomaly) implies a greater heat content in the upper ocean, while a
shallower 20°C isotherm (negative anomaly) implies a lower-than- normal heat content in the upper ocean.
Regions
SST measurements may refer to the NINO1, 2, 1+2, 3, 3.4 or 4 regions. These descriptions simply
refer to the spatially averaged SST for the region described. The NINO regions (shown in the figure
below) cover the following areas:
Region Latitude Longitude
NINO1 5-10°S 80-90°W
NINO2 0-5°S 80-90°W
NINO3 5°N to 5°S 150-90°W
NINO3.4 5°N to 5°S 120-170°W
NINO4 5°N to 5°S 160°E to 150°W
NOTE: NINO1+2 is the combined areas 1 and 2
21 | Monthly Climate BulletinYou can also read