DATA FOR MARCH 2020 - Published April 16, 2020 - ARMLS
←
→
Page content transcription
If your browser does not render page correctly, please read the page content below
Permission is granted only to ARMLS® Subscribers for reproduction with attribution on to “ARMLS® COPYRIGHT 2020. For questions regarding this publication contact Brand@ARMLS.com.

            DATA FOR MARCH 2020 - Published April 16, 2020

                                                                                                                                                         Sales are up +18.5%
                                                                                                                                                         month-over-month.
                                                                                                                                                         The year-over-year
                                                                                                                                                         comparison is up +3.4%.

  Closed MLS sales with a close of escrow date from 3/1/2020 to 3/31/2020, 0 day DOM sales removed

                                                                                                                                        ARMLS STAT                   MARCH 2020
1
New inventory is up
+21.3% month-over-
month while the year-
over-year comparison
increased by +0.9%.
New MLS listings that were active for at least one day from 3/1/2020 to 3/31/2020, 0 day DOM sales removed
Total inventory has a
month-over-month
increase of +17.1%
while year-over-year
reflects a decrease of
-21.3%.
Snapshot of statuses on 3/31/2020
2 ARMLS STAT MARCH 2020March UCB listings
percent of total inventory
was 18.9% with March
CCBS listings at 2.8% of
total inventory.
Snapshot of statuses on 3/31/2020
Months supply of in-
ventory for February was
2.14 with March at 2.11.
Current inventory of Active/UCB/CCBS divided by the monthly sales volume of MARCH 2020, 0 day DOM sales removed
3 ARMLS STAT MARCH 2020Average new list prices
are down -0.4% year-
over-year. The year-
over-year median is up
+5.1%.
List prices of new listings with list dates from 3/1/2020 to 3/31/2020, 0 day DOM sales removed
The average sales price
is up +11.2% year-over-
year while the year-over-
year median sales price
is also up +13.3%.
MLS sales prices for closed listings with a close of escrow date from 3/1/2020 to 3/31/2020, 0 day DOM sales removed
4 ARMLS STAT MARCH 2020A decrease is forecasted
in April for both average
and median sales prices.
ARMLS proprietary predictive model forecast, 0 day DOM sales removed
Foreclosures pend-
ing month-over-month
showed a decrease of
-1.1% while the year-
over-year figure was
down -16.2%.
Snapshot of public records data on 3/31/2020 active residential notices and residential REO properties.
5 ARMLS STAT MARCH 2020Distressed sales ac-
counted for 0.5% of total
sales, down from the
previous month of 0.6%.
Short sales dropped
-63.2% year-over-year.
Lender-owned sales
decreased -36.5% year-
over-year.7%..
New MLS listings that were active for at least one day from 3/1/2020 to 3/31/2020, 0 day DOM sales removed
Days on market were
down -15 days year-
over-year while month-
over-month were down
-9 days.
MLS sales prices for closed listings with a close of escrow date from 3/1/2020 to 3/31/2020, 0 day DOM sales removed
6 ARMLS STAT MARCH 2020COMMENTARY by Tom Ruff
Wherever we are and whatever is happening in our lives, it’s human nature to feel as though it has and will
always be this way. We’ve seen several down real estate markets in Arizona, it’s practically our birthright, but this
one is unique. Unlike the others, it will end sooner rather than later. When 2020 ends and our final sales numbers
are published, we’ll quite likely see three asterisks: BC, DC and AC. Before Corona. During Corona. After Corona.
We know where our market was BC. The great unknown is how long DC lasts. Opinions vary, but I remain optimistic
and hopeful. From the beginning of the pandemic mankind has been playing catch up, but at some point the tide
will turn. Experience will be our best teacher and shared knowledge our best ally. I believe each day our medical
professionals learn new and better therapies to treat Covid-19 patients. I believe each day our labs get closer to
finding a cure/vaccine. I believe we’ll find creative strategies to restart the economy. With each passing day, we’re
one day closer to AC. I remain positive.
BC
We began 2020 with strong tailwinds, and with the first quarter numbers in the books, our numbers were solid.
While January through March seem like ancient history, the numbers are undeniable. It seems trivial to report the
first quarter while looking at the second quarter leading indicators, but the first quarter shows where we were, and
what is possible AC.
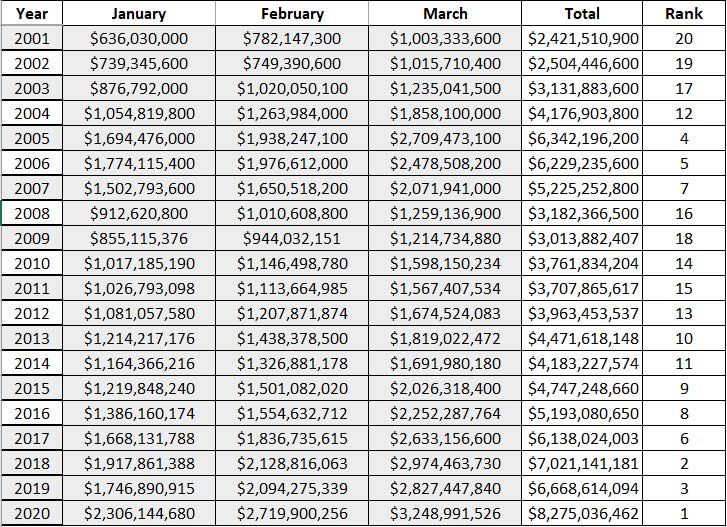
The first quarter of 2020 reported the highest gross dollar volume sales in ARMLS history.
7 ARMLS STAT MARCH 2020Gross Sales Volume via ARMLS 8 ARMLS STAT MARCH 2020
Looking in the rearview mirror, ARMLS sales volume for the first quarter was 11.1% higher than last year;
median sales price was up 13.3% in March year-over-year; average sales price was up 11.2% year-over-year and
the average price per square foot was up 9.3% in Maricopa County year-over-year.

DC

      On March 1, Maricopa County was reporting 1 confirmed case of Covid-19. On the morning of March 11 there
were 25 cases. By dinner time, it was reported Tom Hanks had contracted Covid-19 and the NBA immediately
suspended its season, with the MLB quickly following suit. If I had to choose a moment in time when the coronavirus
became very real, this would be it. Five days later educational facilities throughout Arizona were ordered closed. On
March 17, our bars and restaurants were ordered to stop serving at midnight. Last call had new meaning. On March
30 “nonessential” workers were given a stay at home order by the Governor. Nearly all our staff was now working
from home. Time began to move slowly, days seemed like weeks, weeks like months. We were learning to live life
in quarantine.

     Our market analysis shifted from annual, quarterly and monthly reports to daily reports based on 7-day moving
averages. Like the response to the virus itself, we were playing catch up, with each new report offering insights
without precedence. We came up with more questions than answers. We found ourselves in uncharted waters.

       On March 12 we saw a sudden rise in temporarily off-market listings. On March 13 the volume of listings
falling from contract increased, at the same time listings going under contract fell. On March 17 we saw a surge
in new listings. And on March 24 we saw the median original list price for new listings fall. The ARMLS data in the
charts below paints these pictures.

9                                                                                   ARMLS STAT        MARCH 2020
10 ARMLS STAT MARCH 2020
11 ARMLS STAT MARCH 2020
The luxury of 7-day running averages is they allow you to see subtle inflections. The downside is dealing with
smaller data sets that can be easily misinterpreted. For example, on March 24 we saw new listings increase. Was
this panic selling? Partially. The increase was only momentary. Today, new listings are currently in decline and are
12% lower compared to the same period in 2019. As we originally suspected in STAT last month, both sellers and
buyers have taken a step back. There is insufficient data to support this hypothesis, but it is my suspicion that the
initial surge in new listings came from leveraged short term rentals.

12                                                                                   ARMLS STAT        MARCH 2020
At first blush, it would also be very easy to interpret a drop in the median list price as a leading indicator of
falling prices. This is not always the case. We were able to validate our suspicions on this data element. The drop in
the median list price the final week of March was not indicative of falling prices, but instead had to do with the
“blend” of new listings. By comparing individual list prices to the automated valuation for each listing, we were able
to conclude the decline in the median list price was directly attributed to the value of the new properties listed. The
median value of new listings between March 24 and March 31 was 7% lower than median values for prior weeks. In
short, we were seeing far fewer high-end listings. When the April closing numbers are reported, we will see a decline
in our pricing metrics, but remember that this decline has more to do with the mix of properties sold as opposed to
a drop in prices. We will reapply this same analysis to the April closing data to reaffirm or disprove this hypothesis.
Again, we will see a slight drop in the median sales price when April’s numbers report.

       Historically, pending contracts increase throughout April and reach their annual peak late in the month. This
will not be the case this year. Pending contracts tend to increase the most on Tuesdays. It’s not coincidental that our
pending contracts this year peaked on Tuesday, March 10, the day before “the day.”

       Listings under contract are a leading indicator of future closings. The Volume of Listings Going Under Contract
chart shows a widening gap between 2019 and 2020. Year-over-year sales will be down in April and again in May.
The biggest challenge I’ve faced in Covid-19 analysis is trying to anticipate the drop in sales volume over the next
couple of months. Various models draw varying conclusions. We began April with contracts down 20.29% which
would normally be indictive of April closings. I suspect the closings in April will be at least 10% south of that number,
but it’s a guess at best. Of all our 7-day charts, this is our most ominous. But keep in mind, this is only a short-term
chart, and when the market turns, it will be the chart that offers the first ray of sunshine.

13                                                                                    ARMLS STAT         MARCH 2020
A few observations while our market pauses. • ibuyers have suspended home buying activity. We will see limited buying and selling activity in April as they only honor prior contracts. • Foreclosure activity in April will be very light. We have seen a limited number of new notices and virtually no actual foreclosures. The reason: forbearance. • Investors are facing additional challenges as hard money lenders are withdrawing from the market completely or raising rates. Wholesalers are facing a multitude of challenges as well. • We’re seeing a jump in virtual tours as agents and prospective buyers adapt to social distancing guidelines. • Demand for new homes is falling and will continue to drop into the third quarter according to Belfiore Real Es- tate consulting. • Real Estate investors that fix and flip will see their market share of sales increase in April. Covid-19 will not keep their finished projects off the market. Their purchases are leveraged, and the houses are vacant. Time is mon- ey. Their challenges will lie in acquiring new inventory. • Our market will adapt to the challenges Covid-19 presents. For example, title agencies are offering drive- through services for homebuyers. • The biggest challenges in commercial real estate will be related to the number of people employed in the ser- vice industries, such as retail and restaurants as well as tourism. Retail was vulnerable before the virus; the effects may go beyond short term. 14 ARMLS STAT MARCH 2020
In Conclusion

       Before we get to AC, we still must get through DC. The question is how long. The early mathematical mod-
els for Covid-19 were beyond alarming, but over the last two weeks we’ve seen estimates significantly decrease,
which is encouraging. For instance, casualty estimates of 240,000 just weeks ago are now down to 60,000. One of
the best models I’ve seen comes from the Institute for Health Metrics and Evaluation. I’ve provided a snippet of the
modeling for Arizona below, to get a more complete picture click here.

Hospital Resource Use by IHME

     		Disbelief		               Shock		          Fortitude		         Hope			           Resilience

      I’ve offered one-word descriptions at the bottom of the chart; I chose words that describe my feelings today as
I looked back in time, but also my outlook moving forward. The model projects peak resource use on April 26th in
Arizona. From my point of view, I’ve moved from disbelief and shock on to fortitude. I can see hope on the horizon.
Be responsible. Stay cautious. Be safe. I look forward to the day when the umpire shouts: “Play Ball.”

15                                                                                  ARMLS STAT       MARCH 2020
The Pending Price Index
Last month the STAT mathematical model projected a median sales price for March of $301,000. The March
reported median was $302,500. Looking ahead to April, the ARMLS Pending Price Index anticipates the median
sales price will decline, projecting a median sales price of $299,900.
We begin April with 5,592 pending contracts; 3,451 UCB listings and 518 CCBS giving us a total of 9,561 res-
idential listings practically under contract. This compares to 11,995 of the same type of listings one year ago. At the
beginning of March, the “pending” contracts were 20.29% lower than last year. There were 22 business days in April
of 2019 and 22 this year. ARMLS reported 9,493 sales in April of 2019. STAT projects 6,000 sales this April. This
estimate can best be described as a guess.
16 ARMLS STAT MARCH 2020You can also read