Changes in Transportation Patterns Follow Community Mitigation Policies in King County, WA February - May 2020
←
→
Page content transcription
If your browser does not render page correctly, please read the page content below
Report date: June 3, 2020

Changes in Transportation Patterns Follow Community Mitigation Policies
in King County, WA
February – May 2020
BACKGROUND
                                                                                        KEY POINTS
Transportation patterns changed immediately after strategies were
put in place to slow the spread of COVID-19. Low traffic volumes are      1) Immediately after the March 23,
one way to quantify whether the community is staying home and             2020 “Stay Home, Stay Healthy” order,
avoiding non-essential activities. Prior to community mitigation          highway traffic volumes across King
efforts, 72% of King County workers drove to work (either alone or in
                                                                          County fell to its lowest point on March
a carpool), 13% took public transit, 7% walked or biked to work, and
                                                                          27th: a 56% decline in usual weekday
6.7% worked at home. Policy changes resulted in drastic changes in
usage of highways, public transportation, ferries, walking, and           and a 67% decline in usual weekend
bicycling in King County and Washington State.                            volume. The decline ranged from 37%-
                                                                          78% below baseline across highway
COMMUNITY MITIGATION TO SLOW THE SPREAD                                   routes.
Community mitigation policies emerged from local businesses,
                                                                          2) Traffic volumes remain lower than
schools and governments throughout March. By March 4, 2020, large
employers like Amazon, Microsoft and others had mandated                  usual but gradually rose through April
telecommuting for those who could work from home. All major               and May. Weekday total highway traffic
colleges in King County also halted in person classes, sports and other   volume increased 60% between March
events and switched to online learning platforms beginning March          27th and May 22nd. Weekend traffic
9th.                                                                      increased 77% during that period.
                                                                          State Route-167 has almost returned to
Washington’s Governor limited group gatherings to less than 250           baseline levels. Weekday traffic on
people as of March 11th, subsequently expanding that statewide and        ferry routes, public transportation and
reducing the limit to less than 50 people on March 16th. These            some roads remain low.
reductions put an immediate halt to leisure gatherings such as
performance arts, sporting events, and conventions. On March 16th         3) Bicyclist traffic in downtown Seattle
the Governor’s proclamation prohibited onsite consumption of food         follows the other transportation
and beverages from public venues which impacted operations at             patterns above. In contrast, pedestrian
restaurants, bars, coffee shops, or other similar venues and limited      and bicyclist counts on neighborhood
operation to take-out. The proclamation also prohibited the               trails are steady or higher than
operation of public venues in which people congregate for                 baseline.
entertainment, social or recreational purposes.
                                                                          4) Motor vehicle crashes of all kinds
Statewide school closures for all public and private K-12 and higher      have fallen by 62% in April 2020 as
learning institutions began March 17th, although individual districts     compared with April of 2019. However,
began to close earlier. These closures were later extended through        the number of fatal crashes remains
the end of the school year in June.                                       similar to 2019 levels.

The Governor’s “Stay Home, Stay Healthy” order, which ordered all
Washingtonians to stay home unless they need to pursue an essential activity, banned all gatherings for
social, spiritual and recreational purposes and closed all non-essential businesses as of March 23, 2020.
Following the “Stay Home, Stay Healthy” order, area transit agencies began implementing a series of
policies aimed at supporting essential worker commuting and social distancing requirements that

                                                 Page 1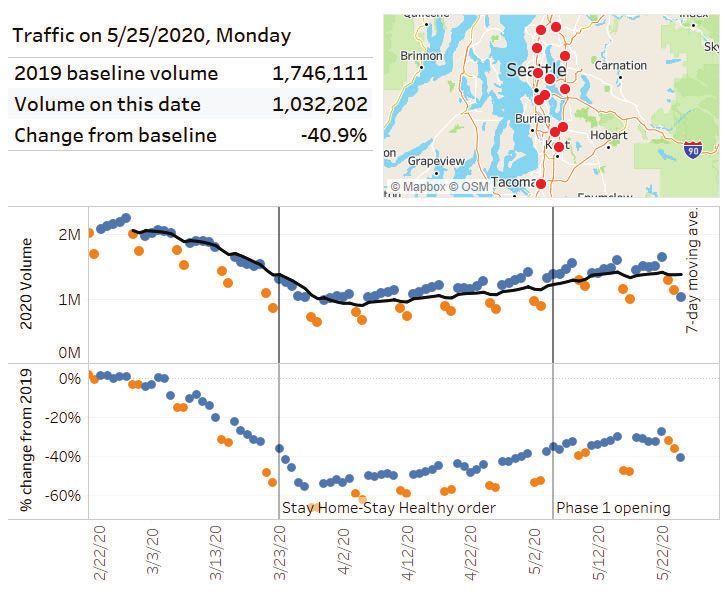
included reduced or free fares, limits on ridership, buffer space for drivers and face covering
requirements.
On May 5th, Washington officially began Phase 1 stage of reopening. Phase 1 continues the “Stay Home,
Stay Healthy” order and limits on group gatherings, but allows some business and outdoor recreation to
operate. Industries allowed in Phase 1 include construction, vehicle and vessel sales, spiritual drive-in
services, car wash, landscaping and outdoor maintenance, pet walking, curbside retail, and a variety of
outdoor recreation including the opening of day use for state parks. While some Washington counties
are now in Phase 2 of the reopening, King County remains in Phase 1 at the time of this report.
HIGHWAY, PUBLIC TRANSPORTATION, FERRY, AND TRAIN USE DECLINE AS RESTRICTIONS BEGIN
King County traffic volumes for January-February 2020 were relatively stable and similar to the 2019
level until the end of February. In March, use of highways, toll roads, ferries, and public transportation
all fell quickly as restrictions on gatherings began. At the end of March, a few days after the governor’s
March 23rd “Stay Home, Stay Healthy” order, highway traffic volume and public transportation ridership
reached the lowest point.
Highway/toll roads reach a low on March 27th. Total weekday highway traffic volume in King County
and Washington State overall reached its lowest point on Friday, March 27th, at 56% below the same day
of the week in 2019 (51% below statewide). Weekend traffic volumes experienced greater declines,
reaching the lowest point on March 28th at 67% below baseline in King County and 63% below baseline
statewide. All 13 highway monitoring locations saw declines, although the least decline was on State
Route (SR)-167. On Friday, March 27th, SR-167 was only 37% below baseline whereas the county average
was 56%. The decline was greatest on the SR-520 floating bridge (78% decline on 3/27). Counts on I-405
in Kirkland and Bellevue had a 60% decline and the I-90 floating bridge saw a 66% decline. The
remaining locations experienced declines between 52% and 56%.
Public transportation, ferries, and Amtrak ridership also showed similar trends. On Friday, March 27th,
transit ridership declined an average of 74% across the three transit agencies serving King County. The
decline for King County Metro, Sound Transit, and Community Transit, was 71%, 85%, and 65% below
2019 respectively. For Saturday March 28, the decline was 78%, 80%, and 44%, respectively, below
2019 ridership on the same weekend day. Statewide ridership experienced a similar 70% decline by
March 27th.
Ferry ridership on Friday, March 27 for the two routes serving Seattle declined an average of 87% below
the 2019 level. For Saturday, March 28, it declined 92%. Amtrak Cascades data were made available
beginning in April. On Thursday, April 2, Amtrak ridership was 97% below the 2019 level with only 62
riders.
ROAD TRAFFIC RETURNING TO USUAL LEVELS
Since the end of March, highway traffic, including toll trips, has been increasing steadily on all routes.
Weekday total highway traffic volume increased 60% between March 27 and May 22 while weekend
traffic increased 77% between March 29 and May 24. On Friday, May 22th and Sunday, May 24th,
highway traffic volume was only 27% and 36% below the 2019 level respectively, compared to the low
points of 56% below and 66% below baseline in late March. Weekend traffic remained lower than in
2019 throughout May, with smaller declines on the weekend of May 9-10 (Mother’s Day), and larger
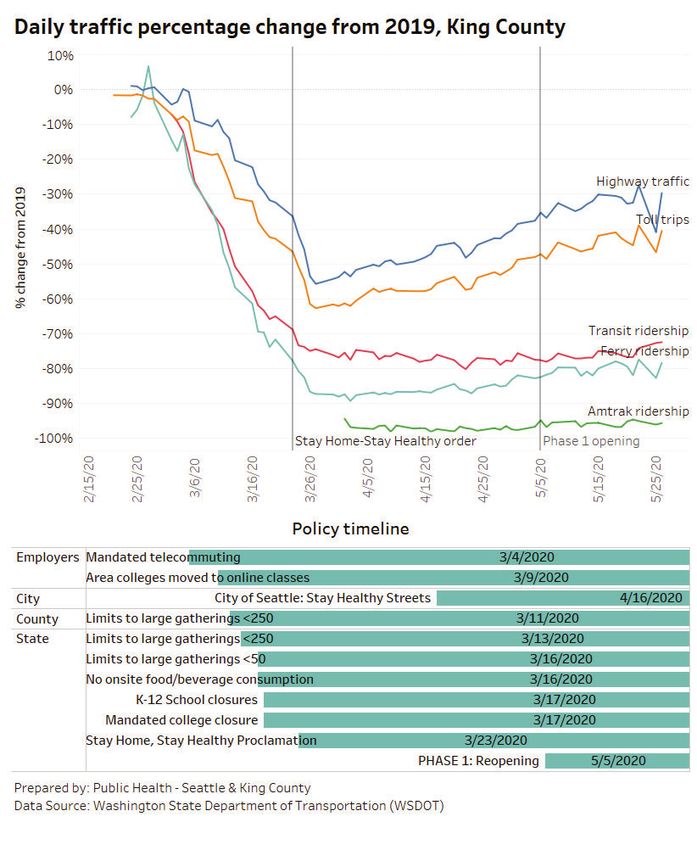
declines again the following weekend. Figure 2 shows the overall highway daily volume and percentage
change in King County from 2019 from late February-May. Some highways have almost regained their
2019 volumes (e.g. SR-167 a 4% decline) but some, like SR-520 and I-90, still see marked declines
Page 2(decline of 59% on SR-520 and 41% decline on I-90 as of May 22th). Low volumes on SR-520 may be
influenced by workplace policies of major employers and required tolls on this route. Statewide traffic
has also increased, with highway traffic volume of 22% below baseline on Friday, May 22nd and 27%
below on Sunday, May 24th.
Figure 1. Daily weekday traffic percentage change for 2020 compared to the same day of the week in
2019. For weekend data, see www.kingcounty.gov/covid/impacts/traffic
Page 3Since March 27, ferry ridership has remained at low levels into late April although they are on the rise.
Weekday ferry ridership increased from 87% below 2019 baseline to 77% below 2019 baseline between
April 23 and May 22. For weekends, ferry ridership increased from 92% below 2019 on March 29 to 72%
below 2019 by May 23rd. Statewide ferry ridership has also increased from the low of 87% below
baseline on March 28th to 54% below baseline by May 22nd.
Transit ridership in King County and the statewide average have stayed at the low level reached at the
end of March and we have not seen any significant change in both the ridership volume and the
percentage change from baseline since then for any of the three King County transit agencies. Amtrak
ridership only increased slightly in early May and was still below 95% of the 2019 level at the current
time.
Figure 2. Daily traffic volume and percentage change from 2019 on King County highways show a steady
increase.
Note: The solid line denotes 7-day average. Blue dots are weekdays; orange denotes weekends.
BICYCLING AND PEDESTRIAN COUNTS STEADY OR INCREASING
Trends on biking and walking show different patterns from the other modes of transportation discussed
above. Washington State’s March 23rd “Stay Home, Stay Healthy” proclamation stated that “it’s still
safe for people to go outside as long as they remain at least six feet from each other. Grocery stores and
other essential businesses will remain open. People can still participate in activities such as bike rides,
Page 4ŐĂƌĚĞŶŝŶŐ͕ĂŶĚĚŽŐǁĂůŬŝŶŐറ—റĂƐůŽŶŐĂƐ they follow social distancing rules.” Therefore, higher volume of
active transportation, if social distancing guidelines are observed, can be viewed as necessary.
Bicyclist counts declined in downtown Seattle (4 counter locations) in March and reached the lowest
levels at the end of March. Downtown Seattle bicycle volume has stayed at this low level through the
end of April and is likely influenced by work commuting patterns. At other trails, greenways, and cycle
tracks within Seattle, bicyclist counts were similar to the 2019 baseline on weekdays, with large
increases on weekends (up to 90% increase on April 26th). Hourly counts of bicycling within these
Seattle locations suggest a change in trip purpose from work commuting to other purposes. Daily
bicyclist volume has seen a large, steady increase in the remainder of King County. On April 17th, other
locations in King County saw a peak 130% increase in bicyclists above the 2019 baseline.
Pedestrian counts at counted locations remained steady in late March then more than doubled
throughout April on both Seattle trails and other King County measurement points. Changes ranged
from -1% to +173% on March 27; changes varied by pedestrian counter location. On April 20th, there
was a 124% increase in pedestrians counted in Seattle. Hourly counts within Seattle are suggestive of
changes in trip purpose. Outside Seattle, pedestrian volume percent change doubled in early April.
EARLY INDICATIONS OF REDUCED CRASHES
Motor vehicle crashes fell 62% in King County (55% statewide) in April 2020 as compared with April
2019, and there was a smaller 37% decline (22% statewide) in March. There was also a decline in
crashes that resulted in serious or minor injuries. However, the number of fatal crashes remained
similar (38 fatal crashes statewide in April 2020 as compared with 30 in 2019; 10 of those fatal crashes
occurred in King County). Factors that may contribute to crashes such as speed, weather conditions, or
driver impairment are not available at this time; May data are not yet complete.
POLICIES TO MITIGATE THE IMPACT
Lower levels of non-essential trips are the goal of successful non-pharmaceutical interventions to slow
the spread of COVID-19. To promote physical activity and well-being, the City of Seattle launched its Stay
Healthy Streets pilot in mid-April. This pilot program supports the ability of residents to walk or bike to
grocery stores and essential businesses by closing some city streets to through traffic. These streets also
add to the City’s extensive park system and provide more room for people to safely recreate or exercise
outdoors. Subsequently, Seattle City Mayor Durkan announced on May 7th that the pilot project will
become permanent.
LIMITATIONS
These data have many limitations. They do not allow for the ability to disaggregate by whether these
are essential trips, essential workers, how far people are going, nor the demographic characteristics of
the people making these trips. They also measure counts at specific points and do not count all trips.
Short neighborhood trips may not by reflected in traffic counts. Weather may also play a role,
particularly for walking and biking. We will continue to monitor these data (see
www.kingcounty.gov/covid/impacts) and examine changes as phased re-opening continues.
Page 5Technical Notes
We used the following transportation data: WSDOT daily traffic volumes at 13 highway locations in King County;
WSDOT daily toll trips along 6 toll road locations; WA State Ferries daily ridership for the Seattle-Bremerton and
Seattle-Bainbridge Island routes; transit ridership for King County Metro, Sound Transit, and Community Transit;
Amtrak Cascades ridership; active transportation (bicycle/pedestrian) data from WSDOT and Seattle Department of
Transportation (SDOT), and WSDOT crash data (which only count crashes if a police report has been filed). Traffic
volumes for SR-167 are managed lanes only. Work commuting data are from the U.S. Census Bureau, 2018 American
Community Survey; it does not include recreational or other non-work commuting trip purposes.
Active transportation data volumes were measured at 20 trail, greenway, or cycle track locations throughout King
County; Seattle data are only available through April 30. Counters in downtown Seattle were located at 2nd Ave &
Cedar, 2nd Ave & Marion, 7th & Blanchard, and Westlake & Newton. Active transportation activities may be for
transportation (such as walking to a bus stop or bicycling to work) or for leisure or exercise. Not all locations
measured both pedestrian and cyclist use. Weather has a strong influence on active transportation trends and late
April was a rainy period.
At the time of this writing, highway, transit, and ferry data are through 5/25/2020. Year-over-year percent change
comparisons of the 2020 data are made to the same day of the week in 2019 (e.g. Monday, May 18, 2020 is compared
to Monday, May 20, 2019) as traffic volumes dip on weekends. The percentage change compares the difference
between 2020 and 2019 as compared to the 2019 baseline. During March and April of 2019, the highway traffic
volume was 4% below the weekday average on Saturdays and 15% below on Sundays. During March and April of
2020, the volume drop in the weekends was larger than weekdays. Therefore, volume trend analyses are examined
using 7-day moving averages in traffic volume.
Resources
Washington State Coronavirus Response: https://coronavirus.wa.gov/
WSDOT COVID-19 Multimodal Transportation System Performance Dashboard:
https://www.wsdot.wa.gov/about/covid-19-transportation-report/
King County Parks COVID-19 News & Updates: https://kingcountyparks.org/covid/
Suggested citation
Changes in Traffic Patterns & Community Mitigation Efforts in King County, WA: February-May 2020. June 3, 2020. Lin
Song, Scott Neal, Fel Pajimula, Kris Johnson, Amy Laurent, Eva Wong. Public Health Seattle & King County; Assessment
Policy Development and Evaluation Unit.
This work is funded by Public Health — Seattle & King County, the Washington State Department of Health, and the
Centers for Disease Control and Prevention’s (CDC) Epidemiology and Laboratory Capacity for Prevention and Control
of Emerging Infectious Diseases (ELC) Cooperative Agreement (CK19-1904).
See kingcounty.gov/covid/impacts for more information, map of monitoring locations, and updated data.
Page 6You can also read