On track to deliver guidance - HALF-YEAR RESULTS 2019 Cécile Cabanis, CFO - Danone
←
→
Page content transcription
If your browser does not render page correctly, please read the page content below

HALF-YEAR RESULTS 2019

     On track
to deliver guidance

      July 25, 2019

  Cécile Cabanis, CFO

                         I 1 I
Disclaimer

• This presentation contains certain forward-looking statements concerning Danone. In some cases, you can identify these
  forward-looking statements by forward-looking words, such as “estimate”, “expect”, “anticipate”, “project”, “plan”, “intend”,
  “objective”, “believe”, “forecast”, “guidance”, “foresee”, “likely”, “may”, “should”, “goal”, “target”, “might”, “will”, “could”,
  “predict”, “continue”, “convinced” and “confident”, the negative or plural of these words and other comparable
  terminology. Forward looking statements in this document include, but are not limited to, predictions of future activities,
  operations, direction, performance and results of Danone.
• Although Danone believes its expectations are based on reasonable assumptions, these forward-looking statements are
  subject to numerous risks and uncertainties, which could cause actual results to differ materially from those anticipated in
  these forward-looking statements. For a detailed description of these risks and uncertainties, please refer to the “Risk Factor”
  section of Danone’s Registration Document (the current version of which is available on www.danone.com).
• Subject to regulatory requirements, Danone does not undertake to publicly update or revise any of these forward-looking
  statements. This document does not constitute an offer to sell, or a solicitation of an offer to buy Danone securities.
• All references in this presentation to like-for-like changes, recurring operating income, recurring operating margin, recurring net
  income, recurring income tax, recurring EPS and free cash flow correspond to financial indicators not defined in IFRS. Please
  refer to the H1 2019 results press release issued on July 25, 2019 for further details on IAS29 (Financial reporting in
  hyperinflationary economies), the definitions and reconciliation with financial statements of financial indicators not defined in
  IFRS. Finally, the calculation of ROIC and Net Debt/Ebitda is detailed in the annual registration document.
• Due to rounding, the sum of values presented in this presentation may differ from totals as reported. Such differences are not
  material.

                                                                                                                                   I 2 I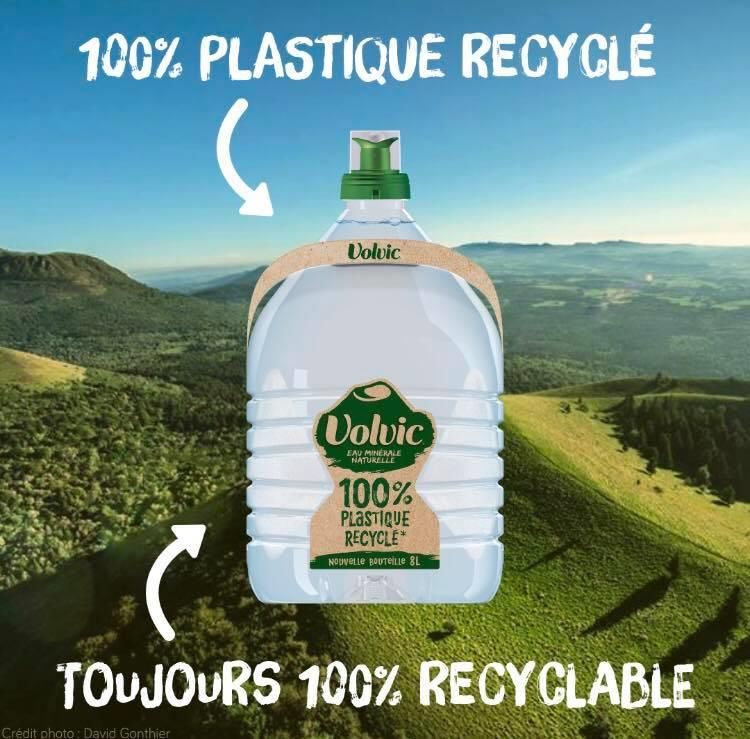
Q2 and H1 2019 highlights
Solid progress on growth and efficiency

        Like-for-like Sales Growth                              Recurring Operating Margin
  Rebound in Q2 confirming acceleration                   7th consecutive semester of improvement

              +2.5%                                                  14.69%
                 €6.5 bn                                                 +42 bps

             Accelerating                                               Maximizing
               Growth                                                   Efficiencies
                                          Recurring EPS

                                          +6.3%
                                             €1.87

                                                                                                    I 3 I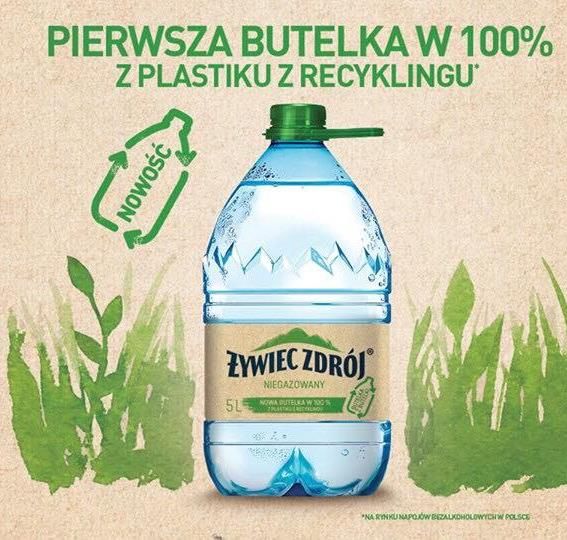
Q2 and H1 2019 highlights
Good execution, full-year guidance confirmed
     Like-for-like sales growth rebound in Q2
    ▪ All businesses growing >2%

    ▪ Strong innovation momentum: ~30% of sales

1   ▪ EDP growing in all regions, including in Europe
                                                                 2019 full-year
    ▪ Return to growth in ELN China
                                                              guidance confirmed
    ▪ Poor weather conditions impacting Waters

                                                            LFL sales growth around 3%
     Efficiency maximization on track

2   ▪ ~€150m Protein incremental savings in H1
                                                          Recurring operating margin >15%

    ▪ ~€150m restructuring charge to adapt organization

     Disciplined capital allocation to fuel growth
3   ▪ Portfolio management: sale of Earthbound Farm

                                                                                         I 4 I
Q2 and H1 2019 performance by business
Sustainable profitable growth across portfolio

                                   Total    Essential Dairy   Specialized
                                                                            Waters
                                 Company    & Plant-based      Nutrition

                 Q2 net sales     €6.5 bn        €3.3 bn        €1.9 bn     €1.3 bn

          Like-for-like growth    +2.5%          +2.2%          +3.2%        +2.1%

                       Volume      -1.0%          -1.2%          -1.3%       -0.4%

                        Value     +3.5%          +3.4%          +4.4%        +2.5%

H1 Recurring operating margin     14.69%         9.41%          25.28%      12.87%

                   LFL Change    +68 bps         +58 bps       +55 bps      +110 bps

                                                                                       I 5 I
Q2 and H1 2019 highlights
Solid progress on growth and efficiency

        Like-for-like Sales Growth                              Recurring Operating Margin
  Rebound in Q2 confirming acceleration                   7th consecutive semester of improvement

              +2.5%                                                  14.69%
                 €6.5 bn                                                 +42 bps

             Accelerating                                               Maximizing
               Growth                                                   Efficiencies
                                          Recurring EPS

                                          +6.3%
                                             €1.87

                                                                                                    I 6 I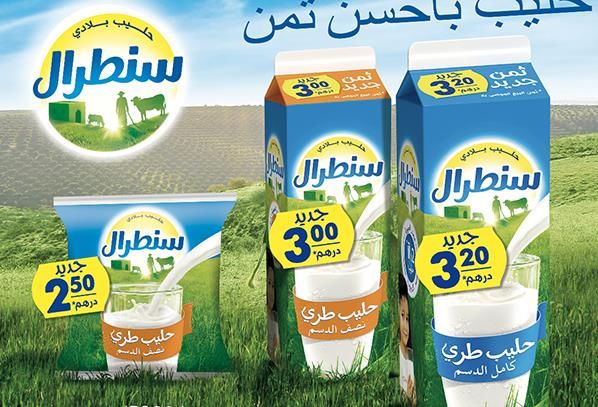
Q2 2019 sales bridge
    Improved volume trend and higher net sales/kg driving growth acceleration

                                              Reported growth +1.3%

                                                                           Like-for-like growth: +2.5%
                                                                                                         €6,496 m

             €6,414 m

                          -1.4%                                                               +3.5%
                                                       +0.3%

                                    -0.1%                                    -1.0%

                Q2 2018   Scope    Currency        Argentina organic         Volume             Value     Q2 2019
                                  and others(1)   contribution to growth

(1) Including IAS 29

                                                                                                                    I 7 I
H1 2019 key figures
Sales                              €3.7 bn

Like-for-like change                 +1.8%

Volume / Value                -1.1% / +2.9%

Recurring operating margin           25.3%

Like-for-like change               +55 bps

                                              I 8 I
Specialized Nutrition: +3.2% in Q2
 Early Life Nutrition back to growth

               Quarterly LFL sales growth(1)
                                                                       Advanced Medical Nutrition: mid-single digit growth

                                                                       ▪ Positive growth in Europe

                                                                       ▪ Double-digit growth in China
  +13.9%
              +10.3%
                                                             +3.2%     Early Life Nutrition: moderate growth
                                      +0.8%          +0.4%             ▪ Total China: slightly positive growth
                           -1.7%
                                                                            ▪ Category dynamics confirmed in H1
  Q1 2018 Q2 2018         Q3 2018     Q4 2018        Q1 2019 Q2 2019        ▪ Continued deployment in lower tier cities
                                                                            ▪ Increased weight of Direct sales

                                                                       ▪ Other geographies: solid growth

                                                                            ▪ Continued strong performance in rest of Asia
                                                                              and Americas
                                                                            ▪ Broad-based sequential improvement in domestic Europe

(1) Like-for-like sales growth excluding Argentina

                                                                                                                               I 9 I
ELN China acceleration
    Solid execution of growth plans

                Expansion into lower tier cities                 Accelerated investment for innovations
                     Mum&Baby Stores                              in Hong Kong and sourcing countries

                     Market                       Danone’s
                IMF China (offline)               presence

       Key
                              National and         ~85%
                  ~60%        Regional
        A/B                                        weighted
                              Key Accounts
       Cities                                     distribution

        C/D                   Independent          ~50%
       Town
                  ~40%        MBS                  weighted
                                                  distribution

Source: 2018 Nielsen offline data, Company data

                                                                                                          I 10 I
H1 2019 key figures
Sales €6.6 bn
Like-for-like change +1.2%
Volume / Value -2.5% / +3.7%
Recurring operating margin 9.4%
Like-for-like change +58 bps
I 11 IEssential Dairy & Plant-based: +2.2% in Q2
All regions growing; dairy stabilized, strong plant-based
Quarterly LFL sales growth(1) ▪ Europe: slightly positive growth
▪ France and Spain stabilization
▪ Alpro: double-digit growth
+2.2%
+1.5% ▪ North America: moderate growth
+0.8%
-0.4% +0.2% ▪ Yogurt: flat sales in a highly competitive environment
-1.3%
▪ Plant-based: solid growth despite impact
Q1 2018 Q2 2018 Q3 2018 Q4 2018 Q1 2019 Q2 2019 of Vega on-going recovery
▪ Coffee Creamers: strong performance
▪ Rest of the world
▪ CIS: flat sales, but strong results in kids and
indulgence segments
▪ Latam: growth in Mexico and Brazil
(1) Like-for-like sales growth excluding Argentina
I 12 IMorocco: growth around 10% in Q2, regained leadership
More than half of market share loss recovered
Unique consumer Milk portfolio
engagement process adaptation
Fresh Milk
Market Share
40 %
Accelerated Transparency
innovation in action
Competitor
1
20 %
Mar-18
Apr-18 Sep-18
Sep-18 Mar-19
Apr-19
Source: Nielsen, Company data
I 13 IH1 2019 key figures
Sales €2.4 bn
Like-for-like change +2.8%
Volume / Value +0.2% / +2.6%
Recurring operating margin 12.9%
Like-for-like change +110 bps
I 14 IWaters: +2.1% in Q2
13% recurring operating margin from valorization and efficiencies
Quarterly LFL sales growth(1)
Europe: slightly negative growth
▪ Weather conditions in May driving sharp category decrease
+6.9%
▪ Aquadrinks innovation continued strong performance
+4.9%
+3.9% +4.2% +3.9%
+2.1% Asia: solid growth
▪ Growth led by Indonesia
Q1 2018 Q2 2018 Q3 2018 Q4 2018 Q1 2019 Q2 2019
▪ Gaining market share in Turkey
▪ Reworking Mizone to adapt to fast-changing category dynamics
Latam: strong growth in Mexico, led by plain waters
(1) Like-for-like sales growth excluding Argentina
I 15 IStep-up of circular packaging
Concrete actions in H1 2019 to offer and promote sustainable packaging choices
Accelerated Wimbledon
launch “I recycle”
of new activation
sustainable
packaging
offerings
Offering
alternatives
beyond
single use
with evian
(re)new
I 16 IQ2 and H1 2019 highlights
Solid progress on growth and efficiency
Like-for-like Sales Growth Recurring Operating Margin
Rebound in Q2 confirming acceleration 7th consecutive semester of improvement
+2.5% 14.69%
€6.5 bn +42 bps
Accelerating Maximizing
Growth Efficiencies
Recurring EPS
+6.3%
€1.87
I 17 IProtein: on track to deliver 1 billion euros cumulative gross savings by 2020
From SG&A reduction to more efficient operations
Spare parts
3D printing
~€150m
gross savings delivery in H1
Truck fill rate with > 60% from operations
optimization
cross-categories
Confirming full-year 2019 target
In-house center of
expertise for advertising
content production
~€350m
I 18 IStrong improvement in recurring operating margin
Driven by increase in margin from operations
+42 bps
14.69%
+8 bps
+26 bps
14.27% +10 bps -9 bps
+34 bps
-27 bps
Like-for-like: +68 bps
H1 2018 Scope Currency Argentina organic Margin from Sales and Overheads H1 2019
Recurring and others(1) contribution to margin operations Marketing and others Recurring
(1) Including IAS 29
I 19 IQ2 and H1 2019 highlights
Solid progress on growth and efficiency
Like-for-like Sales Growth Recurring Operating Margin
Rebound in Q2 confirming acceleration 7th consecutive semester of improvement
+2.5% 14.69%
€6.5 bn +42 bps
Accelerating Maximizing
Growth Efficiencies
Recurring EPS
+6.3%
€1.87
I 20 IEPS bridge
Strong growth driven by operational performance
+6.3%
-0.0%
+4.3% -3.0%
€1.87
+0.2%
+4.8%
€1.76
H1 2018 Operational Financing Tax & Scope Currency H1 2019
Recurring EPS Performance others and others(1) Recurring EPS
(1) Including IAS 29 impact
I 21 IFrom recurring operating income to net income
Non-recurring costs from sale of Earthbound Farm and restructuring
H1 2018 H1 2019
in € millions
except if stated otherwise
Recurring Non-recurring Total Recurring Non recurring Total
Operating income 1,784 (695) 1,089 1,858 (314) 1,543
Net financial result (175) 3 (172) (183) 0 (182)
Income tax (475) 63 (412) (453) 126 (327)
Net income from associates 46 701 747 51 1 51
Net income 1,180 71 1,251 1,273 (187) 1,085
Non-controlling interests 48 (1) 47 52 (1) 51
Net income – Group share 1,132 72 1,204 1,221 (186) 1,035
EPS (€) 1.76 1.87 1.87 1.58
I 22 IOver €1bn free cash flow in H1 2019
Sustained cash delivery
Free cash flow (in € million) H1 2019 developments
▪ Strong NOPAT (1) delivery
1,104 1,083 ▪ Restructuring costs impact
921
731
545 ▪ Increased inventories
- Brexit risk management
H1 2015 H1 2016 H1 2017 H1 2018 H1 2019 - PET pre-buying opportunity
(1) Net Operating Profit After Tax
I 23 IChange in net debt
in € billion
€ +1.2 bn
+0.9
(1.1) 0.1 +1.3
13.9
12.7
Net debt FCF M&A Dividends Others Net debt
31/12/2018 Puts incl. IFRS16 30/06/2019
I 24 I2019 guidance confirmed; 2020 objectives reaffirmed
H2 priorities to drive growth and margin acceleration
Accelerate like-for-like sales growth
▪ Pursue dairy stabilization
1 ▪ Push plant-based expansion
2019 full-year guidance
▪ Accelerate presence in fast-growing channels
▪ Capture premiumization and China low-tier cities opportunity
LFL sales growth
Maximize efficiencies around 3%
2 ▪ Protein savings ramp-up and reinvestment in sales & marketing
▪ First results from organization adaptation
Recurring operating
margin above 15%
Allocate capital with discipline
3 ▪ Capex step-up: increased investments in plant-based and
innovation capacity increase
I 25 IOn track to accelerate the plant-based opportunity
Solid execution of our growth plans
Grow the core Expand Robust innovation pipeline
Battle for leadership into new territories Adjacencies, new brands
Q1 2019
Launch
Activia
Q3 2018 plant-based
in Europe
Q1 2019
Q1 2018
Boost
ready-to-drink
coffee
Q4 2018
Q2 2019
I 26 IDriving long-term transformation for a unique investment proposition
Lead the way to create and share sustainable value
I 27 IAppendix
I 28 IQ2 2019 sales by reporting entity and by geographical area
Essential Dairy Specialized
Waters Company
& Plant-based Nutrition
Europe and Noram
Sales €2,180m €764m €527m €3,471m
LFL growth +1.7% +0.8% -1.3% +1.1%
Rest of the world
Sales €1,103m €1,102m €819m €3,025m
LFL growth +3.2% +4.9% +4.5% +4.2%
Company
Sales €3,283m €1,866m €1,346m €6,496m
LFL growth +2.2% +3.2% +2.1% +2.5%
I 29 IQ2 & H1 2019 impact of currencies & scope
Q2 2019 Essential Dairy
Specialized Nutrition Waters Total
& Plant-based
Reported sales growth +0.8% +1.9% +1.6% +1.3%
Argentina organic
+0.4% +0.3% +0.0% +0.3%
contribution to growth
Currency and others(1) +0.7% -1.6% -0.6% -0.2%
IAS 29 impact +0.1% +0.0% +0.1% +0.1%
Scope -2.7% - - -1.4%
Like-for-like sales growth +2.2% +3.2% +2.1% +2.5%
H1 2019 Essential Dairy
Specialized Nutrition Waters Total
& Plant-based
Reported sales growth +0.7% +1.4% +2.2% +1.2%
Argentina organic
+0.3% +0.3% +0.1% +0.3%
contribution to growth
Currency and others(1) +0.4% -0.7% -0.9% -0.1%
IAS 29 impact +0.1% +0.0% +0.1% +0.1%
Scope -1.3% - - -0.7%
Like-for-like sales growth +1.2% +1.8% +2.8% +1.7%
(1) Excluding IAS29 impact
I 30 IChanges in exchange rates
% total H1 2019 H1 19 vs H1 18 (avg) Q2 19 vs Q2 18 (avg)
United States Dollar 20.6% 7.2% +6.1%
Chinese Renminbi 7.3% +0.5% -1.0%
Russian Ruble 6.4% -2.4% +2.0%
Indonesian Rupiah 5.7% +3.9% +3.8%
British Pound 5.1% +0.7% +0.1%
Mexican Peso 4.7% +6.6% +7.6%
Brazilian Real 2.8% -4.7% -2.6%
Polish Zloty 2.5% -1.7% -0.5%
Hong Kong Dollar 2.5% +7.1% +6.2%
Argentine Peso 2.1% -44.4% -43.7%
Canadian Dollar 1.8% +2.6% +2.3%
Turkish Lira 1.7% -21.9% -20.9%
Australian Dollar 1.7% -2.0% -2.0%
Moroccan Dirham 1.6% +3.7% +3.1%
I 31 IRecurring operating margin
H1 2018 H1 2019 Like-for-like change
Essential Dairy & Plant-based 9.00% 9.41% +58 bps
Specialized Nutrition 25.53% 25.28% +55 bps
Waters 11.45% 12.87% +110 bps
Europe & Noram 12.98% 13.75% +102 bps
Rest of the world 15.80% 15.79% +15 bps
Total 14.27% 14.69% +68 bps
I 32 ICash bridge
in € million
(327)
668
(182) 130
398
359 8
1,833
1,543
1,083
Operating Depreciation/ Taxes Financial Others Cash from Working Capex Sale of Free
income Amort results operating capital assets and cash-flow
activities(1) variation transaction Reported
Fees
(1) Excluding working capital variations
I 33 IBalance sheet
Assets(1) Liabilities
in € million 31/12/18 30/06/19 31/12/18 30/06/19
16,353 Shareholders’ equity
16,475
24,598
Intangible assets 24,445
13,920 Net debt(2)
12,744
10,225
Other assets 9,331 Other liabilities
3,395 3,685
Working capital 5,256 6,102 6,418 6,967 Working capital
39,032 40,925 39,032 40,925
(1) Excluding assets included in net debt
(2) Net of cash, cash equivalents, marketable securities, other short-term investments and financial instrument asset
I 34 IYou can also read