Company Presentation March 2019 - Investor Relations | YY Inc.

 
CONTINUE READING
Company Presentation March 2019 - Investor Relations | YY Inc.
Company Presentation
March 2019
Company Presentation March 2019 - Investor Relations | YY Inc.
Disclaimer

This presentation contains forward-looking statements. These statements are made under the “safe harbor”
provisions of the U.S. Private Securities Litigation Reform Act of 1995. These forward-looking statements can be
identified by terminology such as “will,” “expect,” “anticipate,” “future,” “intend,” “plan,” “believe,”
“estimate” and similar statements. Among other things, the business outlook and quotations from management
in this presentation, as well as YY's strategic and operational plans, contain forward-looking statements. YY
may also make written or oral forward-looking statements in its periodic reports to the U.S. Securities and
Exchange Commission (“SEC”), in its annual report to shareholders, in press releases and other written
materials and in oral statements made by its officers, directors or employees to third parties. Statements that
are not historical facts, including statements about YY's beliefs and expectations, are forward-looking
statements. Forward-looking statements involve inherent risks and uncertainties. A number of factors could
cause actual results to differ materially from those contained in any forward-looking statement, including but
not limited to the following: YY's goals and strategies; YY's future business development, results of operations
and financial condition; the expected growth of the online communication social platform market in China; the
expectation regarding the rate at which to gain registered user accounts, active users, especially paying users;
YY's ability to monetize the user base; YY's ability to continue attracting advertisers and offering popular online
games; fluctuations in general economic and business conditions in China and assumptions underlying or related
to any of the foregoing.

Further information regarding these and other risks is included in YY's filings with the SEC. All information
provided in this presentation is as of the date of this presentation, and YY does not undertake any obligation to
update any forward-looking statement, except as required under applicable law.

                                                                                                                      1
Company Presentation March 2019 - Investor Relations | YY Inc.
Company Overview

                   2
Company Presentation March 2019 - Investor Relations | YY Inc.
Our vision

       We aspire to enrich people's lives through our next-generation
video-based social media platform focused on live streaming content globally

Short-form video

                                                                               3
Company Presentation March 2019 - Investor Relations | YY Inc.
Next-generation global video-based social media platform

                                                               Social Interaction
                                                                Live Interaction
                                                                Gamification
                                                                Enriched social activities and
                                                                 user scenarios
                                                                     Social games
                                                                     Multi-person live
                               Entertainment                          interactive activities
                               Live Streaming
                                                               Media Content
       Casual games                             Game            Video based
       Social Network
                                                broadcasting    Diversified content
                                                                 categories
                                                                Live steaming & short
                                                                 video become
     Short-form         Overseas Live                            mainstream format
     video              Streaming

                                                                                               4
Company Presentation March 2019 - Investor Relations | YY Inc.
Leading live streaming social media platform worldwide

                      No. 1 Live Streaming                                                                                      Rapid Overseas Expansion
                      Social Media Platform
                             in China

 No. 1 MAU1                        No. 1 DAU1 No. 1 Total Time Spent1

                                                                                                                                            MAU: 69.0mm in 4Q18

                 Large and Rapidly Growing User Base

                                                                                                                                             MAU :20.9mm in 4Q18
                                  90.4 mm
    Average mobile MAU in 4Q18, +18.1% in 4Q18 vs. 4Q17²
                                                                                                                                                          …
 Note:
 (1) YY is the no. 1 live streaming social media platform in China as ranked by QuestMobile based on monthly and daily active user, as well as total time spent data of
       users that directly accessed the platforms of the relevant industry players, in December 2018.
 (2) Company data.                                                                                                                                                        5
Company Presentation March 2019 - Investor Relations | YY Inc.
Bigo: The forefront of global expansion

                           Leadership in key SEA & Middle East Markets

           YY recently completed the acquisition of Bigo in March 2019
           Total MAU 1 reached 69.3mm in Q418,compared to 40.0mm in 1H18
           Impressive growth in 2018 with a clear path of profitability

        Leading global live streaming platform            Short form video social platform
                   excluding China                                  worldwide
  Note: (1) &(2) Company data
                                                                                             6
Company Presentation March 2019 - Investor Relations | YY Inc.
Significant Synergies between YY and Bigo

      To Better Leverage Global Opportunities through Full Integration

                     With rich industry-leading experience in live streaming, YY
                     could leverage its accumulated knowhow to help with Bigo’s
                     user acquisition and monetization

                     Bigo’s established global footprint with strong presence in
               2     emerging markets could help accelerate the Group’s global
                     expansion

               3     Bigo + YY’s AI algorithm and machine learning capabilities
                     to boost the Group’s AI efficiency

               4     YY Group will be positioned as the leading live streaming and
                     short-video platform globally

                                                                                     47
Company Presentation March 2019 - Investor Relations | YY Inc.
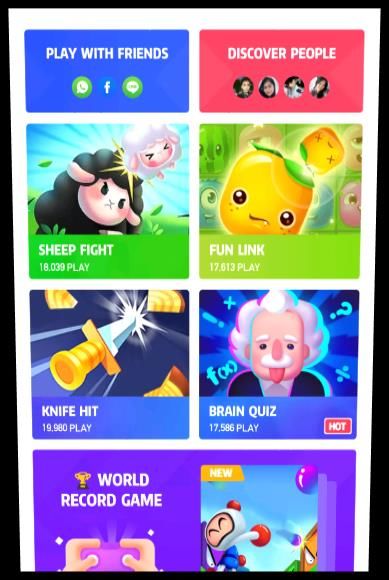
HAGO: Initial global expansion has generated
encouraging results in 2018

                                         A Casual-Game-Oriented Social Networking Platform

             Focused on Southeast Asia market currently
             MAU1 has reached 20.9mm with average daily time spent2 more than 60 mins in 4Q18
             Consistently topped the charts as the most popular application on both App Store and Google
             Play in its primary markets, namely Indonesia and Vietnam in 4Q18

                                                    Chance to
                                                     socialize

                                        Engaging
                                        gameplay

 Notes:
(1) &(2) in Q418                                                                                           8
Company Presentation March 2019 - Investor Relations | YY Inc.
Huya: A phenomenal growth story in game live streaming

                                                                                                    Rapid Net Revenue Growth
            Successful IPO in NYSE in May 2018 (NYSE:HUYA)                                         and Stable Margin Expansion

                                                                                           4Q18 vs. 4Q17          4Q18 vs. 4Q17 non-gaap
                                                                                          revenue growth          net income attribute to
                                                                                              + 103%                    Huya growth
                                                             VIRTUAL GIFTS                                                +487%
                                                                                1800.00
                                                                                                                                 1,669

                                                                                1600.00                  1,505
                                                           NOBLE SUBSCRIPTION
                                                                                1400.00

                                                                                1200.00

                                                             ADVERTISEMENT      1000.00

                                                                                 800.00      741

                                                                                 600.00
                                                                E-Sports
                                                                                 400.00                               284

                                                                                 200.00

                                                                                   0.00
                                                                                             4Q2017      4Q2018    4Q2017     4Q2018

Source: Company data disclosed in 4Q18 earnings release.                                                                                 9
Business Highlights

                      10
YY’s strengths

 1    Leading video-based social media platform worldwide

        2        Comprehensive, interactive and organic content and activities

             3      Vibrant ecosystem of performers, guilds and users

         4        Proprietary and scalable technology infrastructure

 5      Visionary management team with proven track record

                                                                                 11
Leading video based social media platform worldwide

                                                      12
Comprehensive, interactive and organic content and
activities

                      Wide range of popular contents
                              and activities

  Follow   Discover        Share        Comment        Tipping   Dedicate songs

                       Interactive social features
                                                                                  13
New ways of attracting users

       Promoting hosts and acquiring                       Additional growth via
 3
 1                                                     2
       external traffic from short-form                    strategic partnerships
       video platform to YY Live

                                                                                    …
Short-form video platform   Modern Brother’ showroom          Xiaomi Broadcasting
                            on YY Live

                                                                                        14
Vibrant ecosystem of performers, guilds and users

                                     Users

                       Quality and interest-based content
                             only a few swipes away

    Showcase their talent                                   Promote stardom for
     on a platform with                                     performers managed
    minimal entry barrier                                         by guilds

          LIVE              Discovering, nurturing
                            and managing talents
      Performers                                                      Guilds

                                                                                  15
Proprietary and advanced technological capabilities

                                                  LIVE

Advance our video technological               Application
AI-based applications
capabilities                                    of A.I. &
                                               Machine
                                               Learning

                                            big data analytics
Personalized recommendation &
                                          data acquisition
content screening monitoring
                                             data processing
and management
                                                 data analysis

Support high quality video        live streaming related audio & video
communications                    technology improvement

                                                                         16
Enhancing AI capabilities on all fronts

    Content Creation                                 Content
  3                                         3    Recommendation
    & Understanding

Applying AI related computer              Strengthening machine
vision and voice technologies             learning and algorithm
to enhance the content                    capabilities in managing and
creation and understanding                distributing personalized
                                          content

          Automated                               AI-driven Tech
  3                                         3
        Product Testing                         Team Management
Establishing a AI driven process          Adopting a tech-centric approach
to review hundreds of different           where the tech team determines
versions of APPs and through AI           the workflow of each business
based A/B testing to achieve              unit and the labor force
the optimization of distribution          allocation

                                                                             17
Visionary management team with proven track record

     David
   Xueling Li        Bing Jin    VV Ting Li   Jeff Pengjun Lu
   Co-founder /        CFO          COO            CTO
 Chairman / Acting
       CEO

                                                                18
YY’s strategies for growth

3
1   Continue to focus on global expansion

3
2   Strengthen and develop AI capabilities

3   Attract new users through new product development and strategic
    partnerships

3
4   Continue to explore short-form video opportunity globally

3
5   Enhance marketing efforts to promote new products globally

3
6   Pursue acquisition/investment opportunities

                                                                      19
Financial Highlights

                       20
Financial highlights

        Massive
    1   and
        Growing
                         2   Healthy
                             Gross Margin
                             Contribution
        Revenue

                                             $$
                                              $
        Investment           Proven
    3   R&D and S&M
        Initiatives to
                         4   Profitability
                             & Cash
        Support Growth       Generation

                                                  21
Massive and growing revenue

                                               Total Net Revenue
RMBmm
                                                        15,764
                           39%
                       2016-18 CAGR

                                      11,595                                   28%
                                                                            YoY Growth

                  8,204

                                                                                         4,641
                                                                   3,627

                  2016                 2017             2018       4Q2017                4Q2018

excluding Bigo business unit
                                                                                                  22
Live streaming revenue growth drivers

                                                                                      Massive User Base
                                                                                       YY Live + Huya
                                                                                                90.4mm
                                                                                                Average Mobile MAU1
                                                                                                in 4Q18

                                                                                                8.9mm
                                                                                                Live Streaming Paying
                                                                                                Users1 in 4Q18

                                                                                                                 $
                                                                                                          $
                                                                                                    $
             Fast Growing                                                         $         $
                                                                                                                         Monetization Initiatives
        Bigo and Huya Business
                                                                                                                        Noble Subscription Happy Contest

                              103%
   Robust YoY                 YoY Net Revenue
   revenue growth             Growth (4Q18 vs.
   in 2018                    4Q17)

Note:1.Source from Company data disclosed in 4Q18 earnings release(excluding Bigo business unit).
                                                                                                                                                           23
Healthy gross margin

             Revenue Sharing Fees and Content Costs                               Bandwidth Cost

RMBmm                                                         58%      RMBmm
                                  56%          54%
                      54%
                                 8,273
                                                                                                 967
      54%

                                                                        8%
                                                                                    696
                       5,727                                                                              5%           5%
                                                                                   6%
                                                                        652                     6%
                                                                                    696

     3,791

                                                             2,557
                                                                                                                       246
                                              1,828
                                                                                                           181

      2016             2017      2018         4Q2017        4Q2018      2016       2017        2018      4Q2017       4Q2018
      Revenue Sharing Fees and                                                      Bandwidth Cost     % of Revenue
                                         % of Live Streaming Revenue
      Content Costs

      Mutually beneficial and sustainable revenue sharing              Bandwidth cost as % of revenue increased as a result of
       structure with content providers, with additional                 increased user base on both YY and Huya’s platform
       content production cost to promote hosts                          and live streaming quality improvements
excluding Bigo business unit                                                                                                       24
Investment R&D and S&M Initiatives to Support Growth

          Research and Development Expenses                                                                             Sales and Marketing Expenses

RMBmm                                                                                              RMBmm
    7%               6%                 6%                                 6%
                                                        5%
                                                                                                                                            7%
                                       967
   596              660                                                                                                                                                     7%
                                                                                                                                          1,144
                                                                          282                                             6%
                                                         176
                                                                                                          5%
   2016            2017          2018                 4Q2017       4Q2018
              Research and Development                  % of Revenue                                                                                       4%
                                                                                                                           687
   Increased R&D related to A.I. technical team expansion

                                                                                                          384
          General and Administrative Expenses                                                                                                                               323

RMBmm
                                                                                                                                                            145
     4%               4%                3%               4%                4%

                                        540
                      413                                                                                2016             2017             2018           4Q2017       4Q2018
    343
                                                                                                                            Sales and Marketing              % of Revenue
                                                         155               171

                                                                                                        Strategically focus on sales and marketing to
                                                                                                         promote our new initiatives and further strengthen
   2016            2017           2018                 4Q2017       4Q2018
               General and Administrative                % of Revenue
                                                                                                         our brand globally

   Controlled cost due to improved operational                                                         Increased S&M efforts and capabilities in user
    efficiency                                                                                           acquisition
   Note: Research and Development Expenses、Sales and Marketing Expenses and General and Administrative Expense refer to Operating expenses excluding share-based                  25
   compensation expenses, impairment of goodwill and investments and gain on deconsolidation and disposal of a subsidiary.(excluding Bigo business unit)
Proven profitability and cash generation

                                                                          Proven Profitability
RMBmm                     38%
                      2016-18 CAGR
                                                                                         3,196
                                                2,699

         1,667
                                                                                                                                   26%
     20%                                                                                                                                                               18%
                                                   23%
                                                                                         20%                                      932
                                                                                                                                                                         836

          2016                                   2017                                    2018                                  4Q2017                                 4Q2018
                                       Net income attributable to YY Inc.                                            Non-GAAP Net Margin (%)

                                                                   Strong Operating Cash Flow

 RMBmm                                                  36%
                                                    2016-18 CAGR
                                                                                                                            4,465
                                                                                   3,718

                                           2,421

                                            2016                                    2017                                    2018
         Note: Non-GAAP net income attributable to YY Inc. excluding share-based compensation expenses, impairment of goodwill and investment, gain on deconsolidation and
         disposal of subsidiary, gain on deemed disposal and disposal of investments (deemed disposal refers to dilution of equity int erest in equity-method investments), gain on fair
         value change of investments and equity investees’ investments, fair value loss on derivative liabilities, deemed dividend to subsidiary’s Series A preferred shareholders,
         income tax effects on non-GAAP adjustment and non-GAAP adjustment for net (loss) income attributable to non-controlling interests shareholders. (excluding Bigo business
         unit)                                                                                                                                                                             26
Reconciliation of GAAP and Non-GAAP results

                                                                      For the Year Ended          For the Three Months Ended
                                                                            Dec 31                          Dec 31
(in RMB mm)                                                            2017         2018             4Q2017       4Q2018
Operating income                                                        2,699.2       2639.7              821.5        718.6
Impairment of goodwill and investments                                     45.7            35.3             4.1         15.1
Gain on deconsolidation and disposal of a subsidiary                     (38.0)               -                -           -
Share-based compensation expenses                                         257.7        648.0              208.5        154.8
Non-GAAP operating income                                              2,964.6      3,323.1            1,034.1        888.5
Net income attributable to YY Inc.                                      2,493.2      1,642.0              740.4        684.0
Share-based compensation expenses                                         257.7        648.0              208.5        154.8
Impairment of goodwill and investments                                     45.7            35.3             4.1         15.1
Gain on deconsolidation and disposal of a subsidiary                     (38.0)               -                -           -
Gain on fair value change of investments and equity investee's
                                                                         (20.6)     (1,711.5)            (20.6)        (1.1)
investments

Gain on deemed disposal and disposal of investments                      (45.9)        (16.2)                  -       (2.2)

Fair value loss on derivative liabilities                                     -      2,285.2                   -           -

Deemed dividend to subsidiary's Series A Preferred Shareholders               -        489.3                   -           -
Income tax effects on non-GAAP adjustments                                  9.3            97.6                -        21.5
Non-GAAP adjustments for net income (loss) attributable to the non-
                                                                          (2.0)      (273.4)             (0.4) -      (35.8)
controlling interest shareholders
Non-GAAP net income attributable to YY Inc.                            2,699.4      3,196.4              932.1        836.2

                                                                                                                               27
Thanks

  Investor Relations Contact:

  IR Team
  Matthew Zhao, Maggie Yan
  Tel: +86 (20) 8212-0000
  Email: IR@YY.com

  ICR, Inc.
  Jack Wang
  Tel: (+1) 646 915-1611

                                28
You can also read