REINVENTING the future of cleaning - TENNANT COMPANY - INTELLISIGHT PRESENTATION
←
→
Page content transcription
If your browser does not render page correctly, please read the page content below
REINVENTING
  the future of cleaning.

TENNANT COMPANY – INTELLISIGHT PRESENTATION
Chris Killingstad – President and CEO
Tom Paulson – Senior VP and CFO
August 2017

                                  TENNANTCO.COM
This presentation contains certain statements that are considered “forward-looking

    Safe Harbor   statements” within the meaning of the Private Securities Litigation Reform Act of 1995.
                  Forward-looking statements generally can be identified by the use of forward-looking

    Statement
                  terminology such as “may,” “will,” “expect,” “intend,” “estimate,” “anticipate,” “believe,”
                  “project,” or “continue” or similar words or the negative thereof. These statements do not
                  relate to strictly historical or current facts and provide current expectations of forecasts of
                  future events. Any such expectations or forecasts of future events are subject to a variety of
                  factors. We caution that forward-looking statements must be considered carefully and that
                  actual results may differ in material ways due to risks and uncertainties both known and
                  unknown. Information about factors that could materially affect our results can be found in
                  Part I, Item 1A, Risk Factors in our Annual Report on Form 10-K for the year ended
                  December 31, 2016, and in Part II, Item 1A Risk Factors in our most recent quarterly report
                  on Form 10-Q. Shareholders and potential investors are urged to consider these factors in
                  evaluating forward-looking statements and are cautioned not to place undue reliance on such
                  forward-looking statements.

                  We undertake no obligation to update or revise any forward-looking statement, whether as a
                  result of new information, future events or otherwise. Investors are advised to consult any
                  further disclosures by us in our filings with the Securities and Exchange Commission and in
                  other written statements on related subjects. It is not possible to anticipate or foresee all risk
                  factors, and investors should not consider any list of such factors to be an exhaustive or
                  complete list of all risks or uncertainties.

2
About                                      72                 45
    Tennant Company                           consecutive years   consecutive years of   Balance sheet
                                              of cash dividends   increase in annual
    Tennant Company, a Minnesota                                  cash dividend payout
    corporation founded in 1870 and
    incorporated in 1909, is a world leader
    in designing, manufacturing and
    marketing solutions that empower                                                       2016 Revenues:
    customers to achieve quality cleaning
    performance, significantly reduce
                                                                                           $809M
    environmental impact and help create                                                   2016 Employees:
    a cleaner, safer, healthier world.
                                                                                           3,236

                                              NYSE Symbol:
                                              TNC
3
OUR VISION

                 We will lead our global industry in
                 sustainable cleaning innovation that
                 empowers our customers to create a
                 cleaner, safer and healthier world.

4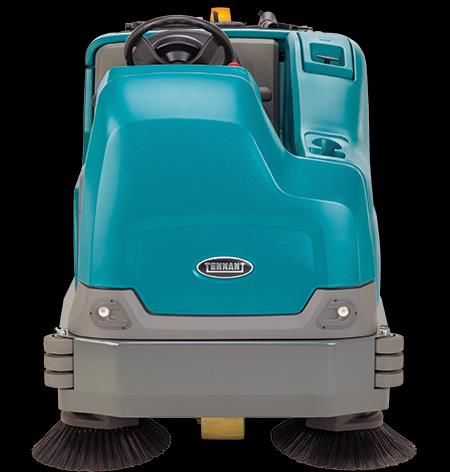
Competitive Landscape
    2015 $5B Global Cleaning Equipment Market*
                  Tennant | Nobles |             18%
                  Alfa | Orbio

                  Nilfisk | Advance |
                  Clarke | Viper
                                          17%              42%
                                                           of the market
                  Karcher | Windsor |                      consists of
                  TecServ | ProChem                        others with a
                                                           market share
                                                           of 3% or less.

                  Hako | Minuteman |       11%                              * Estimated market size in
                                                                              “constant currency” U.S. dollars
                  PowerBoss                                                   for Tennant-like equipment

                                                 9%
                                                                              categories and aftermarket.

                                                      3%
                  Taski

5
6
    COMMERCIAL

    INDUSTRIAL

    ESSENTIALS

    ORBIO®
    TECHNOLOGIES
                   Broad Portfolio of Quality Products

    COATINGS

    AFTERMARKET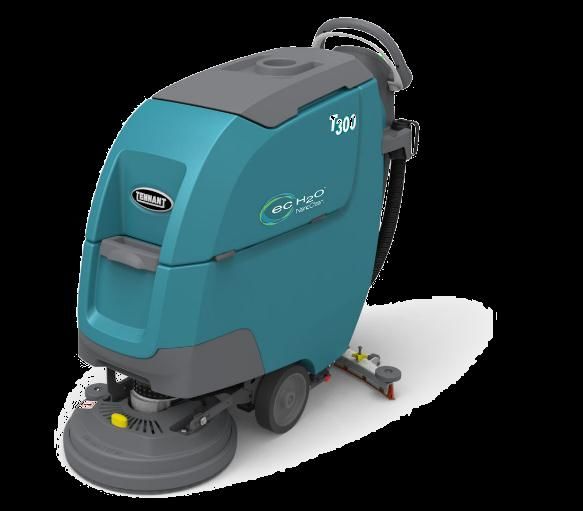
STRONG DIRECT SALES
     Strong  Direct Sales  &  Service
          & SERVICE ORGANIZATIONS
                                                                                          Organizations
    Global Revenue by Sales Channel                     Global Sales Employees                  Global Direct Service Employees
                                                  600                                           900
                                                                                                800
                                                  500
                                                                                                700
     Direct                                       400                                           600
                75%                                                                             500
                                                  300
                                                                                                400
                                                  200                                           300
                                                                                                200
                                                  100
                                                                                                100

                             25%                   0
                                                         2012   2013       2014   2015   2016
                                                                                                  0
                                                                                                        2012   2013       2014   2015   2016
                                   Distribution                 Americas   EMEA   APAC                         Americas   EMEA   APAC

              Distribution Partners                     Global Strategic Accounts                        Factory-Service Direct
              More than 80 countries                     Cross-functional teams &                     Locally based & factory-trained
                around the world                            market specialists                              service technicians

7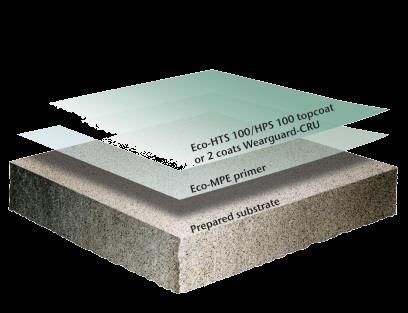
Broad Range of Global Customers
    MARKETS

8
                                      8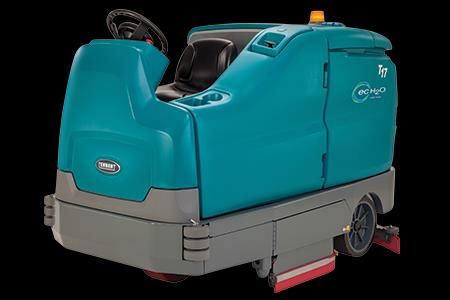
2016 Revenue of $809M
                                                   61%               *Equipment Mix
                                                  Equipment*         Commercial | 52%
                               EMEA                                  Industrial | 46%
                                                                     Outdoor | 2%
                               16%
                Net Sales by                 Net Sales by
                Geography        APAC       Product Group
     Americas                    9%                                         4%
      75%                                                                   Coatings
                                        Service
                                        & Other        Parts &
                                                               21%
                                           14%         Consumables

9
                                                                                9
Growth Strategy
     We remain committed to
     Sales goal of $1 Billion and
     12% or above Operating Profit Margin
       • Reach new markets and new customers
       • Deliver a strong product & technology pipeline
       • Build Tennant’s e-Business capabilities
       • Be disciplined about improving margins &
         controlling expenses
10
2016 Third Quarter Acquisitions
• Acquired Florock® Brand
• Expanded our commercial floor coatings business
• Combination of Tennant Coatings and Florock opens new markets
and strengthens value proposition
• Acquired Assets of Dofesa Barrido Mecanizado
• Long-time distributor of Tennant equipment in central Mexico
• Acquisition is a key investment for growth in Latin America
• Enhances Tennant’s sales and service capabilities
112017 Second Quarter Acquisition of IPC Group
• Closed April 6, 2017
• All-cash transaction $353M or €330M
• IPC Group – privately held designer and manufacturer of innovative
professional cleaning equipment, tools and other solutions, based in Italy
• IPC Group 2016 annual sales of $206M or €186M
• Largest Acquisition in Tennant Company History
• IPC acquisition results in annualized sales of over $1 Billion
• Anticipate acquisition will be accretive to 2018 full year earnings per share
• Post-Acquisition Integration Underway
• IPC achieved organic sales growth of 8% in 2017 Second Quarter
12IPC Group Overview
2016A Revenue Mix
Key Facts and Figures
IPC Group produces machines and equipment for the professional cleaning sector
Revenue by Geography
—Cleaning machines: floor sweepers and scrubbers, vacuum cleaners, high- pressure
RoW
washers and related aftermarket parts and services
9%
—Cleaning tools and supplies: trolleys, window cleaning tools and consumables Americas
11%
2016A Revenue: €186mm EMEA
80%
2016A Adjusted EBITDA: €26mm (~14% margin)
5 manufacturing plants; 11 international branches with sales to over 100 countries
~1,000 Employees 2016A Revenue by Product
Geographic Coverage High Pressure
18%
Eagle Soteco Benelux Foma Norge Sweepers & Scrubbers
Eagan, Minnesota Wommelgem Langhus 42%
Cleaning Tools and
Gansow Supplies
Unna 19%
Vacuum Cleaners
21%
2016A Revenue by Type
ICA Tools and Supplies
Épône Cedex China Trade Corporation 19%
Fo Shan, Guangdong
Machinery
Industria e Comercio
Machinery Aftermarket 59%
Pinhais Parana
22%
Cleaning España Western Floor PVT
Barcelona New Delhi
13IPC’s Diverse Product Portfolio
% of Net Sales Overlap with
by Equipment Existing TNC
Product Type Product Description Products1
Ride On Walk Behind Scrubbers: 15L to 230L (tank size)
Sweepers
Scrubber Scrubber Sweepers: 460mm to 1,200mm (brush size)
and 42%
Scrubbers Multiple Power Systems: Electric cables,
Sweeper Sweeper
batteries, diesel, petrol and hybrid
Dry Wet & Dry Industrial Dry Vacuum Cleaners: 750W to 1,400W
Vacuum Wet & Dry Vacuum Cleaners: 1,300W to
21% 3,600W
Cleaners
Single motor to three motor models
Mops and Small surface, window cleaning and room
Trolleys Equipment Cloths cleaning
Tools 19% Continuous need for supply of related
Surface consumables
Carts for Window and mirror and floor
manual tools surface cleaning cleaning
Hot Water Cold Water Range of 2.5HP to 13HP
— Diesel versions up to 900 liters per hour
Pressure
18% — Gasoline versions up to 1,260 liters per hour
Washers
Hydro-cleaners with Hydro-cleaners
high temperature with cold
water jets and internal water jets
heaters
¹ Shaded area represents approximate level of overlap with existing
Tennant products
14IPC Synergy Opportunities
• Incremental Sales
• Complementary sales channels
• Cross-selling to reach new customers with both brands: Tennant and IPC
• $10M Run-Rate Cost Synergies by 2019
• Sourcing savings with greater volume to fewer vendors
• Improving sales and service capabilities
• Leveraging greater scale to improve operating efficiencies
• $10M Costs Necessary to Achieve Synergies
• $6M in capital expenditures; $4M in redundancy costs
15FINANCIAL
Summary
Reinventing the future of cleaning.
162017 SECOND QUARTER
Organic Sales Decline 2.3% | Organic Sales up 3.1% in APAC
Q2’17 Q2’16 CHANGE
SALES $270.8 M $216.8 M +24.9%
Adjusted* GROSS MARGIN 40.9% 43.9% (300 bps)
R&D EXPENSE (% of sales) 2.9% 3.9% (100 bps)
Adjusted*
S&A EXPENSE (% of sales) 30.5% 29.6% +90 bps
Adjusted*
OPERATING PROFIT $20.2 M $22.6 M (10.3%)
Adjusted*
OPERATING PROFIT MARGIN 7.5% 10.4% (290 bps)
Adjusted*
EPS $0.60 $0.85 (29.4%)
*Q2’17 results are adjusted to exclude inventory step-up of $6.2M pre-tax ($0.25 per share) in Gross Margin and IPC acquisition costs and pension charge
of $4.9M pre-tax ($0.28 per share) in S&A Expense. EPS also excludes financing costs related to IPC acquisition of $6.2M pre-tax ($0.22 per share).
172017 FIRST HALF EBITDA
Adjusted Earnings Before Interest, Taxes, Depreciation & Amortization up 11%
1H ‘17 1H ‘16 CHANGE
SALES $461.9 M $396.7 M +16.4%
Adjusted* OPERATING PROFIT $28.5 M $29.7 M ($1.2 M)
Adjusted* NON-INTEREST OTHER EXPENSE ($0.5 M) ($0.03 M) ($0.47 M)
Exclude DEPRECIATION $11.0 M $8.6 M +$2.4 M
Exclude AMORTIZATION $3.8 M $0.2 M +$3.6 M
Adjusted* EBITDA $42.8 M $38.5 M +11.1%
Adjusted* EBITDA (% of Sales) 9.3% 9.7% (40 bps)
*1H ‘17 results are adjusted to exclude inventory step-up of $6.2M pre-tax ($0.25 per share) in Gross Margin and Restructuring Charge, IPC acquisition costs and
pension charge of $15.8M pre-tax ($0.77 per share) in S&A Expense. Also excludes financing costs related to IPC acquisition of $7.4M pre-tax ($0.26 per share).
181.0% Organic Sales Growth in 2017 First Half
Americas EMEA APAC
1H17 Organic Sales 1H17 Organic Sales 1H17 Organic Sales
0.4% 4.3% (0.5%)
19First Quarter 2017 Restructuring
• To support key strategic growth initiatives and reduce costs to
accelerate our ability to reach our 12% operating profit margin goal
• Approximate 3% net reduction in global workforce
• Restructuring charge of $8M pre-tax, or $0.32 per diluted share
• Savings anticipated to be $7M in 2017 and a total of $10M in 2018
• Savings predominantly personnel costs
20Debt as of June 30, 2017
• $411 million of Debt comprised of:
• $300 million Senior Unsecured Notes
• $ 98 million outstanding of a $100 million Term Loan
• $ 20 million outstanding under Revolving Credit Facility
• An offsetting $7 million of debt issuance costs yet to be amortized
• 4.2% Overall Weighted Average Cost of Debt
21History of Sales Growth
2010-2016 Average Organic Sales Growth of 6%
22
222017 EPS & Sales Guidance
2016 ACTUAL As Reported $2.59 EPS $808.6M SALES
2017 Financial Outlook
As Adjusted and “Constant Currency” $2.30 to $2.50
As Reported $0.85 to $1.05/$960M to $990M
KEY EXPECTATIONS FOR 2017 (includes the impact of the April 2017 IPC Group acquisition)
• Net sales in the range of $960M to $990M versus $808.6M in 2016.
• Stable economy in North America, modest improvement in Europe, and challenging environment in APAC.
• Unfavorable foreign currency impact on sales of approximately 1%.
• Sales increase from acquisitions: 2016 Florock of approximately 0.8%; 2017 IPC range of 18.6% to 20.4%.
• Organic sales growth, excluding foreign currency exchange impact and acquisitions, in the range of 1% to 3%.
• Adjustments of $31.4M pre-tax, or $1.36 per share, non-recurring special items: $8.0M Restructuring Charge,
$7.6M IPC acquisition costs, $7.4M IPC related financing costs, $8.2M IPC acquisition inventory step-up, $0.2M
pension plan settlement charge.
• Foreign currency exchange headwinds estimated to negatively impact operating profit by approximately $2.5M,
or approximately $0.10 EPS.
• Gross margin performance in the range of 41% to 42%.
• R&D expense in the range of 3% to 4% of sales.
• Effective tax rate of approximately 29%.
• Capital expenditures in the range of $25M to $30M.
23You can also read