Investor Relations Update - As of October 30, 2019

Page created by Randy Webster
 
CONTINUE READING
Investor Relations Update - As of October 30, 2019
Investor Relations Update
        As of October 30, 2019
Investor Relations Update - As of October 30, 2019
Safe Harbor Statement
Except for historical information contained herein, the matters set forth in this presentation contain forward-
looking statements, including industry market projections; our revenue growth opportunities; our ability to
grow revenue by expanding content and share in smartphones and expanding our SAM with new
applications and technologies; our expectations with respect to expanding content with new and existing
customers in FY20 and extending our market leadership in audio, voice, and beyond; our forecasted revenue,
gross margin and R&D and SG&A expenses; and our estimate for our FY20 and future years’ effective tax rate.
These forward-looking statements are based on our current expectations, estimates and assumptions and
are subject to certain risks and uncertainties that could cause actual results to differ materially from our
current expectations, estimates and assumptions and the forward-looking statements made in this
presentation. These risks and uncertainties include, but are not limited to, the risk factors listed in our Form
10-K for the year ended March 30, 2019 and in other filings with the Securities and Exchange Commission.
The foregoing information concerning our business outlook represents our outlook as of the date of this
presentation, and we undertake no obligation to update or revise any forward-looking statements, whether
as a result of new developments or otherwise.

                                                                                                                   2
Investor Relations Update - As of October 30, 2019
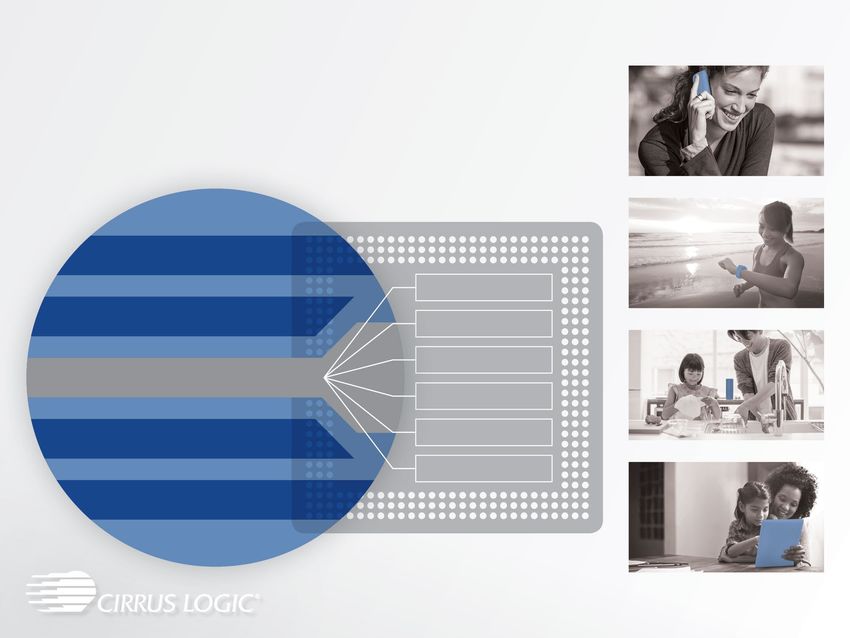
Cirrus Logic at a Glance

           PROFILE                            PRODUCTS                             CORE STRENGTHS

                                                                                  Analog and digital signal
        Founded in 1984            Smart codecs and voice processors
                                                                                        processing

    Listed on NASDAQ: CRUS                   Audio amplifiers                      Engineering execution

                                                                                World-class customer support
       FY19 revenue: $1.2B                    Haptic drivers
                                                                                 and application expertise

  Headquarters in Austin, Texas            MEMS microphones                 Supply chain management and quality

   ~1,470 employees worldwide     Product applications: flagship/mid-tier      Extensive IP portfolio (over 3,370
                                     smartphones, automotive, smart         pending and issued patents worldwide)
                                   accessories/wearables & smart home

                                                                                                                    3
Investor Relations Update - As of October 30, 2019
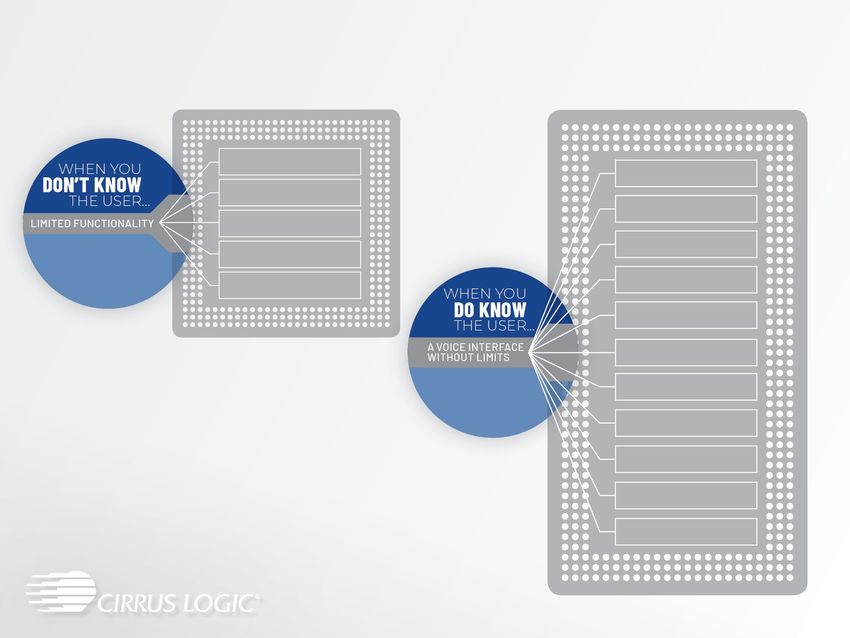
Proven Operating Model

                      Leverage
                   best-in-class IP
                                                                SOLID OPERATING
  Expand with                                                       MARGINS
 more content &                           Target
 more products                         fast-growing
                                         markets
                                                           STRONG CASH FLOW
     Design
  best-in-class
    custom,
 semi-custom &                        Engage tier-one   LEADING SUPPLIER OF
 general market                       market leaders     COMPLETE AUDIO &
    products                                             VOICE SIGNAL CHAIN
                     Develop
                   meaningful
                   engineering
                  relationships

                                                                                  4
Investor Relations Update - As of October 30, 2019
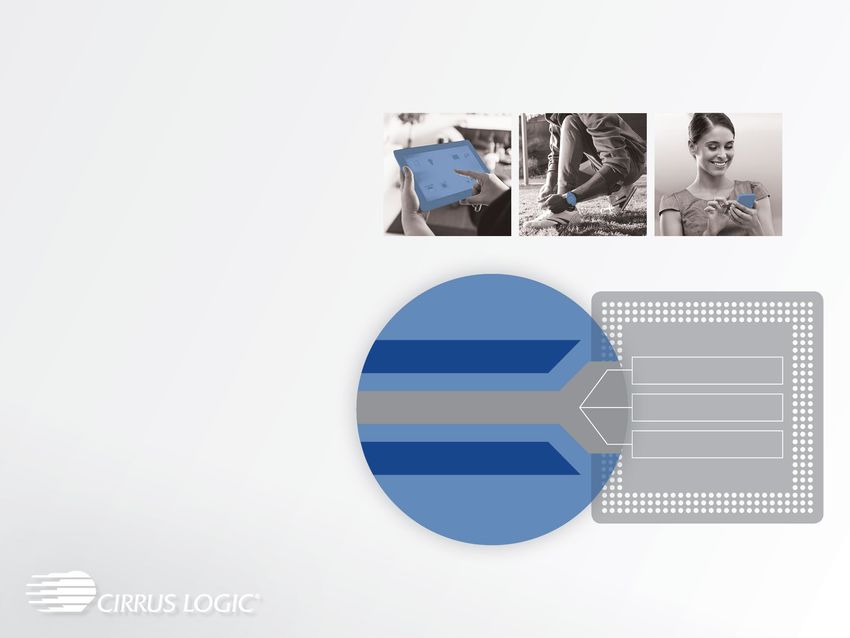
Compelling Strategy for Growth & Diversification

                                             Audio

                                First Choice in Signal Processing

          Mixed-Signal   Low-Latency       Low-Power         Outstanding   Customer
             Design       Processing       Leadership         Execution     Focus

                                                                                      5
Investor Relations Update - As of October 30, 2019
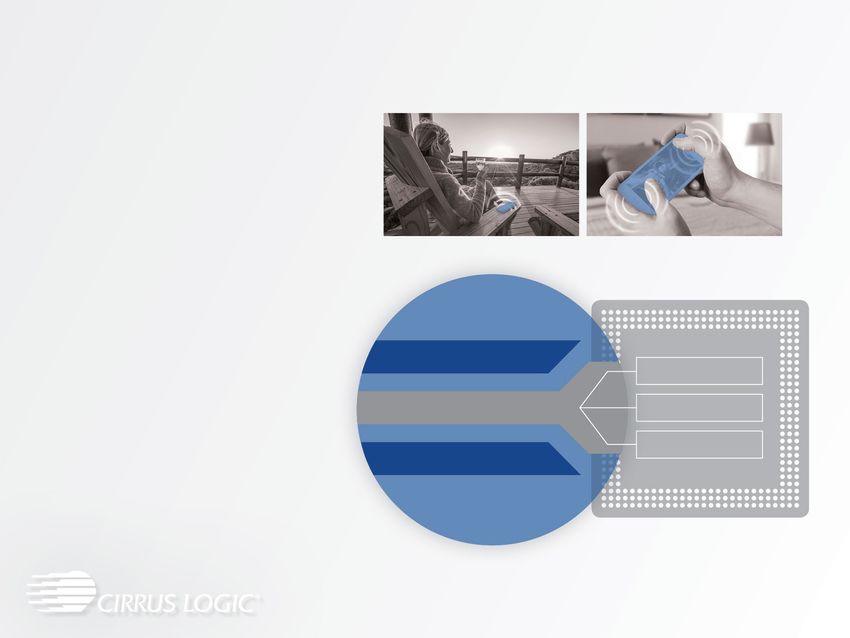
Focus on Market-Leading Customers

            MOBILE                      SMART                       SMART HOME
                                     ACCESSORIES

    Supplier to 8 of the top 10   Supplier to 4 of the top 5    Supplier to top 2 smart
      smartphone OEMs,               headset brands                 home OEMs
        including top 4

        Company expects to expand content with new and existing customers in FY20

                                                               Top 10 smartphone OEMs based on CY2018 shipments
                                                                  Top 10 headset brands based on CY2018 unit share
                                                                 Source: GFK, Futuresource and company estimates

                                                                                                                6
Investor Relations Update - As of October 30, 2019
7
Investor Relations Update - As of October 30, 2019
Technology & Market Overview

                               8
Investor Relations Update - As of October 30, 2019
Expanding SAM > $6B Opportunity in 2023

Opportunity
   2023

                                                                                                                              Smart
                                                                        Smart Home            Biometric        Haptic    Accessories
                                                                    Audio and Other*             Voice         Drivers        Audio*
               Flagship
                 Audio*   $1.6B            Mid-Tier
                                            Audio*    $1B              $770M               $750M $480M $475M                               Other Edge
                                                                                                                                           Processing   $1.1B

Opportunity
    2019
                                                                                                    Smart

                                                                                                           $250M
                                                                                               Accessories
                                                                                                    Audio*
                                                      Smart Home

                                                                                                   Drivers $240M
                                                        Audio and                                  Haptic
                                                           Other*
         Flagship
           Audio*   $1.4B    Mid-Tier
                              Audio*    $840M $530M

                                                                                       *Includes smart codecs, audio amplifiers, DACs and MEMS microphones
                                                                                             Source: GFK, Futuresource and company estimates as of May 2019

                                                                                                                                                          9
Cirrus Logic Growth Vectors

                         • Increased concentration of stereo smartphones with dual loudspeakers

EXPANDING CONTENT AND    • Boosted amplifier penetration increasing across global smartphone market

 SHARE IN SMARTPHONES    • Increased adoption of seamless, always-on voice activation
                         • Increased adoption of digital headsets and adapters

 EXPANSION OF SAM WITH   • Secure user authentication with voice biometrics

  NEW APPLICATIONS AND   • Haptic drivers for button replacement and advanced user experiences

         TECHNOLOGIES    • Sensing applications and incremental non-audio low-power signal processing

                                                                                                        10
Expanding Product Portfolio
    MEMS Microphones             MEMS Microphones
      ASP $0.25 - $0.45            ASP $0.25 - $0.45

       Haptic Drivers              Haptic Drivers
      ASP $0.50 - $0.75            ASP $0.50 - $0.75

     Audio Amplifiers             Audio Amplifiers
      ASP $0.45 - $0.75            ASP $0.45 - $0.75

   Mid-Tier Smart Codecs    Hi-Fi Digital Accessory Codecs      MEMS Microphones
      ASP $1.00 - $1.50            ASP $0.75 - $1.50             ASP $0.25 - $0.45

   Flagship Smart Codecs   Flagship Digital Headset Codecs   Smart Home Smart Codecs
      ASP $1.50 - $2.50            ASP $1.50 - $2.50              ASP $1.50 - $2.50

                                                                                       11
Product Overview

                   12
Audio Amplifiers
• Delivering a louder and higher
  quality audio experience

• Smartphones transitioning from
  mono to stereo speakers

• Ultra-low power required for
  extended playback

• Advanced power management
  applied to protect speakers and
  manage battery performance

                                      Boosted Amplifier
                                                          Speaker Protection

                                    Ultra-Low-Power DSP    High-Quality Audio

                                                          Battery Management
                                      Monitoring ADCs

                                                                                13
Haptic Drivers
• Waterproofing and advanced
  industrial design trends are driving
  customers to replace mechanical
  buttons with sensor and LRA-based
  haptics solutions

• Ultra-low-latency boosted driver
  required to deliver highly responsive
  and consistent haptic feedback to
  user

• Enabling new user experiences with
  custom tactile feedback

• Haptic drivers are an example of the
  company’s expansion into adjacent         Boosted Driver
  markets where real-time edge                                       Home Button
  processing is critical
                                          Ultra-Low-Power DSP     Virtual Side Buttons

                                                                Custom Tactile Feedback
                                            Monitoring ADCs

                                                                                          14
Smart Codecs & Voice Processors
Cirrus Logic’s extensive portfolio of audio and voice technology
delivers complete product solutions for a variety of applications.

          Hi-Fi DACs

                                                              Voice Capture

     Secure Voice Biometrics                                 Voice Activation

                                                                 Barge-In
   Ultra-Low-Power DSP
                                                              Far-Field Voice

                                                            Customer Software
     Continuously Adaptive ANC
                                                           3rd Party Ecosystems

          High-Performance ADCs

                                                                                  15
Headset Codecs
• Demand for digital headsets and
  adapters fueled by transition from
  analog to digital connectivity in both
  wired and wireless products

• Digital connectivity enables new and
  enhanced user experiences in audio,
  voice and sensing applications,
  including continuously adaptive ANC

                                                   High-Performance ADC

                                                                             Voice Capture
                                              USB Audio
                                                                            Noise Reduction,
                                                                            Echo Cancelation
                                            Ultra-Low-Power DSP

                                                                          Sensing Applications
                                           Continuously Adaptive ANC
                                                                          Hearing Augmentation

                                                   Hi-Fi DACs

                                                                                                 16
Voice Biometrics

             CHECK WEATHER
                                UNLOCK
             SET TIMERS
                                READ
             PLAY MUSIC
                                NAVIGATE
             GET JOKES

             CHECK SCORES       ORDER

                                MONITOR

                                PAY

                                LOCATE

                                BOOK

                                SUMMONS

                                MANAGE

                             …ETC.

                                           17
Security is Critical

       ALWAYS-ON VOICE
ACTIVATION WITH ROBUST
                          • Enables execution of any virtual assistant command
                            without requiring fingerprint/PIN
  USER AUTHENTICATION

HIGH-SECURITY BIOMETRIC   • User passphrase for authenticating FIDO transactions
      VOICE PASSPHRASE    • Allows financial transactions, login to web pages, etc.
        AUTHENTICATION

                          • Algorithm examines audio each time user speaks
 DETECTS MOBILE DEVICE
                          • Our solution detects artifacts indicating the playback of
       REPLAY ATTACKS       a recording rather than a live human voice

                                                                                        18
Positioned for Long-Term Growth
• Multiple vectors for content and application expansion driving
  significant growth in SAM

• Leveraging mixed-signal expertise to penetrate adjacent
  technology opportunities

• Investment in innovative R&D projects expected to extend
  market leadership in audio, voice and beyond

                                                                   19
Financials

             20
Track Record of Long-Term Revenue Growth

10-YEAR CAGR OF 21%                         ANNUAL REVENUE FY09-FY19 (M)            $1,539 $1,532

Growth fueled by strong
demand for audio, voice and
other signal processing                                                                             $1,186
                                                                           $1,169
products

                                                                    $917
                                                     $810
                                                             $714

                                              $427
                                     $370

                              $221
                      $175

                      FY09    FY10   FY11     FY12    FY13   FY14   FY15   FY16     FY17    FY18    FY19

                                                                                                             21
Financial Highlights

 BALANCE   • $483M total cash, up from $456M in the June quarter

   SHEET   • Q2 ending inventory $145M, down slightly from the prior quarter

           • In Q2, we utilized $30M to repurchase 559,274 shares at an average price of $53.64

 BUYBACK   • In FY19, we used $160M to repurchase ~4.0M shares at an average price of $40.30
           • As of September 28, 2019, we have $170M remaining in the share repurchase program

  TAXES    • FY20 worldwide non-GAAP effective tax rates expected to range from ~15% to 17%

                                                                                                  22
Strong Cash Generation
CASH GENERATION                         TRAILING TWELVE MONTH OPERATING CASH FLOW AND CAPEX (M)
 • Generated $1.2B of operating cash
   flow over last 5 full fiscal years    $317
                                                      $303
 • Ended Q2 FY20 with $483M cash
   and investments globally                                                     $259
                                                                                             $246

USE OF CASH                                                        $207
 • Investment in R&D
 • M&A and share repurchases over
   the last 5 full fiscal years:

        • Acquisitions: $481M

        • Share Repurchases: $422M
                                                $53
 • Infrastructure improvements and                           $44
                                                                          $36          $30          $28
   capital expenditures

                                           Q2/FY19     Q3/FY19      Q4/FY19      Q1/FY20      Q2/FY20

                                                              TTM CFOps    TTM Capex

                                                                                                          23
Operating Profit Profile
  30%
                                                                       GAAP        Non-GAAP*                  28%

  25%
                                    22%                                                              22%

  20%                                             19%

             15%              15%
  15%                                     14%

                                                                                          10%
  10%                                                                 9%
                         8%
        7%

  5%
                                                             3%
                                                                                  2%

  0%
                   -2%

  -5%
        Q4/FY18     Q1/FY19    Q2/FY19     Q3/FY19            Q4/FY19              Q1/FY20             Q2/FY20

                                          *GAAP to non-GAAP reconciliations available on slide 27 and at https://investor.cirrus.com

                                                                                                                                 24
Financial Results and Outlook

               REVENUE     GROSS MARGIN           OPERATING
                                                   EXPENSE
RESULTS
Q2 FY20                                            $121.2M
              $388.9M        53.5%        (includes $13.5M in stock-based
                                             comp, $6.7M in amortization)

               REVENUE     GROSS MARGIN           OPERATING
                                                   EXPENSE
GUIDANCE*
Q3 FY20                                         $118 – $124M
            $325 – $365M   51% – 53%       (includes $13M in stock-based
                                              comp, $7M in amortization)

                                                                     *As of October 30, 2019

                                                                                        25
Quarterly Revenue and EPS
         CIRRUS LOGIC REVENUE Q4 FY18 TO Q3 FY20 (M)                                                        CIRRUS LOGIC EPS Q4 FY18 TO Q2 FY20
                                                                                            $1.80
$450                                                                                                                                                                 GAAP EPS

                                                                    $389                    $1.60                                                                                                             $1.55
$400                                                                                                                                                                 Non-GAAP EPS**
                            $366
                                                                             $345*          $1.40
$350                                                                                                                                                                                                  $1.27
                                      $324
        $303                                                                                $1.20
                                                                                                                                             $1.08
$300
                 $254                                                                       $1.00                                    $0.93
                                                                                                                                                             $0.91
$250                                            $240      $238
                                                                                            $0.80

$200
                                                                                            $0.60
                                                                                                            $0.51                                    $0.49

$150
                                                                                            $0.40                                                                             $0.37           $0.35
                                                                                                                             $0.28

$100                                                                                        $0.20
                                                                                                    $0.19
                                                                                                                                                                      $0.10           $0.08

 $50                                                                                        $0.00                   -$0.07

 $0                                                                                        -$0.20
                                                                                                     Q4/FY18          Q1/FY19         Q2/FY19         Q3/FY19          Q4/FY19         Q1/FY20         Q2/FY20
       Q4/FY18   Q1/FY19   Q2/FY19   Q3/FY19   Q4/FY19   Q1/FY20   Q2/FY20   Q3/FY20

                                In Q2 FY20, our largest customer represented 81% total revenue

                                                                                                                                  *Midpoint of guidance as of October 30, 2019
                                                                                       **GAAP to non-GAAP reconciliation available on slide 27 and at https://investor.cirrus.com

                                                                                                                                                                                                                      26
GAAP to Non-GAAP Reconciliation            (unaudited, in thousands, except per share data, not prepared in accordance with GAAP)
     We use these Non-GAAP financial numbers to assist us in the management of the Company because we believe that this information provides a more
     consistent and complete understanding of the underlying results and trends of the ongoing business due to the uniqueness of these charges. We are not able
     to provide guidance on our GAAP tax rate or a related reconciliation without unreasonable efforts since our future GAAP tax rate depends on our future
     stock price and related stock -based compensation information that is not currently available.
                                                                  Sep. 28,      Jun. 29,       Mar. 30,       Dec. 29,      Sep. 29,      Jun. 30,     Mar. 31,
                                                                   2019          2019            2019          2018          2018          2018         2018
     Net Income (loss) Reconciliation                             Q2'20          Q1'20          Q4'19          Q3'19         Q2'19         Q1'19       Q4'18
     GAAP Net Income (Loss)                                     $ 76,210 $         4,618     $     6,157     $ 29,933     $ 58,173      $   (4,272) $ 12,004
     Amortization & other acquisition related items                    6,722        7,228           7,228         7,630        12,867        13,266      13,266
     Stock-based compensation expense                                 13,759       11,786          12,583        11,181        13,131        12,794      12,533
     U.K. pension settlement                                             -             -              -          13,768            -             -           -
     Other expenses *                                                    -             -           (4,913)           -             -             -          (279)
     Adjustment for income taxes                                      (3,417)      (2,803)          1,202        (7,003)      (17,054)       (3,926)      (4,502)
     Non-GAAP Net Income                                        $ 93,274 $ 20,829            $ 22,257        $ 55,509     $ 67,117      $ 17,862      $ 33,022
     Earnings (Loss) Per Share reconciliation
     GAAP Diluted earnings (loss) per share                     $       1.27 $       0.08    $       0.10   $      0.49   $      0.93   $     (0.07) $      0.19
     Effect of Amortization & other acquisition related items           0.11          0.12           0.12           0.13          0.21          0.21        0.21
     Effect of Stock-based compensation expense                         0.23          0.20           0.21           0.18          0.21          0.20        0.19
     Effect of U.K. pension settlement                                   -             -              -             0.23           -             -           -
     Effect of Other expenses *                                          -             -            (0.08)           -             -             -           -
     Effect of Adjustment for income taxes                             (0.06)        (0.05)          0.02          (0.12)        (0.27)        (0.06)      (0.08)
     Non-GAAP Diluted earnings per share                               $        1.55    $       0.35     $       0.37      $       0.91     $        1.08     $       0.28     $       0.51
     Operating Income (Loss) Reconciliation
     GAAP Operating Income (Loss)                                      $  86,676 $            4,144      $     7,107       $    44,241      $    55,578       $    (6,157)     $    20,767
     GAAP Operating Margin (Loss)                                            22%                 2%               3%               14%              15%               -2%               7%
     Amortization & other acquisition related items                         6,722              7,228            7,228             7,630           12,867            13,266           13,266
     Stock-based compensation expense - COGS                                  254                241              288               220              170               199              422
     Stock-based compensation expense - R&D                                 7,830              7,240            8,270             6,761            6,834             7,250            6,847
     Stock-based compensation expense - SG&A                                5,675              4,305            4,025             4,200            6,127             5,345            5,264
     Other expenses *                                                         -                  -             (4,913)              -                -                 -               (279)
     Non-GAAP Operating Income                                         $ 107,157 $           23,158      $    22,005       $    63,052      $    81,576       $    19,903      $    46,287
     Non-GAAP Operating Margin                                               28%                10%               9%               19%              22%                8%              15%
     Operating Expense Reconciliation
     GAAP Operating Expenses                                           $ 121,257 $ 118,350               $ 117,532         $ 118,939        $ 129,541         $ 130,716        $ 131,863
     Amortization & other acquisition related items                        (6,722)   (7,228)                 (7,228)           (7,630)         (12,867)          (13,266)         (13,266)
     Stock-based compensation expense - R&D                                (7,830)   (7,240)                 (8,270)           (6,761)          (6,834)           (7,250)          (6,847)
     Stock-based compensation expense - SG&A                               (5,675)   (4,305)                 (4,025)           (4,200)          (6,127)           (5,345)          (5,264)
     Other expenses *                                                         -         -                     4,913               -                -                 -                279
     Non-GAAP Operating Expenses                                       $ 101,030 $ 99,577                $ 102,922         $ 100,348        $ 103,713         $ 104,855        $ 106,765
     Gross Margin/Profit Reconciliation
     GAAP Gross Profit                                                 $ 207,933 $ 122,494               $ 124,639         $ 163,180        $ 185,119         $ 124,559        $ 152,630
     GAAP Gross Margin                                                     53.5%     51.4%                   51.8%             50.3%            50.5%             48.9%            50.3%
     Stock-based compensation expense - COGS                                 254       241                     288               220              170               199              422
     Non-GAAP Gross Profit                                             $ 208,187 $ 122,735               $ 124,927         $ 163,400        $ 185,289         $ 124,758        $ 153,052
     Non-GAAP Gross Margin                                                 53.5%     51.5%                   52.0%             50.4%            50.6%             49.0%            50.5%
     Effective Tax Rate Reconciliation
     GAAP Tax Expense (Benefit)                                        $    12,148 $          1,433      $      3,048      $     2,381      $    (1,448)      $      (228)     $     9,983
     GAAP Effective Tax Rate                                                 13.7%            23.7%             33.1%             7.4%            -2.6%              5.1%            45.4%
     Adjustments to income taxes                                              3,417            2,803            (1,202)           7,003           17,054             3,926            4,502
     Non-GAAP Tax Expense                                              $    15,565 $          4,236      $      1,846      $     9,384      $    15,606       $     3,698      $    14,485
     Non-GAAP Effective Tax Rate                                             14.3%            16.9%              7.7%            14.5%            18.9%             17.2%            30.5%
     Tax Impact to EPS Reconciliation
     GAAP Tax Expense (Benefit)                                        $        0.20    $       0.02     $       0.05      $       0.04     $       (0.02)    $        -       $       0.15
     Adjustments to income taxes                                                0.06            0.05             (0.02)            0.12              0.27             0.06             0.08
     Non-GAAP Tax Expense                                              $        0.26    $       0.07     $       0.03      $       0.16     $        0.25     $       0.06     $       0.23
     * Other expenses m ay contain certain item s such as acquisition expenses, litigation expenses, proceeds from a patent agreem ent, restructuring item s, sales reorganizations, asset gains
     and im pairm ents. GAAP to non-GAAP reconciliations also available at www.cirrus.com .

                                                                                                                                                                                                   27
You can also read