First-quarter 2019 Webcast for investors, analysts & media - Straumann
←
→
Page content transcription
If your browser does not render page correctly, please read the page content below

First-quarter 2019
Webcast for investors, analysts & media
Disclaimer
    This presentation contains certain forward-looking statements that reflect the
    current views of management. Such statements are subject to known and
    unknown risks, uncertainties and other factors that may cause actual results,
    performance or achievements of the Straumann Group to differ materially from
    those expressed or implied in this presentation. The Group is providing the
    information in this presentation as of this date and does not undertake any
    obligation to update any statements contained in it as a result of new information,
    future events or otherwise.
    The availability and indications/claims of the products illustrated and mentioned in
    this presentation may vary according to country.

2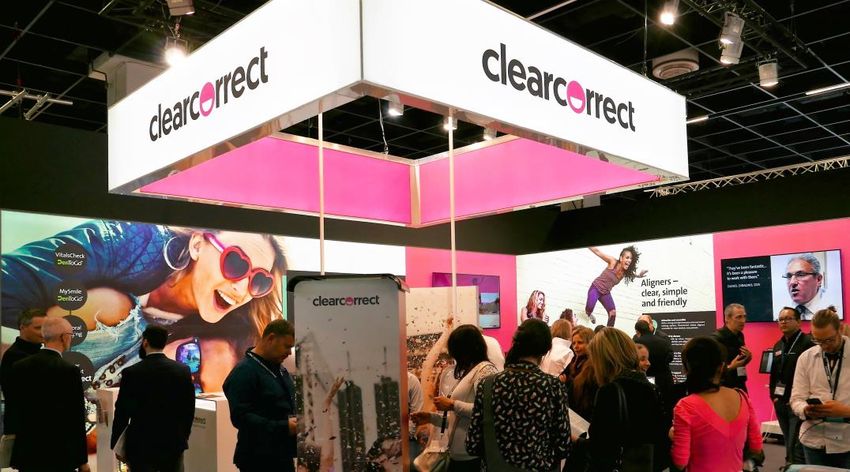
Agenda
First-quarter highlights

Business and regional review

Recent achievements & strategy in action

Outlook 2019

Q&A and upcoming events
First-quarter highlights
               Marco Gadola, CEO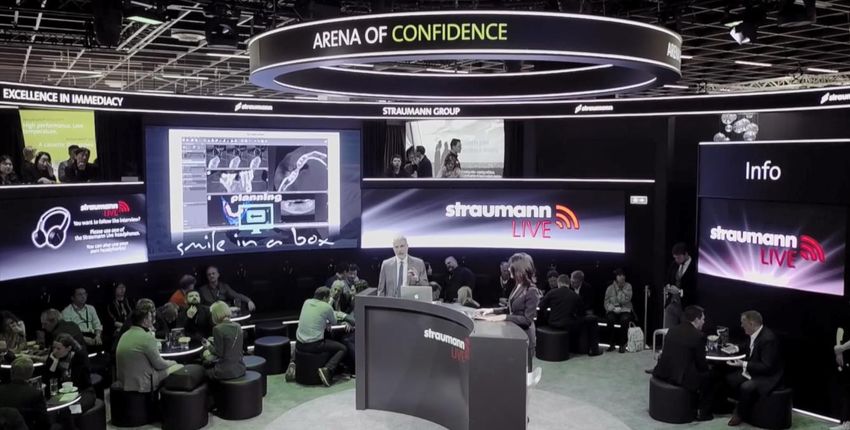
Good start to 2019 – further growth initiatives taken
                        REVENUE                                                              GROWTH                                                     TOP PERFORMERS

                   CHF        372m                                                 +17% organic                       1                         APAC & LATAM
              Up 15% on strong 2018                                                 2.3%-point FX effect                                          …sustain growth around 20%;
                   performance                                                     Minor acquisition effect                                      NAM & EMEA both post double-
                                                                                                                                                        digit increases

             INNOVATION STREAM                                                            PORTFOLIO                                                        OUTLOOK2

          >100 new articles                                               Business expansion                                                           Outperformance
         …introduced at key trade events;                               Stakes increased in Anthogyr, Zinedent,                                  2019: organic revenue to grow in
         clear aligner business launched in                                Medentika and Valoc; distribution                                    low-teen percentage range; further
              LATAM, Europe & China                                              agreement with Medit                                          improvements in EBITDA and EBIT
                                                                                                                                                             margins

     1Organic growth – i.e. excluding the effects of currency fluctuations and acquired/divested business activities. 2 Outlook expectations barring
5
     unforeseen events/circumstances and assuming fairly stable FOREX.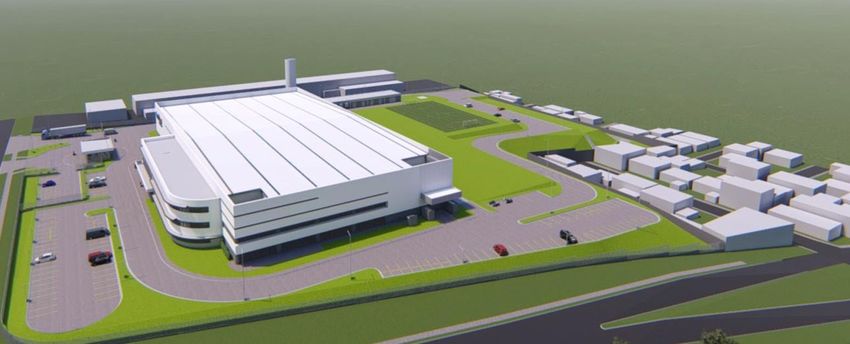
Strong growth continues – on track to deliver our full-
    year promises
    Organic revenue growth

                                     EMEA
        NAM
                                     FY 2018   14.6%
        FY 2018     20.0%
                                     Q1 2019   14.4%
        Q1 2019     17.4%

                                                            APAC
                                                             FY 2018   27.8%
                                                             Q1 2019   22.1%

               LATAM
               FY 2018       20.2%
               Q1 2019       19.7%                Group
                                                  FY 2018   18.9%
                                                  Q1 2019   17.1%
6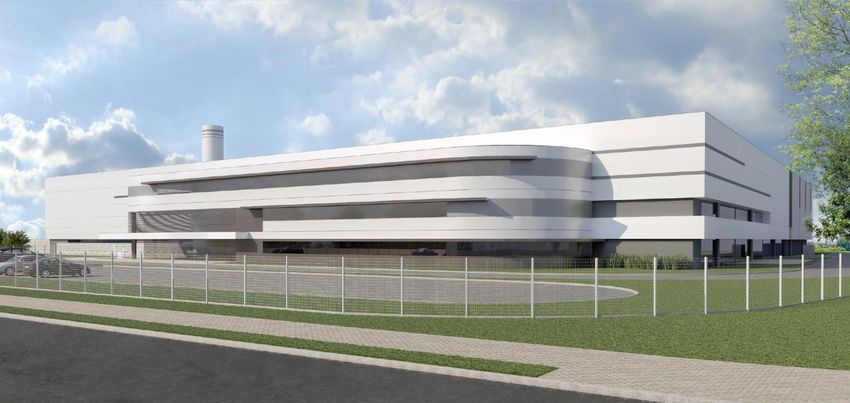
Business and regional review
              Peter Hackel, CFO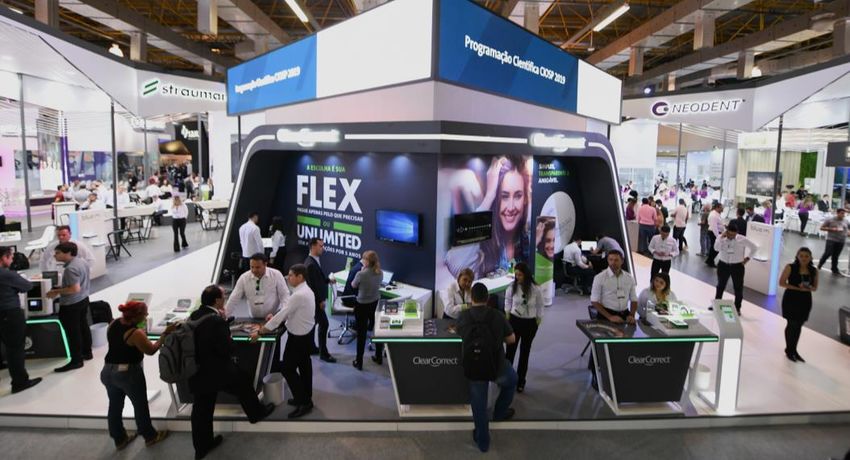
EMEA and NAM contribute two-thirds of organic growth
    Revenue development (in CHF m, rounded)
                                                                                                    Regional share of
                                             14.9%                                                  organic growth
                                             in CHF
                                                             17.1%
                                                             organic                                     9%       Latin
                                                                                4.9       372.3                   America
                                                                   13.0
                                                          16.4                                          24%

                                              20.2                                                                Asia
                                                                                                                  Pacific
     324.1      -6.6
                          0.3      317.8                                                                30%

                                                                                                                  North
                                                     Change in organic growth                                     America

                                             14.4%       17.4%         22.1%     19.7%                  37%
                                                                                                                  EMEA

    Revenues FX effect M&A effect Revenues   EMEA        North     APAC        LATAM     Revenues
    Q1 2018                       Q1 2018               America                          Q1 2019
                                  @FX 2019
8
EMEA & North America outpacing the market
EMEA Revenue change (organic) EMEA performance fuelled by
countries in Eastern Europe and the
56% Middle East
19.3% Key performers: Russia, Austria, and
17.0%
43% of Group 15.0% 14.4% Turkey; strong growth in Germany
11.9%
9.8% Good growth across the board, except
for digital hardware (typical pattern
pre-IDS)
Q4 Q1 2018 Q2 Q3 Q4 Q1 2019
North America 22.7% 23.6% Robust demand for premium implant
19.0% 19.5% and abutment solutions
17.2% 17.4%
Value implants growing faster than
premium
30% of Group Biomaterials benefit from Jason
membrane launch and cross-selling
Dynamic growth in clear-aligner cases
continues
Q4 Q1 2018 Q2 Q3 Q4 Q1 2019
9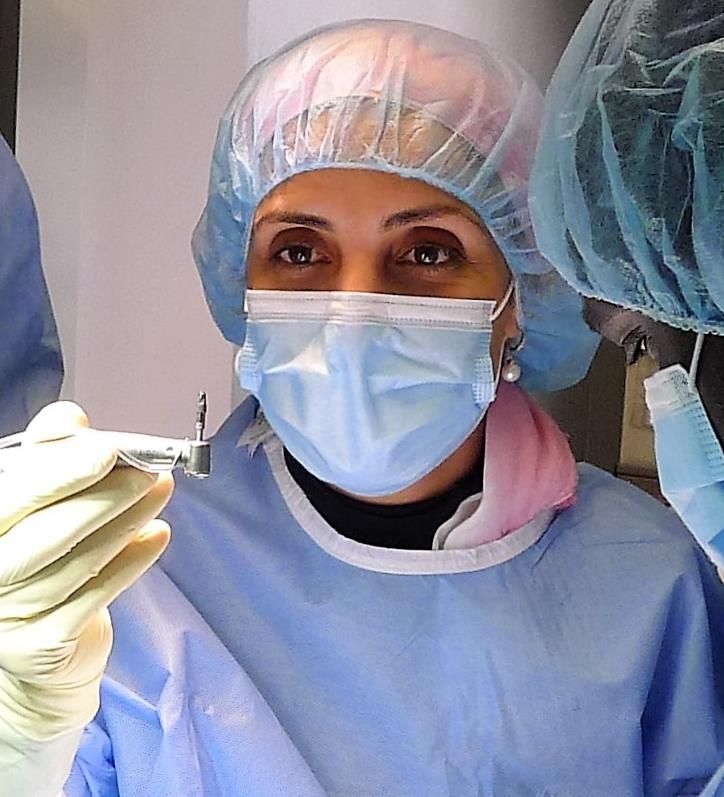
Strong performance in Asia Pacific & Latin America
APAC Revenue change (organic) Impressive organic growth (+22%)
32.5% 33.1%56%
China maintains dynamism
25.0% Japan progresses well
22.1% 21.2% 22.1%
Neodent rolled out in Australia,
19% of Group
Indonesia and Thailand
Q4 Q1 2018 Q2 Q3 Q4 Q1 2019
Latin America 26.5% Argentina, Chile, Colombia and Mexico
21.5% 20.0% 19.7% all continue to deliver strong growth
Solid single-digit growth in the largest
11.6% 13.0% market, Brazil
8% of Group ClearCorrect launched at CIOSP in
February
Q4 Q1 2018 Q2 Q3 Q4 Q1 2019
10Dynamic clear-aligner and biomaterials business
Restorative &
Implants Digital Biomaterials
11Recent achievements & strategy in action
Marco Gadola, CEOAnthogyr – a high-quality European brand to further
penetrate the attractive non-premium segment
Stake increased from 30% to full ownership
Consolidation 1 June 2019; integration started
Leading French implant manufacturer; established
international provider of upper value implants
Comprehensive implant portfolio
Group to build on successful partnership in China
and Russia
Anthogyr employs 400 people
Total revenues last 12 months: CHF 57 million
(approx. CHF 50 million acquisition effect1)
1 Acquisition effect represents the revenues generated in the 12 months prior to the closing excluding intra-company sales. The amount may
13
fluctuate with currency movements.Further jewels in the crown
Stake increased from 51% to 91%
Attractively-priced compatible prosthetics and implants
Participation increased from 50% to full ownership
Implants to address the lower value segment in Turkey,
Middle East, N. Africa, and Eurasia
Consolidated as of 1 January 2019
Stake increased from 44% to a controlling 55%
High-performance retention devices for implant-borne
removable dentures
14Esthetic dentistry solutions portfolio
Multi-platform
Implant systems Digital Orthodontic Biomaterials Preventive
prosthetics
brands
Global
Local brands
brands & partners
Technology
15Innovation showcased at key events
Huge presence at AO, Chicago Midwinter, CIOSP &
IDS
Key innovations launched; >100 new items presented
>50 lectures/live sessions at booths
Tens of thousands of views online
>3000 customer leads
Watch the IDS video
https://www.youtube.com/watch?
v=GULQa2ozUjU
16Meeting requirements for immediate solutions e.g. in
edentulous treatments
Removable solutions Fixed solutions
new new new
Straumann Straumann Straumann BLT and Straumann BLX Straumann
Mini-Implantat Novaloc angulated abutments Pro Arch
17An even broader range of digital options
Virtuo Vivo™ 3Shape TRIOS 4 Medit T-Series
intraoral scanner
DWOS 8 & CoDiagnostiX with Easy Modes;
Carestream, Camfacture, Medit integrated
3D printing capsule system
18Clear-aligner business launched in Brazil, China and
Europe
ClearCorrect
Launched in Brazil and Europe
Production expansion
Fresh new branding
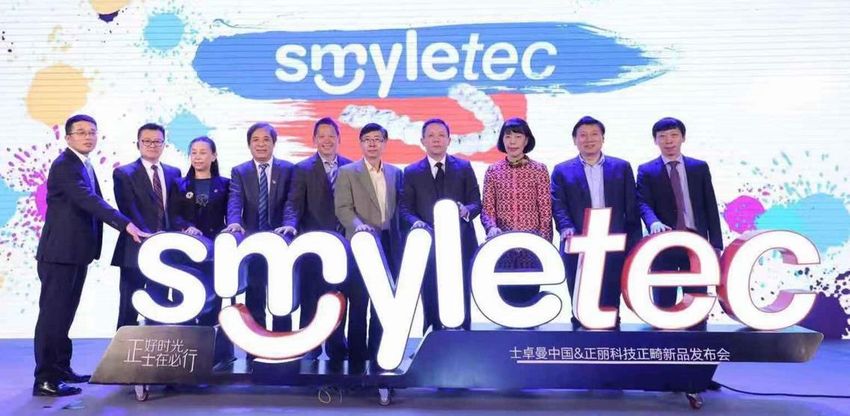
Smyletec
Exclusive distribution agreement
Affordable, state-of-the-art solutions for China
World’s second largest market for clear aligners,
expected to grow >50% p.a. in the next 5 years
Smyletec launched in March; Dental Monitoring to
follow later in 2019
19Group expands production in Brazil
Construction of new plant in Curitiba underway
11 000m2 production space created in first phase
Automated production of ClearCorrect clear aligners to serve LATAM market
Increased capacity for implant system components
Scheduled opening in Q4 2019
20ClearCorrect and Align Technology settle patent disputes
Companies agree to drop patent disputes
Non-binding letter of intent to explore distribution & development of Align’s
iTero® IO-scanner integrated in Straumann’s CARES® / DWOS® workflow
Straumann Group expects one-time expense of max CHF 24m in H1 2019,
including CHF 16m, if distribution & development agreement does not
materialize
21Inspiring and engaging women in implant dentistry
First WIN EMEA summit attended by 160 female dental
professionals from 27 nations
#Power-up: Women@Straumann – internal program for
female colleagues reflects external initiative
JUNTAS empowering women in Brazil; >200 female
colleagues join program
22Outlook 2019
Our 2019 guidance
     Barring unforeseen circumstances

                                                            Global implant market to continue to
     Market growth                                                  grow between 4-5%

      Our revenue                                Confident to outperform and achieve organic
        growth                                revenue growth in the low-teens percentage range

                                                         Further improvement in the underlying1
          Profitability                                        EBITDA and EBIT margin

      1 Profitability objectives exclude exceptional effects related to acquisitions, business combinations as well as the impact from the adoption of
24    IFRS16 (see next slide).
Estimated impact from adopting
IFRS 16 (leases) in 2019
Approx. IFRS 16 impact (in CHF million)1 Total
Revenue
Gross margin +0.5
EBITDA +18.0
EBIT +3.0
Financial results -5.0
Profit before tax -2.0
25
1 Barring unforeseen circumstances, major currency movements and/or change in business scopeQuestions & answers
&Calendar of upcoming events
2019 Event Location
30 April First-quarter results Webcast
21 May UBS Healthcare conference New York
22 May Berenberg US conference Tarrytown (US)
04-05 June Vontobel Switzerland conference Interlaken (CH)
13 June Exane BNP Paribas CEO conference Paris
14 August First-half 2019 results conference Basel, HQ
Social media Type Source
Analyst Talk Executive interviewed by analysts Corporate Website / youtube
StraumannIR Investor Relations Twitter @StraumannIR
27Straumann’s currency exposure
Revenue breakdown FY20181 FX sensitivity
CHF Average exchange rates (rounded)
(+/- 10%) on full-year...
6%
Other Closing
21% 2017 2018 2018 Revenue EBIT
EUR 1 EURCHF 1.11 1.15 1.13 +/- 39m +/- 23m
BRL 29%
8% 1 USDCHF 0.98 0.98 0.99 +/- 37m +/- 17m
JPY 100 BRLCHF 30.69 26.87 25.36 +/- 11m +/- 2m
5%
100 JPYCHF 0.87 0.88 0.90 +/- 7m +/- 4m
Exchange rates development in 2017-18
USD/CAD/AUD
31% 115
Cost breakdown FY20181
110
Other 105
12% CHF
BRL 29% 100
8% 95
JPY
3% 90
85
80
75
70
01.2017 06.2017 11.2017 04.2018 09.2018
USD/CAD/AUD EUR
26% 22% USDCHF EURCHF JPYCHF BRLCHF
28
1These distribution charts represent the total net revenues and the total COGS, as well as OPEX in the various currencies. All numbers are rounded and based
on FY 2018 figures as well as average FX rates in 2017-18. They also include recent acquisitions and new subsidiaries.Thank you
You can also read