Group presentation Martine Odillard, Chief Executive Officer Rémy Husson, Chief Financial Officer Cédric Ratouis, Investor Relations - Chargeurs
←
→
Page content transcription
If your browser does not render page correctly, please read the page content below
Group presentation

Martine Odillard, Chief Executive Officer
Rémy Husson, Chief Financial Officer
Cédric Ratouis, Investor Relations          September 29th, 2015
Agenda

1.   Group profile
2.   Businesses
3.   2015 First-Half Financial Review
4.   Outlook

     ---

     Appendices

                     Group presentation – September 29th, 2015   2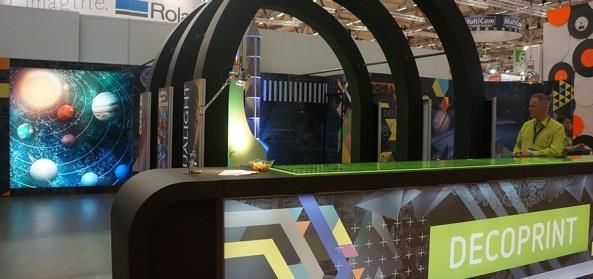
1. Group profile

                   3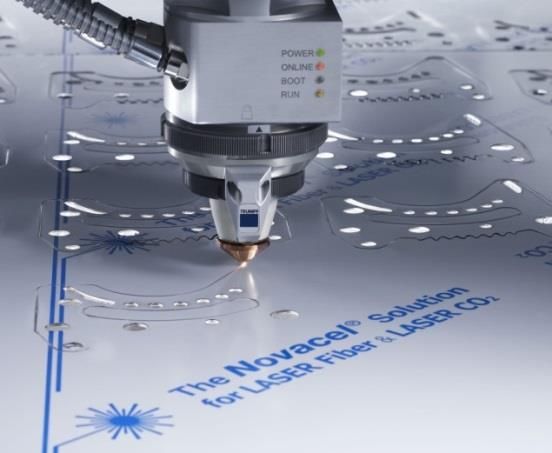
Chargeurs today
}   A global manufacturing and services group
    }   More than 90 % of sales outside France
    }   1,600 people in 32 countries on 5 continents
    }   11 industrial sites in6 countries on 4 continents

}   4 operating segments with leading positions
           Protective Films
              Temporary protection of surfaces

              Technical Substrates
              Functionalization of technical substrates

              Interlining
              Interlining for clothing

              Wool
              Top making and combed wool sales

                              Group presentation – September 29th, 2015   4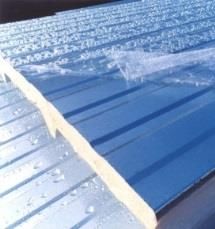
Key dates in Chargeurs history
}   1925 Creation of textile group Pricel                           }   1872 Creation of Compagnie des
    -                                                                        Chargeurs Réunis (navigation)
}   1976     Acquisition by Jérôme Seydoux                          }   1980 Acquisition by Jérôme Seydoux
               - Dying                                                              - cruises (Paquet)
              - Interlining for clothing (Interlining, Fashion)                     - airline business (UTA)
              - Cleaning products (Spontex)                                         - overlanf transportation (Causse-Walon)
              - Adhesive films (Novacel)

}   1981     Merger of Pricel with Chargeurs Réunis
             46% air transportation, 30% sea and overland transportation, 24% other industrial operations

}   1981     Transformation of Chargeurs Réunis in Chargeurs with two businesses
      to        - Media: Television (BSkyB, CanalSatellite), movie (Pathé), print media operations (Libération) ;
    1995        - Textiles / Manufacturing: wool, fashion, interlining, protective films, transport (Walon).

}   1996 Demerger into two companies : « Pathé » and « Chargeurs »
}   1996 Refocus of Chargeurs business base and globalization
      to   - In 2001, acting in concert with Jérôme Seydoux, Eduardo Malone increase its equity stake in Chargeurs.
    2007      (Eduardo Malone joined Pricel in 1973 and is appointed CEO of Chargeurs Réunis in 1985.)
}   2008 Global Financial and Economic crisis
      to        - Sale of « Fashion » business.
    2010 Refinancing protocol (€ 80 M), issue of bonds convertible into shares (€ 23 M)
                                           Group presentation – September 29th, 2015                                           5
A successful transformation between 2010 and 2014
}   Strategic priorities of the transformation
    }   Group strong deleveraging
    }   Improvement of the profitability on capital employed
    }   Return to profitable growth

}   Implementation
    }   Funding and cash management
        } Extension of ST facility of banking protocol & diversification of international financing sources
        } Decrease of the WCR
        ] Protocol exit by anticipation : Protective Films in December 2013, Interlining in June 2014
    }   Profitability of the capital employed
        }   Interlining : Disposal of non strategic assets and withdraw from a non-profitable business
        }   Wool : transformation of the business model with assets owned in partnership in 2012 and 2013
    }   Profitable growth
        }   Protective Films : innovation (fiber laser) & focus on value-added products and services
        }   Technical Substrates : € 8M investment for digital printing

}   2015 : Dividend payment for 2014 (last dividend payment was in 2008)
                                     Group presentation – September 29th, 2015                                6
A successful transformation between 2010 and 2014 : figures

 }   2012 and 2013, decrease of the             }    H1 2014, introduction of a « recurring   }   2012, restructuring in wool and
     revenue: new equity method for wool             operating profit » in the consolidated       interlining businesses
     partnerships                                    income statement to provide a better
                                                     view of the recurring performance

 }   2012, depreciation of differed tax     }       Improvement of cash flow generation       }   Protocol repaid in June 2014
     assets                                                                                   }   Deleveraging targets achieved

                                          Group presentation – September 29th, 2015                                               7
2. Businesses

                8
A leader with an innovative positioning
Serving 4 markets:
} Expert in manufacturing self-adhesive films for
Building Industrial Prod.
temporary protection of fragile surfaces during all
the industrial process
} A global leadership
} 93 % of sales outside France
Automobile Electronic
} 520 people in 16 countries
} 3 production units: France, Italy and the United States
} Sales representatives in more than 60 countries
} In 2014, innovation strategy permitted revenue growth to
outperform the market:
} Products less than 5 years old account for nearly a third of the
revenue stream
} Half of these new products concern innovative flagship products
} The rest ongoing enhancements and improvements in performance
and processes
} Around twenty new articles were brought to market
Group presentation – September 29th, 2015 9A dynamic to improve financial results
Production in the building sector
Source Eurostat – June 2015
Polyethylene prices evolution
Prix €/tonne 1 743
1800
1 620
1 600
1 550
1600
1643
1 385
1400
1200 1 280
1 220
1 145
1000
800
740
600
Source: Platts – August 21, 2015
Group presentation – September 29th, 2015 10A very promising new segment
} 4 businesses in functionalization of technical substrates:
Decoprint Scenevent
} Digital printing substrates destined to } Coated textiles with technical
advertising promising market applications for creative spaces
} Perfect technological competence and } New business
significant global growth potential
Senfa Saflex
} Substrates for home furnishings } Protection clothing sold on French
} Integrating various simultaneous or market
independent functions } High reputation for almost 10 years
(ex: Thermal, Acoustic, blackout substrates)
} Chargeurs Technical Substrates leverages the ability of coatings to develop innovations that open new
fields of application. It helped to generate new growth in sales and profitability in 2014.
} In 2016, this strategic pathway will be supported by the starting up of a new 5 meters width production
line, coming on stream at the end of 2015.
Group presentation – September 29th, 2015 11Strong growth expected in 2015 and 2016
According to the World Textile Information
Network (Wint), global production expansion
of digital printed textile substrates reached 24%
in 2014. In 2015, it should remain a double-
digit growth.
Source:
http://www.lemoci.com/textilemarche-mondial-limpression-numerique-
file-a-toute-allure/
DECOPRINT won the prestigious EDP AWARD
(European Digital Press Association) in the «
Best textile substrate » category with its new
product AQUALIGHT, at the 2015 FESPA show
in Cologne.
Group presentation – September 29th, 2015 12A major player
“We manage the full
} Interlining expert: technical product, inserted production process”
between the fabric and the lining to keep garments
flexible and help them to retain their shape
Warping
} A major player in the clothing market with a highly
globalized organization having a commercial and Vertical
Integrated Knitting
industrial network for local customers:
Production
} 89 % of sales outside France
} 900 people in 24 countries Retraction and
} 8 production units on 3 continents Dyeing
Quality Control
at each step
Drying
} In 2014, backed by a high-end market serving
prestigious customers, Chargeurs Interlining Coating
consolidated its profitability Computer Aided
Manufacturing
Laboratory
} In 2015, drawing on its recognized know-how, the
business pursue the improvement of its profitability
Winding and
Packing
Group presentation – September 29th, 2015 13Resilience in a mature market
Clothing consumption evolution
(in % per year)
2009/ 2010/ 2011/ 2012/ 2013/ 2014/
2008 2009 2010 2011 2012 2013
France -3,1% -0,3% -2,5% -2,1% -0,7% -0,9%
Allemagne -1,0% 3,0% 0,0% -2,0% -2,0% -1,0%
G.B. 0,8% 4,5% 2,0% 1,5% 1,5% 3,8%
Italie -1,8% -1,6% -3,4% -5,0% -7,0% -3,5%
Espagne -5,6% -2,3% -1,4% -5,8% -3,8% -2,5%
Etats-Unis -4,2% 4,9% 5,7% 6,4% 3,8% 2,2%
Chine 21,0% 24,8% 24,2% 17,8% 15,0% n/a
Source : IFM – march 2015
Polyester prices
Weighted average Polyester Staple fibre prices
260 256
256
240
220
200
180 167
160 89,3
140 171,1
120
100
janv-09 janv-10 janv-11 janv-12 janv-13 janv-14 janv-15Juil-15
Source: PCI Fibres, Fibre Organon, Woolmark Market Intelligence,
Poimena Analysis, CIRFS. - Mise à jour: 31 juillet 2015
Group presentation – September 29th, 2015 14A transformed business model
} Expert of a key step in wool manufacturing chain
} « top maker » : creation of long, fine blended-wool fibers that successfully meet the needs of
spinning mills
} A global presence :
} 100 % of sales outside France
} With a light and worldwide structure
} 4 industrial partnerships (United States, Argentina, Uruguay, China)
} Thanks to the deep transformation of the historical business model, Chargeurs Wool
significantly reduced the risks related to the price volatility of its raw material
Group presentation – September 29th, 2015 15« Wool risk » managed
Australian Wool prices (EMI – Weekly)
* *
(*) 2012 and 2013, decrease of revenue : new equity method for wool
partnerships
Ratio Wool / Other textiles fibers
EMI vs other fibres
Group presentation – September 29th, 2015 163. 2015 First-Half Financial Review
17Key figures
In € million H1 2015 H1 2014 Change
Revenue 256.6 243.9 5.2%
Recurring operating profit 15.6 12.0 30.0%
Operating profit 14.4 11.8 22.0%
Attributable net profit 8.0 6.4 25.0%
In € million June 30, 2015 Dec 31, 2014
Attributable equity 205.6 182.6
Cash position 9.8 9.3
} Significant growth of the recurring operating profit
} Sharp rise of the attributable net profit
} A strong financial position
Group presentation – September 29th, 2015 18Change in Consolidated Revenue
Revenue (in €m) - H1 2014 243.9
Volume impact (8.1)
Price & mix impact 2.8
Currency impact 18.0
Change 12.7
Revenue (in €m) - H1 2015 256.6
Group presentation – September 29th, 2015 19Change in Operating Profit
In € million Recurring Non
Operating
operating recurring
profit
profit items
H1 2014 12.0 (0.2) 11.8
Volume impact (3.0) - (3.0)
Price & mix impact 4.3 - 4.3
Currency impact 3.2 - 3.2
Fixed costs (0.9) - (0.9)
Non recurring items - (1.0) (1.0)
Change #REF!
3.6 (1.0) 2.6
H1 2015 15.6 (1.2) 14.4
Group presentation – September 29th, 2015 20Consolidated Income Statement
In € milllion
H1 2015 H1 2014
Revenue 256.6 243.9
Recurring operating profit 15.6 12.0
% revenue 6.1% 4.9%
Non recurring items (1.2) (0.2)
Operating profit 14.4 11.8
% revenue 5.6% 4.8%
Finance costs & other financial income and expense, net (2.4) (2.9)
Income tax expense 6.8 (2.3)
Profit/(loss) of associates & non-consolidated interests (10.8) (0.2)
Attributable net profit 8.0 6.4
Group presentation – September 29th, 2015 21Analytical Consolidated Balance Sheet
In € million June 30th, 2015 Dec 31st, 2014
Intangible assets 77.6 72.6
Property, plant and equipment 52.8 50.3
Inv. in associates and joint ventures 18.6 27.1
Non current assets and liabilities, net (0.2) (12.7)
Working capital 54.6 47.2
Total capital employed 203.4 184.5
Attributable equity (excluding non-controlling
205.6 182.6
interests)
Convertible bonds 7.6 11.2
Cash position (9.8) (9.3)
Total financing 203.4 184.5
Group presentation – September 29th, 2015 22Statement of Changes in Equity
In € million
H1 2015 H1 2014
Equity at beginning of period 182.6 157.9
Attributable net profit 8.0 6.4
Translation reserve 10.7 0.2
Shares issued on bond conversions 4.0 2.5
Paid dividends (3.2) -
Actuarial gain and losses on post-employment benefit obligations 1.0 (1.3)
Other 2.5 (0.2)
Change for the period 23.0 7.6
Equity at end of period 205.6 165.5
Group presentation – September 29th, 2015 23Cash Flow Statement
In € million H1 2015 H1 2014
Debt/(cash) at beginning of period (9.3) (3.2)
Debt/(cash) at end of period (9.8) (0.2)
Change in debt (0.5) (3.0)
Cash flow from consolidated companies 15.5 12.2
Change in working capital (3.9) 0.5
Net cash from operating activities 11.6 12.7
Net cash related to investment activities (6.8) (15.4)
Net cash related to financing activities (1.0) -
Net cash from capital transactions (3.2) -
Currency impact (0.1) (0.3)
Cash flow 0.5 (3.0)
Group presentation – September 29th, 2015 244. Outlook
25Profitable growth acceleration
1. Very good 2015 first-half semester
2. Pursuit of a profitable growth strategy based on a policy of innovation and
the development of high value-added products
3. Start of a new production line (Chargeurs Technical Substrates), the full
effect of which will be felt on 2016 results
è Renewed trust in achieving the target at the end of 2015 :
current operating income of at least €26 million
Group presentation – September 29th, 2015 26Appendices
27Market capitalization as of 2015/09/25: € 179 M
Share FR0000130692 (CRI)
Convertible Bond FR0010870931 (YCRI)
4415 083 convertible bonds were issued in March 2010 for € 22,8 M
4 5 557 convertible bonds were outstanding at August 31, 2015 representing, if converted, 177 824 shares
] maximum number of shares that may be potentially issuable at January 01, 2016 = 22 999 519
4Bonds that are not converted in 2015 will be redeemed at face value = 55€ plus a stock-based remuneration equal to
6.06 shares per bond
Group presentation – September 29th, 2015 282015 Financial Agenda Financial Information Third Quarter November 10 Contacts Chargeurs Investor Relations 112, avenue Kléber Cédric Ratouis 75 116 Paris - France Tel: +33 1 47 04 13 40 Financial Communications Email: contact@chargeurs.fr Pauline Bayec www.chargeurs.fr
You can also read