2016 Full Year Results Presentation - February 2017 - Open Briefing
←
→
Page content transcription
If your browser does not render page correctly, please read the page content below
2016
Full Year Results
                                                    February 2017
Presentation

 2016 Full Year Results Presentation   22/02/2017
                                                                    1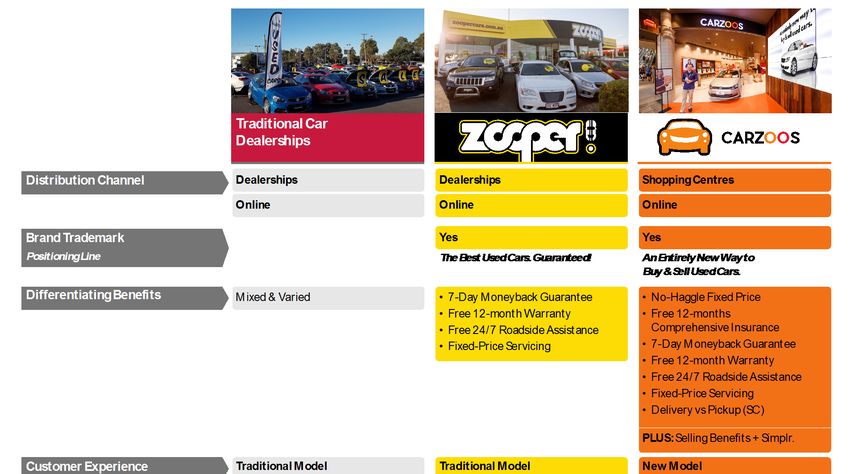
2016 Full Year Highlights

    • Record statutory profit before tax $141.4m, up 17%

    • Record net profit after tax $105.5m, up 21%

    • Record statutory (basic) EPS of 55.4 cents, up 16%

    • Record full year dividend of 35 cents, up 9%

    • Record results from core Car Retailing segment

    • Significantly improved result from Truck Retailing segment

    • Solid contribution from acquisitions

    • Gains from sale of property & investments

    • Strong balance sheet

2016 Full Year Results Presentation   22/02/2017
                                                                   2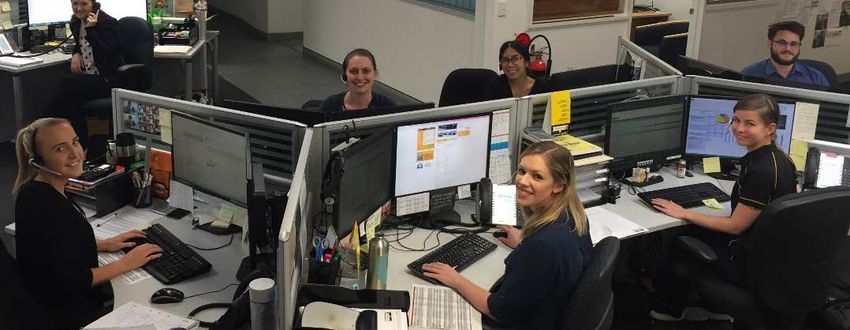
National Vehicle Sales

2016 Full Year Results Presentation   22/02/2017   3
                                                       3
Australian New Vehicle Sales – 2016

                                                   • New vehicle market up 2.0% YoY

                                                   • 2nd record year in a row

                                                   • WA down 5.6%; QLD down 1.1%

                                                   • NSW up 4.4%; SA up 3.9%; VIC up 3.4%

                                                   • Continued strong growth in luxury brands

                                                   • Some imbalance between supply and
                                                     demand

2016 Full Year Results Presentation   22/02/2017
                                                                                                4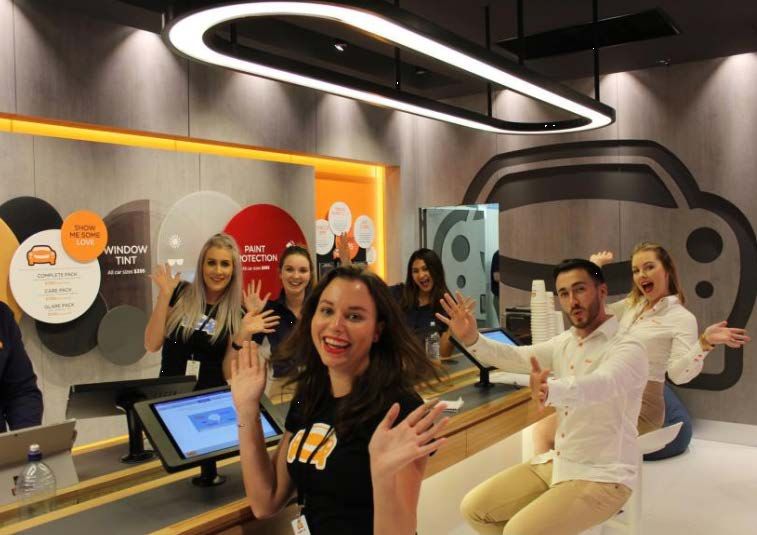
Volume and Luxury Brand Market Share – 2016

                Volume Brands Market Share                          Luxury Vehicles Market Share*

                                                   * Luxury is defined as luxury vehicle selling more than 500 units annually (V Facts)

2016 Full Year Results Presentation   22/02/2017                                                                       5
                                                                                                                                    5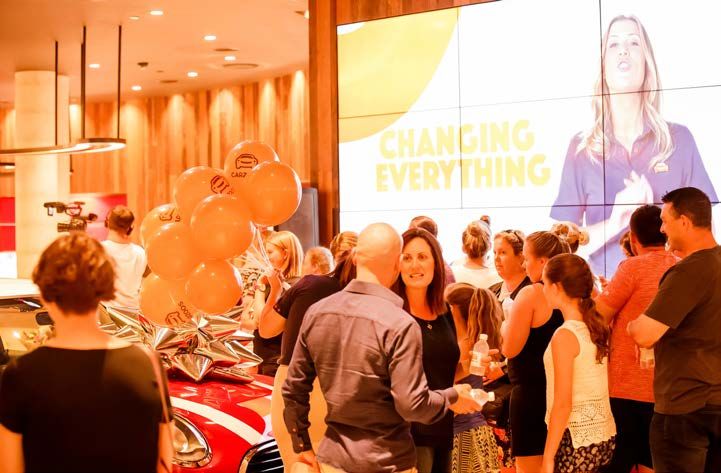
Volume and Luxury Brand Market Share – 2015

                Volume Brands Market Share                          Luxury Vehicles Market Share*

                                                   * Luxury is defined as luxury vehicle selling more than 500 units annually (V Facts)

2016 Full Year Results Presentation   22/02/2017                                                                       6
                                                                                                                                    6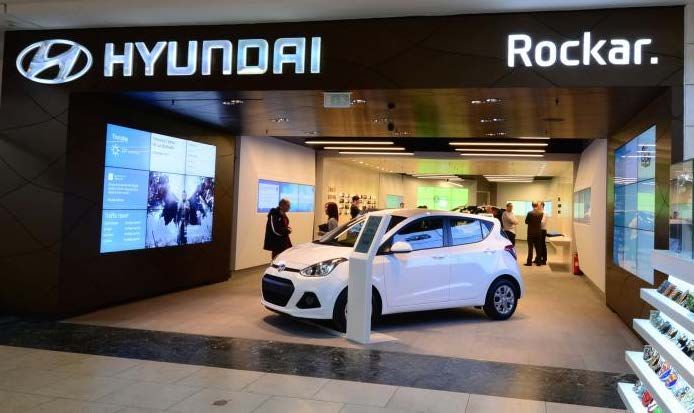
Vehicle Sales By Fuel Type
Electric vehicle sales down 80% YoY (excl. Tesla). Traditional fuels still make up ~99% of new vehicle sales

                                                        New Vehicle Sales by Fuel Type (2016 v 2015)
                                                                                                                                        2015           2016
                                                                                            -0.7%

                                                                                    773.9
                                                                                                     768.6

                                                                                                                     +8.7%

                                                                                                                              363.0

                                                                                                             334.1

                                                                                                                                              +2.9%

                                                                                                                                       32.2           33.1

                                        +4.0%

                                 12.1            12.6                -70.3%
       -80.2%

 1.1              0.2                                          2.1            0.6

       Electric                         Hybrid                        LPG                   Petrol                   Diesel           Heavy Commercial

2016 Full Year Results Presentation        22/02/2017                                                                                           7
                                                                                                                                                              7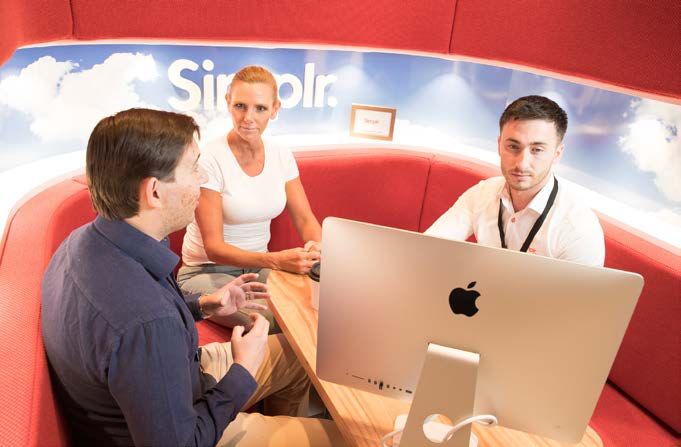
Exchange Rate Impact

    • 83% of cars sold in Australia are imported from Japan, Thailand, Korea and EU Countries

    • Manufacturers have long planning horizons and diversified exposures

           • Product and production planning based on 3-7 year cycles

           • Most manufacturers pursuing global common vehicle platform strategies

           • Generally large product runs based on supply of a common product to multiple markets

    • Manufacturer distribution margins (average between 7-10%) can wear some of the adjustment

    • Product specification can and does adjust to maintain price point

    • Australian market relatively accessible and marketing is cost effective, but highly competitive

    • Vehicle prices remain consistent with recent years

2016 Full Year Results Presentation   22/02/2017                                                        8
                                                                                                            8
Exchange Rates

2016 Full Year Results Presentation   22/02/2017
                                                   9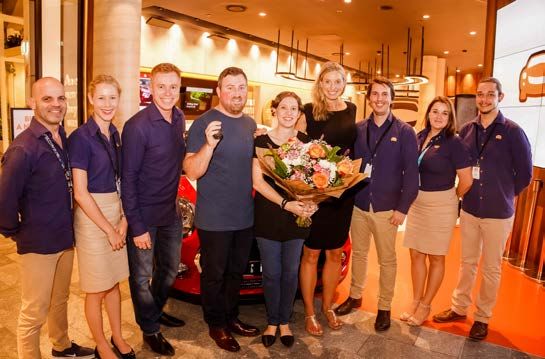
Affordability

2016 Full Year Results Presentation   22/02/2017
                                                   10
APE Vehicle Sales 2016
(1) Auction sales of 5,739 units excluded from total (2015: 5,748)
2016 Full Year Results Presentation 22/02/2017
112016 Full Year Highlights - Financial
• Record statutory (basic) EPS of 55.4 cents, up 16%
• Record fully franked final dividend of 22 cents, up 10%
• EBITDA increased to $179.8m, up 10%
• Underlying(1) net profit before tax increased to $137.5 million, up 9%
• Cash flow from operations increased to $110.7m, up 31%
• Continued financial strength and flexibility: - EBITDA/Interest cover 7.4 times (2016)
- EBITDA/Interest cover 7.6 times (2015)
(1) Underlying adjustments include Business acquisition costs $1.8 million (include taxes, legal and other costs associated with business acquisitions) and
benefit from tax refunds associated with previous years’ GST payments $4.4 million.
2016 Full Year Results Presentation 22/02/2017
12Financial Summary
$ Million 2016 2015 Change
Revenue 3,833.2 3,246.4 Up 18%
EBITDA 179.8 163.1 Up 10%
EBIT 165.8 142.3 Up 17%
PBT 141.4 121.0 Up 17%
PAT 105.5 87.0 Up 21%
Cash from operating activities 110.7 84.6 Up 31%
NTA/share 2.44 2.95 Down -17%
Net gearing excluding bailment debt 25.8% 19.6% Up 32%
2016 Full Year Results Presentation 22/02/2017
13Balance Sheet - Summary
2016
• New vehicle inventory funded by bailment ($M)
debt.
CA - CL (excl. held for sale) 142.7
• Parts and most used vehicle inventory is
balance sheet funded. Freehold Property (incl. held for sale) 298.5
• AHG, Smart Group and Cox Automotive Other Non Current Tangible Assets 68.4
Australia investments valued at $275.1m.
Investments 275.1
• Substantial property portfolio underwrites
the company’s financial position. Intangible Assets 298.9
Non Current Debt (283.7)
• NTA decreased by 17% to $2.44 per share
due to intangibles acquired as part of 2016 Other N/C Liabilities (Deferred tax, and
business acquisitions and lower value of (36.2)
provisions)
AHG investment (2016: $3.95/share v
2015: $4.52/share). Net Assets 763.8
2016 Full Year Results Presentation 22/02/2017
14Asset Fair Value Adjustments (before tax)
2016 2015
($M) ($M)
Balance Sheet
- Freehold Property + 12.1 + 2.2
- Investments - 36.8 + 46.2
Profit or Loss
- Investments + 2.0 + 3.5
- Freehold Property + 1.2 (2.1)
- Intangible Assets - (5.5)
Total -21.5 + 44.3
2016 Full Year Results Presentation 22/02/2017
15Earnings Per Share
EPS Bridge
58.0
0.4 1.8 1.7
9.4 1.5
57.0
56.0
55.4
55.0
54.0
53.0
Cents
52.0
51.0
50.0
49.0
48.0 47.6
47.0
46.0
2015 NPAT Operational AHG Investment Profit on Sale MTAI, Impairment, Dilution (EIP) 2016 NPAT
Result (net of interest) Property / Other Income,
Investments InterestExp.
2016 Full Year Results Presentation 22/02/2017
16Financial Summary - Cashflow
Cash Flow Bridge 2016
250.0
73.5 201.0
168.9 24.2
200.0
34.0
62.8 52.7
150.0
$ Milion
100.0 6.9
50.0
37.5
-
17.6
-
2016 Full Year Results Presentation 22/02/2017 15
17Financial Trends – Underlying PBT
* Operating Earnings is EBITDA Underlying excluding profit/loss on sale of assets and from associates. It includes AHG dividend.
** PBT Underlying excludes business acquisition costs, GST tax refunds and fair value adjustments relating to freehold property assets, goodwill and investments
2016 Full Year Results Presentation 22/02/2017
18Financial Trends
* Operating Earnings is EBITDA Underlying excluding profit/loss on sale of assets and from associates. It includes AHG dividend (from 2012).
2016 Full Year Results Presentation 22/02/2017
19Financial Trends
2016 Full Year Results Presentation 22/02/2017
20Financial Trends
2016 Full Year Results Presentation 22/02/2017
21Segment Results
Car retailing
Record car retail volumes in NSW with
positive contributions from acquisitions.
Strong trading in service business.
Truck retailing
Strong profit performance from truck
business despite continued challenging
new and used heavy truck trading
conditions. Significantly improved results
in used and service divisions.
Property
Cash from property sales received
$50.1m. 5 properties added to portfolio
in 2016.
Investment
Dividend income of $14.4m and
unrealised loss of $37.8m on revaluation
of AHG investment.
2016 Full Year Results Presentation 22/02/2017
22Segment Results – Car Retailing
2016 2015
($M) ($M)
• Record results with profit contribution
up 6.8% on prior year Revenue 3,449.7 2,884.7
• Record results for South Australia and Segment Profit before Tax 104.6 98.0
Newcastle dealership operations
Total Assets 1,067.5 732.8
• Increased asset base reflects
acquisitions across the year and Total Liabilities 661.2 476.0
hence only partial profit contribution
Net Assets 406.3 256.8
PBT/Revenue 3.0% 3.4%
RONA (after tax) 18.3% 26.9%
2016 Full Year Results Presentation 22/02/2017 16
23Segment Results – Truck Retailing
2016 2015
($M) ($M)
• Segment represents 9.5% of revenue
and 2.9% of net assets Revenue 363.8 345.1
• Strong profit performance from truck Segment Profit before Tax 6.3 (3.3)
business despite continued
challenging new and used heavy truck Total Assets 91.5 128.1
trading conditions.
Total Liabilities 69.1 99.6
• Significantly improved results in used
and service divisions.
Net Assets 22.4 28.5
PBT/Revenue 1.7% (0.9%)
RONA (after tax) 19.7% (13.8%)
2016 Full Year Results Presentation 22/02/2017 16
24Segment Results – Property
2016 2015
($M) ($M)
• Settlement of Fortitude Valley and
Woolloongabba properties Revenue 30.3 27.9
Segment Profit before Tax 16.2 16.2
• Revaluation gain of $12.1m, including
$1.2m through the statement of profit or Revaluation surplus/deficit
loss 12.1 0.1
before tax
• Acquired 5 new properties in 2016 Total Assets 320.8 343.7
including three dealership sites for the
Mercedes-Benz business in Victoria Total Liabilities 197.2 154.8
Net Assets 123.6 188.8
RONA Trading (after tax) 8.6% 4.9%
RONA incl revaluations
19.6% 6.1%
(after tax)
2016 Full Year Results Presentation 22/02/2017 16
25Segment Results – Investments
2016 2015
($M) ($M)
• Substantial asset balance providing
stable returns Revenue 14.4 13.8
Segment Profit before Tax 14.8 14.9
• Profit before tax excludes unrealised
revaluation loss on investments Revaluation surplus/deficit
(38.8) 46.2
before tax
• Realised further profits on sale of SIQ
shares in 2016 Total Assets 274.7 284.8
Total Liabilities 63.2 56.0
Net Assets 211.5 228.8
RONA Trading (after tax) 6.3% 5.3%
RONA incl revaluations
(11.4%) 26.5%
(after tax)
2016 Full Year Results Presentation 22/02/2017 16
26AHG Investment
• 66,320,000 shares held at 31/12/16 (19.99%)
• Investment valued at $261.9m at $3.95 (31/12/16)
• An unrealised revaluation loss of $37.8m within investment segment
• Share price (31/12/15) $4.52, (31/12/16) $3.95
• 5,415,650 new shares acquired in 2016 @ $4.52 (avg), costing $24.5m
• Subsequent to 31/12/16, additional 9,349,235 new shares acquired @ $3.90 (avg)
costing $36.4m. 75,669,235 shares held at 10/02/17 (22.82%)
• Fully Franked after tax dividends - Mar-16 $5.78m (2015 $5.48m)
- Oct-16 $8.54m (2015 $7.92m)
- Oct-16 $0.62m (2015 $Nil) (1)
(1) Attributable to additional shares purchased in 2016.
2016 Full Year Results Presentation 22/02/2017
27Cox Automotive Australia Investment - $10.0M
Completed Structure of the Combined Business
NOTE: The "UNDER CONSIDERATION" arrangements depicted above will not form part of the combined business on completion of the Scheme
of Arrangement. Cox Automotive may consider making them available to the combined business in future, but there is no obligation on Cox
Automotive to make them available within any timeframe, or at all. Accordingly there is no guarantee that those businesses will ever form part of
the combined business.
2016 Full Year Results Presentation 22/02/2017
28WHY USED CARS?
NEW CAR USED CAR
MARKET MARKET
Leading US Automotive Retailers Market Cap.*
Carmax 12.5Bn (21x)
Penske 4.4Bn (13x)
Autonation 4.8Bn (12x)
*Source: https://au.finance.yahoo.com/ as at 20/02/2017
2016 Full Year Results Presentation 22/02/2017
29THEORY & RATIONALE
Customers’ Perceptions of the Used
Car Buying Experience.
“Dealers do not have my best interests at heart.”
Commission based – it’s only about the sale
Try to upsell
Don’t care about what I need
Don’t tell the whole truth
2016 Full Year Results Presentation 22/02/2017
30USED CAR PORTFOLIO STRATEGY:
… ZOOPER + CARZOOS TO MEET EACH CONSUMER NEED
2016 Full Year Results Presentation 22/02/2017
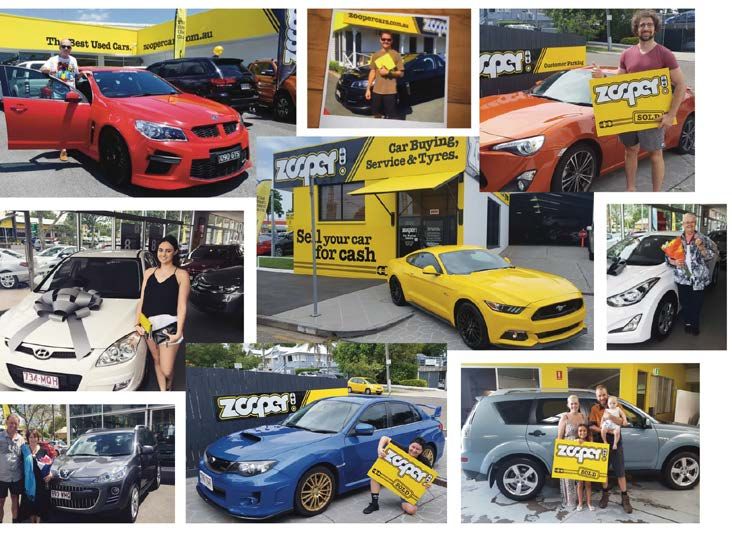
31ZOOPER! USED CARS
2016 Full Year Results Presentation 22/02/2017
32GLOBAL TREND: AUTOMOTIVE RETAIL IN SHOPPING MALLS
2016 Full Year Results Presentation 22/02/2017
33CARZOOS
2016 Full Year Results Presentation 22/02/2017
34LEARNINGS TO DATE:
Carzoos Retail Store Adoption*
*Retail store walk-ins only. Excludes inventory driven
appointments
2016 Full Year Results Presentation 22/02/2017
35Simplr. Finance
2016 Full Year Results Presentation 22/02/2017
362017 Focus
• Continued development of Used Car Strategy Zooper and Carzoos, supported by Simplr
• Further EPS growth for Birrells, Crampton and Tony Ireland group acquisitions
• Renewed focus on all business processes to deliver optimal operating cost
• Implement already prepared scenario plans should ASIC announce regulatory rule changes on
Finance & Insurance (18 month lead time expected)
• Carefully selected earnings accretive dealership and ancillary market acquisitions
2016 Full Year Results Presentation 22/02/2017
37Disclaimer
• The information in this document (information) does not contain all information necessary for investment decisions,
is not intended to be an offer, invitation or recommendation with respect to shares, is not financial product advice,
and is intended to be general background information on A.P. Eagers Limited (APE).
• Investors should consult with their own professional advisers.
• No representation or warranty is made as to the accuracy, adequacy, reliability or completeness of the information.
• This document does is not, and should not be relied upon as, a promise, representation, warranty or guarantee as to
the future performance of APE.
• This document may contain forward-looking statements, forecasts and estimates (forward-looking statements),
including anticipated future performance of APE and the market in which it operates.
• Forward-looking statements are based on certain key expectations and assumptions of known and unknown risks,
uncertainties and other factors, which are deemed reasonable when made but may or may not prove correct. Actual
events are difficult to predict and may depend upon factors beyond APE’s control. Therefore, actual results may turn
out to be materially different from any future results, performance or achievements express or implied by the
forward-looking statements.
• Forward-looking statements only speak as of the date of this document and no representations are made as to the
accuracy or fairness of such forward-looking statements. APE disclaims any obligation to update any forward-looking
statements, to reflect any change in APE’s expectations with regard thereto, or any change in events, conditions or
circumstances on which the statements are based.
2016 Full Year Results Presentation 22/02/2017
38Appendix
2016 Full Year Results Presentation 22/02/2017
39A.P. Eagers
COMPANY PROFILE
2016 Full Year Results Presentation 22/02/2017
40AP Eagers Today (December 2016)
• 104 year old automotive retail group founded in 1913
• 60 years as a listed public company – dividend paid every year
• A.P. Eagers owns $299m of prime real estate
• Represents all 20 of the top 20 selling vehicle brands in Australia and
33 car brands in total along with 14 truck / bus brands
• 4,490 employees 140+ dealership locations in QLD, NT, NSW, VIC, TAS and SA
• 19.9% ownership of Automotive Holdings Group ($262.0m*)
• 25.8% ownership of DealerMotive ($10.0m)
* As at 31 December 2016
2016 Full Year Results Presentation 22/02/2017
41AP Eagers Volume Car Brands
Represents 10 of the top 10 selling volume car brands in Australia
2016 Full Year Results Presentation 22/02/2017
42AP Eagers Luxury* Car Brands
Represents 10 of the top 11 selling luxury car brands in Australia
* Luxury is defined as a luxury vehicle selling more than 500 units annually (per VFACTS)
* Maserati sold 483 units in 2016 (2015: 519 units)
2016 Full Year Results Presentation 22/02/2017
43AP Eagers Truck and Bus Brands
Representing 14 truck and bus brands
2016 Full Year Results Presentation 22/02/2017
44Revenue by State / % of group Revenue
AP Eagers $3.83 billion revenue
$0.15bn (4%)
$1.81bn (47%)
$0.0bn $0.64bn (17%)
$0.75bn (20%)
$0.33bn (9%)
$0.16bn
(4%)
2016 Full Year Results Presentation 22/02/2017
45Income Opportunity Franchised Dealership
NEW CAR SALES: + Accessories + Finance + Insurance + Car Care + Trade-In
USED CAR SALES: + Accessories + Finance + Insurance + Car Care + Trade-In
VEHICLE SERVICE: - Value add products i.e. Tyres, wheel alignments, batteries, wiper blades.
VEHICLE REPAIR: - Warranty (Manufacturer pays) and Non Warranty (Customer pays)
- Internal reconditioning of Used Cars
PARTS SALES: - Internal (Service, warranty repair, non-warranty repair, accessories)
- External (Retail – dealership direct to customer)
- External (Wholesale / Trade – large distribution centres deliver to customers)
- Hard parts (Panel) + Mechanical parts
TARGET BASED - Volume, Market Share, Franchise Standards, Customer Satisfaction
INCENTIVES:
2016 Full Year Results Presentation 22/02/2017
46You can also read