Analysis & Comments - NDSU Agriculture
←
→
Page content transcription
If your browser does not render page correctly, please read the page content below
Analysis & Comments
                           Livestock Marketing Information Center
                           State Extension Services in Cooperation with USDA

                                                                                    February 11, 2020
                                                                                            Letter #7
www. l m ic. i nfo

      Sheep and Lamb: Inventory, Imports, New Plant, Etc.
              Two unusual developments could factor into the lamb market calculus during the next
     12-24 months. First, the growth rate of U.S. lamb and mutton imports may moderate
     significantly as the Australian flock has downsized due to drought, and China imports more-and-
     more of all animal-based proteins driven by African Swine Fever epidemic inducing reductions
     in their pork production. However, in the near-term, the China story has a new dimension of
     uncertainty with the Novel coronavirus epicenter in Wuhan, China. Second, 2020 brings on-line
     both opportunities and potential disruptions to the sector -- the opening of a modern Federally
     Inspected lamb packing plant in Colorado (Colorado Lamb Processors near the town of Brush).
     That state-of-the-art plant is scheduled to begin harvesting animals late in the first quarter of the
     year, or early in the second.

              In the face of the developments listed above, for the next two years, annual changes in the
     supply of U.S. lambs are expected to be rather modest. Across the lamb complex, prices in 2019
     were mostly stronger. For the year, the lamb cutout (carcass equivalent wholesale) value
     increased by 3.2% ($10.63 per cwt.), slaughter lamb (national formula dressed) by 5.4% ($14.61
     per cwt.), and feeder lamb (3-market average 60-to 90-pounds) were essentially unchanged. It is
     realistic to post year-over-year increases in lamb and sheep prices in 2020 and at least well into
     2021. Importantly, the two unusual developments described above, provide uncertainty
     regarding how much U.S. prices increase and how volatile markets are.

                               Sheep and Lamb Numbers in the U.S.
              As of January 1, 2020, the U.S. sheep and lamb count totaled 5.2 million head, slipping
     year-over-year by about 30,000 animals (down 0.6%), according to the annual USDA National
     Agricultural Statistics Service (NASS) survey of producers. The national number of ewes one
     year and older declined by 20,000 head compared to a year ago. Even though those counts were
     record-small, the NASS report showed signs of stabilization. Animals under one year old being
     held for replacement (future breeding) purposes were up by 10,000 head (rising 1.5%). In terms
     of total breeding animals (ewes, replacement lambs, and rams), of the 33 states individually
     reported by NASS, 18 increased from a year ago.
Page 2

        NASS reported the 2019 U.S. lamb crop was a modest 5,000 head below 2018’s. At 3.23
 million animals, the 2019 lamb crop matched the record low set in 2017. The lambing
 percentage rebounded from that of recent years to the highest since 2014. As of January 1, there
 were 1.39 million market lambs, which was an annual drop of 20,000 animals (-1.4%).

        USDA’s Agricultural Marketing Service (Market News Division) estimates the number
 of lambs on-feed in Colorado, the largest U.S. lamb feeding state. That number was below a
 year ago throughout 2019. The latest monthly count (February 1, 2020) was 127,621 animals,
 down over 25,000 head (-16.5%) compared to a year ago. Those reductions are in-line with the
 national drop in inventory numbers reported by NASS.

                             Domestic Production and Stocks
         In 2019, U.S. commercial lamb and mutton production totaled 148.1 million pounds.
 That was down 3.3% year-over-year, yet it was 2.0% above the record low set in 2017.
 Commercial slaughter in 2019 was just over 2.3 million animals, a 2.3% increase compared to
 the prior year. Average dressed weights dropped during each quarter of the year, with a large
 annual decline of 5.6%, as animals were sought-out by packers. Demand for slaughter lambs by
 commercial packers kept pulling animals through finishing programs quicker than in recent
 years, keeping carcass weights down.

 U.S. Frozen Tonnage Large, But Diminishing

         As of the end of December 2019, frozen stocks (cold storage) in the U.S. of lamb and
 mutton were 4.7% below 2018’s level at 34.8 million pounds (product weight). That was down
 from the end of December all-time high set in 2015 (41.5 million pounds). Still, that was 13.8%
 above the prior 5-year average (2013-17) and burdensome by any long-term historical measure.
 Critically, that tonnage is equivalent to about ten weeks’ worth of domestic production and 19%
 of annual disappearance. In comparison to other red meats, lamb and mutton stocks are a much
 more important market factor and deserve close monitoring.

        Year-over-year for the first nine months of 2019, U.S. lamb and mutton frozen stocks
 were above 2018. But then, the last three reports of the year had declines. Most, if not all, of
 2020 is forecast to bring declines compared to a year ago. Still, a significant seasonal build-up
 into August is to be expected. Little if any increase in domestic production combined with lower
 lamb and mutton imports should continue trimming frozen stocks relative to 2019’s.

 Output Forecasts: 2020 and 2021

        For calendar year 2020, U.S. commercial production is forecast to be slightly lower year-
 over-year (147 million pounds carcass weight), if average dressed weights remain subdued like
 what occurred in 2019. Declines in carcass weights are forecast to be much less impactful
LMIC                                                                                           Page 3

  during 2020 than they were in 2019. Carcass weights could post increases year-over-year during
  the second half of 2020. Indeed, lamb feeders need to plan ahead and not back-up market-ready
  animals as the industry incorporates the timelines and potential challenges that result from the
  packing plant adjustments occurring in Colorado and maybe elsewhere.

         In 2021, U.S. commercial lamb harvest is forecast to increase with modest growth in the
  national flock. Those increases may be compounded by heavier carcass weights resulting in
  production rising 1% to 3%. That translates into commercial production in the range of 148 to
  151 million pounds, which would be the largest since 2018 (153.2 million pounds).

        International Trade Dimensions: U.S. Imports, China, and Australia
         The U.S. exports a very small percentage of its lamb and sheep meat (mutton)
  production. Most of the tonnage is mutton to Mexico, Caribbean countries, and the United Arab
  Emirates. However, the U.S. imports more lamb and mutton than is produced domestically.
  Almost exclusively, imports are from Australia and New Zealand, and the bulk was lamb (80%
  in 2019).

          Importantly, for several years, and throughout 2019, Australia faced a multi-year drought,
  which was especially problematic in their regions with the largest sheep numbers. Meat and
  Livestock Australia recently forecast that as of June 2020, that their national flock would be 63.7
  million head and 12% smaller than mid-year 2017’s. Australian sheep and lamb slaughter
  declined in 2019 even with high ewe slaughter due to a smaller lamb crop (fewer ewes and
  historically low lambing rates). New Zealand did not face drought.

         Demand for Oceana (Australia and New Zealand) lamb and mutton by China and the
  U.S., was exceptionally strong in 2019, supported in part by depreciating currencies, especially
  the Australian dollar. The rapidly emerging pork shortage in China caused by African Swine
  Fever has underpinned demand. Mainland China for the last 12-months (through January 2020)
  increased lamb and mutton purchases by 43% (product weight) year-over-year. In 2019, U.S.
  lamb imports were 6.2% above 2018’s, continuing the long-term trend of setting new records. In
  contrast, for the year, mutton imports dropped by 19.5%. Combined U.S. lamb and mutton
  imported tonnage declined very slightly (below 1%) year-over-year. Compared to five years ago
  (2015), last year the U.S. imported 32.8% and 77.5% more lamb and mutton, respectively.

           Even though the Australian drought-induced large slaughter levels, strong international
  demand helped underpin their lamb and mutton prices. That provides an economic foundation
  and confidence for many producers to begin rebuilding their flocks as forage conditions improve.
  Still, there are biological lags to the recovery of grasslands and establishing larger lamb crops.

         LMIC forecasts a small drop (1% to 4%) in U.S. lamb and mutton tonnage imported in
  2020, but relatively high prices adjusted for exchange rates may continue attracting lots of
Page 4
foreign products, especially lamb items. A more modest slight year-over-year decline could be
repeated next year. Still, imported tonnage is expected to remain above 2017’s level.
U.S. Price Prospects
A new packing plant in Colorado and uncertain U.S. lamb and mutton imports from
Australia are just two factors that make price forecasts for this sector even more difficult than
usual. Indeed, the potential for price volatility is magnified. As always, Mother Nature could
throw a curveball in the U.S. and/or Australia. Flock changes in the U.S have been rather
constrained in recent years, and there is potential for modest growth during 2020 and into 2021.
To maintain wholesale, slaughter, and feeder prices at or above 2019 levels, we have two
cautions or keys for the U.S. industry: 1) keeping frozen stocks from returning to burdensome
levels; and 2) feedlots resisting any temptation to delay marketings of slaughter-ready animals.
With the U.S. production levels and imports discussed in prior sections of this newsletter,
the supply side of the marketplace suggests steady to higher annual prices in both 2020 and
2021. The retail demand profile for lamb in the U.S. looks like it has been strong, and there may
not be much slippage. To date, a very robust U.S. consumer has more than counterbalanced
weakness in the manufacturing sectors. However, there are reasons for some key big picture
concerns. Specifically, the potential headwind is the intersection of two forces. First, would be a
slow-down in macroeconomic conditions. Alone that would be negative, but it could become a
major headwind because of the huge ramp-up that is occurring in U.S. pork and poultry
production. U.S. per capita supply of all red meat and poultry was record large in 2019, and
2020 will bring significantly more, and that assumes exports of beef, pork, chicken, and turkey
all establish new all-time highs. Over the years, economic analysis has shown that large
domestic pork supplies, which in-turn depress ham prices, tend to impact lamb demand
negatively. Lamb legs and hams are both “holiday meals.”
Overall, for the first three quarters of 2020, look for lamb prices (slaughter and feeder) to
be at or above 2019’s. For slaughter lambs, the largest percentage year-over-year gain is
expected to be in the first quarter (see table). The second quarter may bring the biggest gain
from 2019’s for feeder lambs. Note that the first quarter of 2019 had very low slaughter lamb
prices compared to the balance of that year. Even though lamb supplies should remain tight
during the fourth quarter, the LMIC price forecast incorporates some pressure from competing
meats, especially huge pork supplies. Still, lamb prices that quarter may be very close to 2019’s.
Regarding longer-term producer planning prices, 2021 has the potential for further
macroeconomic challenges. Another Great Recession does not look likely this year or next, any
recession may be much more modest in magnitude and duration. LMIC’s preliminary outlook is
for prices to remain close to unchanged year-over-year.LMIC Page 5
QUARTERLY COMMERCIAL SHEEP AND LAMB SLAUGHTER, PRODUCTION,
PER CAPITA LAMB DISAPPEARANCE AND LAMB PRICES a 02/11/20
7.705
% Chg. Average % Chg. Comm'l % Chg. Per Capita % Chg. Sl. Lambs % Chg. Lamb % Chg.
Year Comm'l from Dressed from Lamb from Consump- from Natl. Direct from 3-Market Avg from
b c
Quarter Slaughter Year Ago Weight Year Ago Production Year Ago tion Year Ago Carc. Weight Year Ago Live 60-90 lbs Year Ago
(1,000 Head) (Lbs.) (Mil. Lbs.) (Retail Wt.) ($/Cwt.) ($/Cwt.)
2018
I 546 2.5 70 0.7 38.4 3.2 0.32 -1.2 262.46 -4.0 214.43 1.2
II 564 2.9 68 5.1 38.6 8.1 0.26 0.1 276.30 -12.5 194.68 -12.3
III 558 3.7 66 1.4 37.0 5.1 0.29 20.1 281.87 -13.8 144.64 -15.4
IV 597 6.8 66 -1.1 39.2 5.7 0.27 2.3 271.17 -4.7 156.08 -6.0
Year 2265 4.0 68 1.5 153.2 5.5 1.13 4.7 272.95 -9.1 177.46 -7.9
2019
I 547 0.1 67 -4.5 36.7 -4.4 0.33 3.9 264.96 1.0 187.94 -12.4
II 620 10.0 64 -5.8 40.0 3.6 0.28 9.6 292.13 5.7 173.41 -10.9
III 569 2.1 62 -6.3 35.4 -4.3 0.24 -17.9 297.77 5.5 165.42 14.4
IV 582 -2.6 62 -5.7 36.0 -8.2 0.29 7.8 295.37 9.0 182.53 16.9
Year 2318 2.3 64 -5.6 148.1 -3.3 1.14 0.6 287.56 5.4 177.33 -0.1
2020
I d 588 7.4 65 -3.2 38.2 4.0 0.34 1.9 287-289 8.7 192-198 3.8
II e 573 -7.6 64 -1.2 36.5 -8.7 0.29 3.4 288-293 -0.6 189-194 10.4
III 570 0.2 62 -0.3 35.4 -0.1 0.26 11.3 298-304 1.1 171-177 5.2
IV 584 0.4 62 0.2 36.2 0.7 0.25 -13.1 291-298 -0.3 180-187 0.5
Year 2315 -0.1 63 -1.2 146.3 -1.2 1.14 0.3 292-295 4.5 183-189 4.5
2021
I 592 0.8 66 1.7 39.2 2.6 0.31 -6.5 280-286 -1.7 191-199 0.0
II 575 0.3 64 0.9 36.9 1.1 0.28 -3.0 288-297 0.7 190-199 1.6
III 575 0.9 63 0.8 36.0 1.8 0.26 -0.5 297-307 0.3 172-184 2.3
IV 582 -0.3 63 1.5 36.7 1.2 0.25 -2.2 287-298 -0.7 174-189 -1.1
Year 2325 0.4 64 1.2 148.7 1.7 1.10 -3.3 289-296 -0.3 182-193 0.8
a/ Totals may not add due to rounding. d/ Estimated quarter
b/ Slaughter lamb prices are formula purchases on a dressed weight basis. e/ Forecasted quarters
c/ Feeder Lamb Prices are a three market (CO, SD, & TX) average; live weight basis.
Sources: Livestock Slaughter - USDA Publications: Lamb Prices - USDA Livestock Market News: Forecasts - LMIC Projections
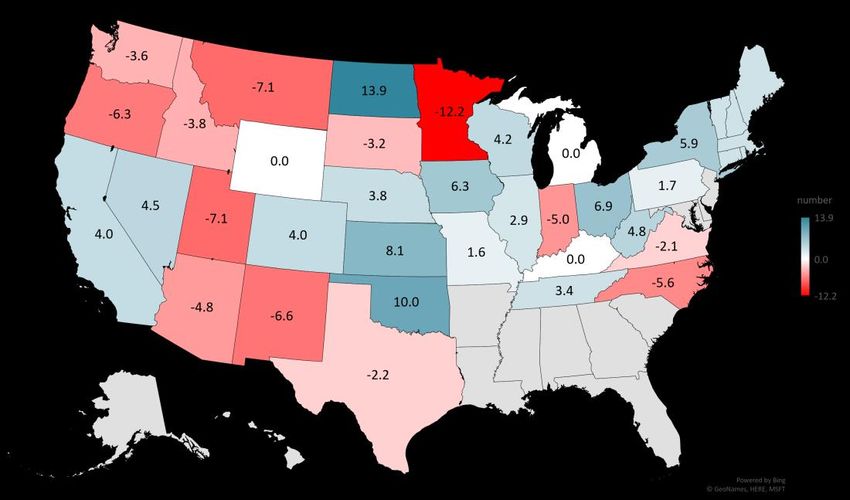
% CHANGE BREEDING EWES - ONE YEAR & OLDER
JANUARY 1, 2019 TO JANUARY 1, 2020
New England 3.3
Other States 0.0
U.S. Total -0.7
Data Source: USDA-NASSPage 6
COMMERCIAL LAMB AND MUTTON PRODUCTION
US, Quarterly
Mil. Pounds
41.0
40.0
39.0
38.0
37.0
36.0
35.0
34.0
33.0
JAN-MAR APR-JUN JUL-SEP OCT-DEC
Avg. 2014/18 2019 2020 2021
Data Source: USDA-NASS, Forecasts by LMIC
U.S. LAMB AND MUTTON IMPORTS
As a Percentage of Production, Carcass Weight , Annual
Percent
200
180
160
140
120
100
80
60
40
20
0
1996 1999 2002 2005 2008 2011 2014 2017 2020
Data Source: USDA-ERS & USDA-FAS, Compiled and Forecasts by LMICYou can also read