HALF-YEAR RESULTS TO 31 DECEMBER 2020 - FEBRUARY 2021 - AFR
←
→
Page content transcription
If your browser does not render page correctly, please read the page content below
H ALF -YE AR RE S ULTS
TO 31 DE CE MB E R 2020
FEBRUARY 2021
I M P O RTA N T
NOTICE
The information provided in this presentation should be considered together with the
financial statements for the period and previous periods, ASX announcements and other
information available on the Trust’s website.
This presentation has been prepared by BWP Management Limited as the responsible
entity for BWP Trust. The information provided is for information purposes only and does
not constitute an offer to arrange to issue securities or other financial products, nor is it
intended to constitute legal, tax or accounting advice or opinion. The information
contained in this presentation is not investment or financial product advice and is not
intended to be used as the basis for making an investment decision. This presentation
has been prepared without taking into account the investment objectives, financial
situation or particular needs of any particular person.
All reasonable care has been taken in preparing the information contained in this
presentation, however no representation or warranty, express or implied, is made as to
the fairness, accuracy, completeness or correctness of the information, opinions and
conclusions contained in this presentation. Without limiting the preceding sentence, no
representation or warranty, express or implied, is given as to the accuracy, completeness,
likelihood of achievement or reasonableness of any forward-looking statements, forecasts,
prospects or returns contained in this presentation. Such forward-looking statements,
forecasts, prospects or returns are by their nature subject to significant uncertainties and
contingencies, many of which will be outside the control of BWP Trust or BWP
Management Limited. Also, past performance is no guarantee of future performance.
Before making an investment decision, you should conduct your own due diligence and
consult with your own legal, tax or accounting adviser as to the accuracy and application
of the information provided in this presentation and in respect of your particular
investment needs, objectives and financial circumstances.

HALF-YEAR RESULTS TO 31 DECEMBER 2020                                                           2
P R E S E N TAT I O N O U T L I N E

Michael Wedgwood                        > Summary
Managing Director
BWP Management Limited                  > Results

Andrew Ross                             > Portfolio
Head of Property
BWP Management Limited                  > Core portfolio

David Hawkins                           > Alternative use properties
Finance Manager
BWP Management Limited                  > Capital management

                                        > Outlook

HALF-YEAR RESULTS TO 31 DECEMBER 2020                                  3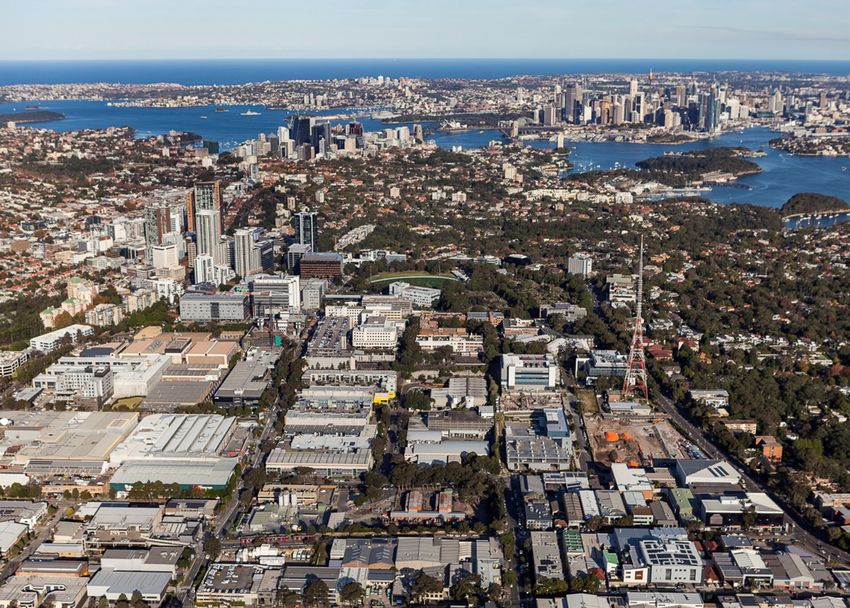
SUMMARY
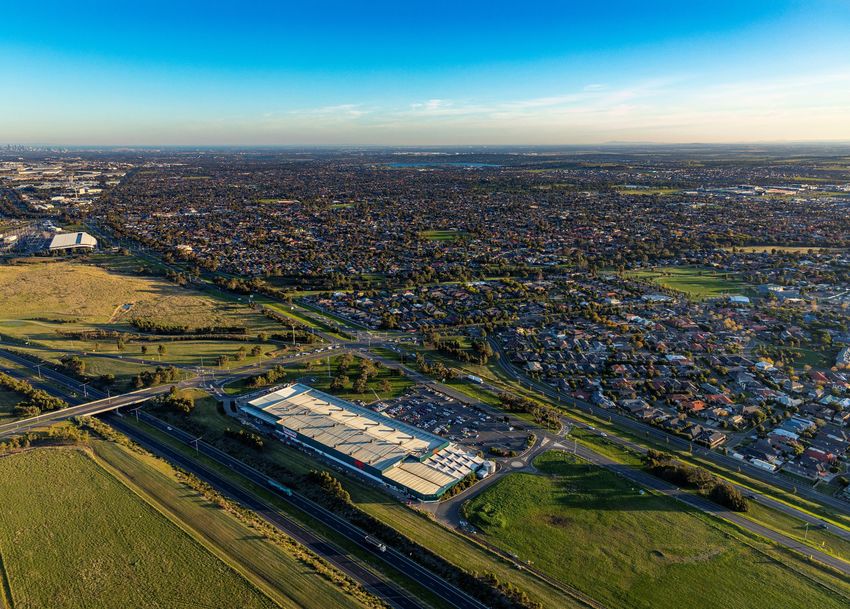
Caroline Springs, QLD
SUMMARY | HALF-YEAR RESULTS TO 31 DECEMBER 2020 4
2 0 2 0 / 2 1 H A L F -Y E A R R E S U LT S AT A G L A N C E
              $76.1m                             $57.9m                 9.02 cpu                 $3.20 ⇧                 16.3% pa
              Total revenue1                     Dist. Profit1       Ordinary distribution1      NTA 5.3%2               10 yr total return

                    PORTFOLIO                                       PORTFOLIO                                  CAPITAL
                   PERFORMANCE                                     MANAGEMENT                                MANAGEMENT

                           2.0%                                           99.0%                                A- S&P rating/
                  like-for-like rental growth                     rent collected during period           A3 Moody’s rating maintained

                     $87.1 million3                                     $403,868                                   17.8%
                  portfolio revaluation uplift                    rent abatements for Code of
                                                                                                                    gearing
                                                                 Conduct tenants during period

                                                                             9                                    $135m
                          5.84%                                     Bunnings Warehouse                bank facility extended by a further
                      portfolio cap rate                             options exercised                  year subsequent to period end

                        4.3 years                                         97.4%                                     3.2%
                       portfolio WALE                               available space leased             cost of debt at 31 December 2020

        1   In line with prior corresponding period.
        2   In comparison to prior corresponding period.
        3   Gross movement in valuations an $88.0 million revaluation gain before adjustments made for straight-lining of rent.

SUMMARY | HALF-YEAR RESULTS TO 31 DECEMBER 2020                                                                                               5
R E S U LT S
R E S U LT S
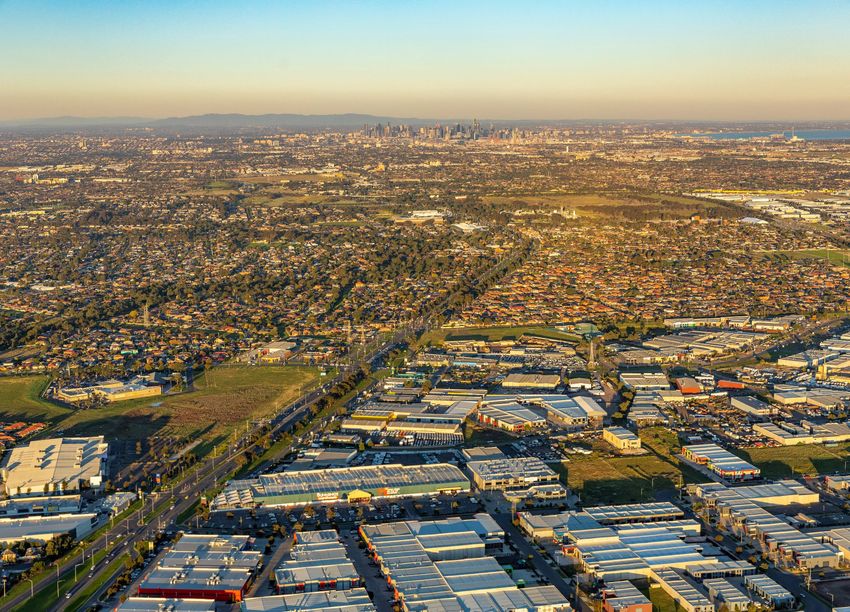
Artarmon, NSW
RESULTS | HALF-YEAR RESULTS TO 31 DECEMBER 2020 6
F I N A N C I A L P E R F O R M A N C E 6 M O N T H LY

                                                                      6 months to Dec 20                  6 months to Dec 19
Total revenue                                                                                 $76.1m                            $76.2m
Management expense ratio1                                                                       0.64%                             0.63%
Other expenses                                                                                  $4.3m                             $4.2m
Net profit (excluding revaluations)                                                           $56.9m                             $57.2m
Property net revaluation gains                                                                $87.1m2                          $78.5m2
Net profit including property revaluations                                                   $144.0m                           $135.6m
Number of units on issue3                                                                     642.4m                            642.4m
Six months distribution per unit                                                           9.02 cents                        9.02 cents
Total assets3                                                                             $2,596.1m                         $2,487.1m
Borrowings3                                                                                  $462.2m                           $447.0m
Weighted average cost of debt4 (p.a.)                                                            3.2%                              3.5%
Net tangible assets per unit3                                                                    $3.20                             $3.04
Weighted average cap rate                                                                       5.84%                             6.08%
1   Expenses other than property outgoings and borrowing costs as a percentage of average total assets.   *figures above subject to rounding
2   After adjustments made for the straight-lining of rent.
3   As at the respective period end rather than for six months to.
4   Finance costs divided by average borrowings for the six months.
RESULTS | HALF-YEAR RESULTS TO 31 DECEMBER 2020                                                                                                7
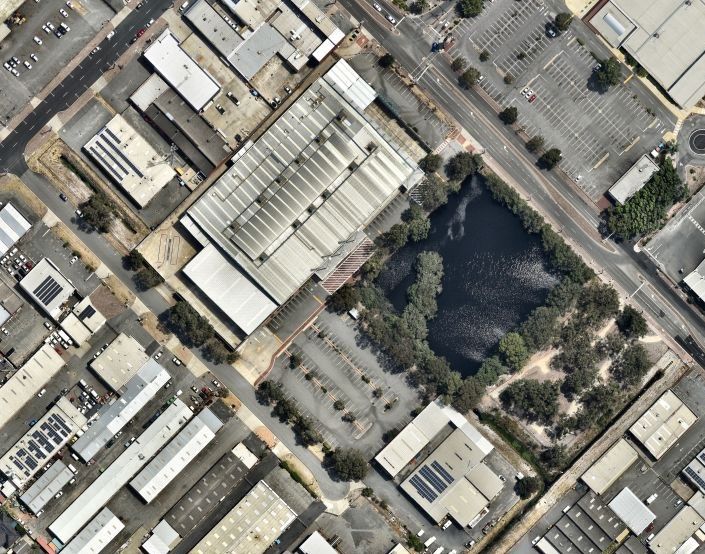
P O RT F O L I O

Rydalmere, NSW

PORTFOLIO | HALF-YEAR RESULTS TO 31 DECEMBER 2020   8
BUNNINGS RENT REVIEW
OUTCOMES

> Annual like-for-like rental growth across portfolio 2.0%

> Eight Bunnings                                                    Passing             Reviewed      Variance           Effective
                              Property Location
  market rent                                                    rent ($pa)            rent ($pa)          (%)               date
  reviews were             Wollongong, NSW1,2                      1,469,571            1,405,000           (4.4)          9-Feb-18
  resolved during          Villawood, NSW          1,3
                                                                   1,738,610            1,827,000             5.1        14-May-18

  the half-year            Browns Plains, QLD             2,4
                                                                   1,791,153            1,793,000             0.1         7-May-19
                                                    3,5
                           Thornleigh, NSW                         1,420,291            1,420,291                -        6-Sep-19
                           Maitland, NSW3,5                        1,451,887            1,451,887                -       18-Oct-19
                                         2,5
                           Albany, WA                                904,854              790,000          (12.7)         1-Nov-19
                                               2,5
                           Bibra Lake, WA                          1,757,639            1,671,000           (4.9)         1-Nov-19
                                               3
                           Northland, VIC                          2,029,869            2,029,869                -       19-Aug-20
                           Total/ W eighted Average              12,563,874        12,388,047               (1.4)
                          1The market rent review was due during the year ended 30 June 2018, but the outcome was finalised during the
                          current financial year.
                          2   The market rent review was determined by an independent valuer.
                          3   The market rent review was agreed between the parties.
                          4The market rent review was due during the year ended 30 June 2019, but the outcome was finalised during the
                          current financial year.
                          5The market rent review was due during the year ended 30 June 2020, but the outcome was finalised during the
                          current financial year.

PORTFOLIO | HALF-YEAR RESULTS TO 31 DECEMBER 2020                                                                                        9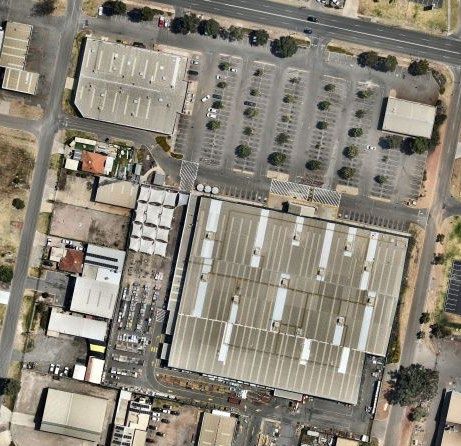
C A P I TA L I S AT I O N R AT E T R E N D S
> New Bunnings Warehouse store yields continue to tighten with the most recent
  transaction recorded at 4.2%
 10.00%

  9.00%

  8.00%

  7.00%                         Bunnings Portfolio
                                Acquisitions by BWP
  6.00%

  5.00%

  4.00%

  3.00%
       Jun-10 Dec-10   Jul-11   Jan-12 Aug-12 Mar-13 Sep-13 Apr-14 Nov-14 May-15 Dec-15   Jul-16   Jan-17 Aug-17 Feb-18 Sep-18 Apr-19 Oct-19 May-20 Dec-20

      New Bunnings Store Transactions         BWP Portfolio Cap Rate      Secondary Market Bunnings Transactions        Portfolio Transaction Average Cap Rate

PORTFOLIO | HALF-YEAR RESULTS TO 31 DECEMBER 2020                                                                                                                10
D E C E M B E R 2 0 2 0 R E VA L U AT I O N S
> December 2020 weighted average capitalisation rate 5.84 per cent (June 2020: 6.08
per cent)
– 11 independent valuations (15 per cent of BWP portfolio value), average cap rate
5.66 per cent
– 64 internal valuations, average cap rate 5.87 per cent
– Stand alone Bunnings Warehouses weighted average cap rate of 5.44 per cent
(ex-replacement stores)
– Cap rate movement; 56 properties decreased, 14 properties no change and five properties
increased
> HY 2020/21 gross fair value gain of $88.01 million on revaluation
– Rental growth and cap rate compression contributed to the net fair value gain
Revaluations by state Rental Cap rate Value
No. of properties
31 Dec 2020 $m/annum2 (%) ($m)2
NSW/ACT 18 35,833 5.86 614.4
QLD 19 38,640 5.86 655.2
SA 2 4,086 5.68 71.9
VIC 20 46,762 5.42 839.2
WA 16 25,652 6.69 393.9
Total/weighted average 75 150,974 5.84 2,574.6
1 Gross movement in valuations; statutory accounts reflect a $87.1 million revaluation gain after adjustments made for straight-lining of rent.
2 Subject to rounding.
PORTFOLIO | HALF-YEAR RESULTS TO 31 DECEMBER 2020 11DECEMBER 2020
I N D E P E N D E N T R E VA L U AT I O N S
Dec 2020 Dec 2020 Jun 2020 Jun 2020 Cap rate Valuation Dec 2020
Property State Cap Rate Valuation Cap Rate Valuation movement movement Term Certain
(%) ($m) (%) ($m) (%) ($m) (years)
Greenacre NSW 5.50 52.1 6.00 47.8 (0.50) 4.3 1.3
Belrose NSW 5.50 38.3 5.75 36.6 (0.25) 1.7 2.1
Artarmon NSW 5.50 31.0 5.75 29.7 (0.25) 1.3 2.1
Browns Plains QLD 5.75 49.6 6.00 47.0 (0.25) 2.6 3.4
Mt Gravatt QLD 5.75 23.0 6.25 21.3 (0.50) 1.7 5.0
Cairns QLD 8.50 8.5 8.00 9.0 0.50 (0.5) -
Hawthorn VIC 5.25 58.0 6.00 53.7 (0.75) 4.3 4.8
Nunawading VIC 5.25 49.1 5.50 46.9 (0.25) 2.2 4.1
Northland VIC 6.15 33.0 6.00 33.8 0.15 (0.8) 4.8
Rockingham WA 5.50 39.2 6.00 35.5 (0.50) 3.7 6.8
Port Kennedy WA 8.00 10.0 6.25 27.4 1.75 (17.4) 0.4
Total/ average 1 5.66 391.8 5.97 388.7 (0.32) 3.1 3.5
1 Figures subject to rounding.
PORTFOLIO | HALF-YEAR RESULTS TO 31 DECEMBER 2020 12CORE
P O RT F O L I O
Craigieburn, VIC
CORE PORTFOLIO | HALF-YEAR RESULTS TO 31 DECEMBER 2020 13C O R E P O RT F O L I O
SUMMARY
64 4.5 years
properties portfolio WALE
3.3 ha 14,148m2
average land average lettable
area area
72%
84%
upgrade
metro located
properties or
properties
occupiedW E I G H T E D AV E R A G E L E A S E E X P I R Y
PROFILE
30%
25%
20%
% of Rental Income
15%
10%
5%
0%
CY21 CY22 CY23 CY24 CY25 CY26 CY27 CY28 CY29 CY30 Beyond
Showrooms BWH >12 years occupancy BWHLEASE EXPIRIES NEXT THREE YEARS
> Five year options exercised for Belmont (WA), Caroline Springs (VIC), Cockburn (WA), Fairfield Waters (QLD),
Mt Gravatt (QLD), Pakenham (VIC), Smithfield (QLD) and Wagga Wagga (NSW) during the half-year
> 10 year option exercised for Broadmeadows (VIC) during the half-year
> Five year option exercised for Dubbo (NSW) in January 2021
Property Lease expiry Options Rent ($’000pa) Comments
Harrisdale Oct 2021 5 x 5 yrs 1,800 Notification required by Apr 2021
Geraldton Dec 2021 2 x 5 yrs 1,350 Notification required by Sep 2021
Mornington Dec 2021 2 x 5 yrs 1,760 Notification required by Sep 2021
Frankston Dec 2021 2 x 5 yrs 2,171 Notification required by Sep 2021
Gladstone Feb 2022 3 x 5 yrs 1,378 Notification required by Nov 2021
Greenacre Apr 2022 5 x 5 yrs 2,869 Notification required by Oct 2021
Craigieburn May 2022 5 x 5 yrs 1,773 Notification required by Nov 2021
Scoresby May 2022 2 x 5 yrs 1,986 Notification required by Feb 2022
Hervey Bay Dec 2022 1 x 5 yrs 1,356 Bunnings has obtained DA on adjoining site
Artarmon Feb 2023 3 x 5 yrs 1,705 Notification required by Nov 2022
Belrose Feb 2023 3 x 5 yrs 2,107 Notification required by Nov 2022
Wollongong Feb 2023 2 x 5 yrs 1,452 Notification required by Nov 2022
Balcatta Sep 2023 10 yrs 2,248 Notification required by Jul 2023
Southport Nov 2023 10 yrs 1,772 Notification required by Sep 2023
Tuggeranong Dec 2023 10 yrs 1,843 Notification required by Oct 2023
CORE PORTFOLIO | HALF-YEAR RESULTS TO 31 DECEMBER 2020 16A LT E R N AT I V E
U S E P R O P E RT I E S
Cairns, QLD
ALTERNATIVE USE PROPERTIES | HALF-YEAR RESULTS TO 31 DECEMBER 2020 17UNDERWOOD DIVESTMENT
> Strong returns achieved to date as a Bunnings Warehouse (refer table below)
> Bunnings relocated to a nearby site in 2018
> Pursued a number of re-development options, including for retail, large format retail, medical,
self-storage, industrial and last mile logistics – divestment yielded the best outcome
> Unconditional contract now in place with an unrelated third party, settlement scheduled for May
2021
> To be sold to a private owner occupier following a public expressions of interest campaign
Outcome
Purchase date October 1998
Purchase price $9.1 million
Additional capital invested $0.5 million
Total invested capital $9.6 million
Total rent received $24.4 million1
Average annual rent growth since
3.3% (CAGR)
inception
Sale price $16.0 million
Jun 2020 fair value $16.4 million
1 Excludes $1.7 million in forfeited deposit relating to a previous divestment that
did not proceed.
ALTERNATIVE USE PROPERTIES | HALF-YEAR RESULTS TO 31 DECEMBER 2020 18P O RT M A C Q U A R I E R E - P U R P O S I N G
Financial performance to end of Bunnings lease > Bunnings lease expired in November 2019
Purchase date November 2003 > Capital works completed in March 2020
Purchase price $7.5 million > 100% leased to Amart Furniture,
Body Fit Gym and Sydney Tools
Additional capital invested $0.5 million
Total invested capital $8.0 million
Total rent received $13.5 million
Average annual rent growth since
3.4% (CAGR)
inception
Jun 2019 fair value $11.0 million
Property financials re-purposing
Capex works $7.3 million
Dec 2020 fair value $17.6 million
Capitalisation rate 7.25%
WALE 8.5 years
ALTERNATIVE USE PROPERTIES | HALF-YEAR RESULTS TO 31 DECEMBER 2020 19MORLEY RE-PURPOSING
> Strong returns achieved to date as a Bunnings Warehouse (refer table below)
> Bunnings lease expired in July 2020
> Site previously re-zoned to allow for mixed use development
> Numerous re-purposing opportunities being considered including medical, large format retail,
retail, residential, entertainment/leisure/hospitality
Financial performance to date
Purchase date July 2005
Purchase price $11.1 million
Additional capital invested $1.4 million
Total invested capital $12.5 million
Total rent received $18.1 million
Average annual rent growth since
3.7% (CAGR)
inception
Dec 2020 fair value $16.0 million
ALTERNATIVE USE PROPERTIES | HALF-YEAR RESULTS TO 31 DECEMBER 2020 20MIDLAND RE-PURPOSING
> Strong returns achieved to date as a Bunnings Warehouse (refer table below)
> Bunnings relocated to a nearby site in December 2020
> Lease expiry in September 2021
> In discussions with several operators to lease site from October 2021
Financial performance to date
Purchase date September 2001
Purchase price $9.5 million
Additional capital invested $0.7 million
Total invested capital $10.2 million
Total rent received $26.3 million
Average annual rent growth since
4.1% (CAGR)
inception
Dec 2020 fair value $15.0 million
ALTERNATIVE USE PROPERTIES | HALF-YEAR RESULTS TO 31 DECEMBER 2020 21A LT E R N AT I V E U S E P R O P E RT I E S U P D AT E
Property Lease expiry1 Comments
Short term lease to Queensland Government for a pop-up sports arena
Cairns Expired
Concept and feasibility finalised for multi-tenanted industrial development
Belmont North Mar 2021 Considering redevelopment/divestment options. Re-zoning currently underway
Port Kennedy May 2021 Various options being considered for re-purposing
Mindarie Sep 2021 Conditional contract to sell with settlement scheduled in Jul 2021
Albany Oct 2024 Considering redevelopment/divestment options
Northland Aug 2025 Considering redevelopment/ divestment options
1 End of the current Bunnings lease term.
ALTERNATIVE USE PROPERTIES | HALF-YEAR RESULTS TO 31 DECEMBER 2020 22C A P I TA L
MANAGEMENT
Villawood, NSW
CAPITAL MANAGEMENT | HALF-YEAR RESULTS TO 31 DECEMBER 2020 23D E BT FA C I L I T I E S
> Average borrowings for the half-year $467.8 million (up 6.6 per cent on prior corresponding period)
– 3.2 per cent per annum weighted average cost of debt after hedging (2019: 3.5 per cent per
annum)
– Borrowing costs for the half-year $7.5 million (down 4.1 per cent on prior corresponding period)
> Bank facilities with CBA and WBC can be extended a further year each year, subject to agreement.
The WBC facility was extended for a further one year subsequent to the period end
> Cost of debt at 31 December 2020: 3.2 per cent per annum
> Interest cover: 8.8 times at 31 December 2020 (2019: 8.5 times)
> Gearing: 17.8 per cent at 31 December 2020 (2019: 18.0 per cent)
> A- / Stable S&P rating and A3 Moody’s rating
As at 31 December 2020 Limit ($m) Drawn ($m) Expiry
CBA 110 48 31 Jul 2022
WBC 135 51 30 Apr 2022
SMBC 100 100 20 May 2024
Corporate bonds- five year 110 110 11 May 2022
Corporate bonds- seven year 150 150 10 Apr 2026
Total/w eighted average 605 459 2.7 years
CAPITAL MANAGEMENT | HALF-YEAR RESULTS TO 31 DECEMBER 2020 24D E BT D U R AT I O N
Debt maturity profile as at 31 December 2020
300.0
84.4
200.0
Volume (A$M)
50.6
150.0
100.0 110.0 62.0
100.0
48.0
0.0
FY FY FY FY FY FY
21 22 23 24 25 26
Bonds Drawn bank facilities Undrawn bank facilities
CAPITAL MANAGEMENT | HALF-YEAR RESULTS TO 31 DECEMBER 2020 25I N T E R E S T R AT E H E D G I N G
Hedge book profile by
Dec 2020 Jun 2021 Dec 2021 Jun 2022
half-year ending
Active swaps ($m) 85 70 40 -
Swap rates (%) Maximum 4.12 2.60 2.60 -
Minimum 2.39 2.39 2.60 -
Weighted average1 2.79 2.51 2.60 -
> Including fixed rate corporate bonds:
– $345.0 million hedged at 1.652 per cent weighted average to maturity, at 31 December 2020
1 Weighted average of active swaps at respective half-year end.
2 Excludes margins payable on the fixed corporate bonds.
CAPITAL MANAGEMENT | HALF-YEAR RESULTS TO 31 DECEMBER 2020 26OUTLOOK
Browns Plains, QLD
OUTLOOK | HALF-YEAR RESULTS TO 31 DECEMBER 2020 27OUTLOOK
Operating environment Portfolio
> The Trust is well positioned in the current > Primary focus for the remainder of the
COVID-19 environment with the significant financial year is on leasing vacancies in the
majority of rental income from Bunnings and portfolio, progressing store upgrades, and
other national large format retailers which extending existing leases with Bunnings
have been trading well during this time through the exercise of options
> Demand for Bunnings Warehouse properties FY2021 distribution
is expected to remain relatively stable in near > The Trust could expect the distribution for the
term given the ongoing low interest rate year ending 30 June 2021 to be similar to the
environment and strength of the Bunnings ordinary distribution paid for the year ended
covenant 30 June 2020, with capital profits being
utilised to support the distribution as
Rental growth necessary. The distribution may be reviewed in
the event COVID-19 impacts are more severe
> 22 CPI/ 19 fixed rent reviews in second half
or prolonged than anticipated
FY2021
> 13 Bunnings MRR’s to be finalised in FY2021
(in addition to 6 unresolved from FY2020)
OUTLOOK | HALF-YEAR RESULTS TO 31 DECEMBER 2020 28QUESTIONS? QUESTIONS | HALF-YEAR RESULTS TO 31 DECEMBER 2020 29
F U RT H E R I N F O R M AT I O N

bwptrust.com.au

Responsible entity:
BWP Management Limited
Tel: +61 8 9327 4356
Email: investorrelations@bwptrust.com.au

FURTHER INFORMATION | HALF-YEAR RESULTS TO 31 DECEMBER 2020   30
You can also read