Management Financial
Discussion and Analysis
   First Quarter 2021
←
→
Page content transcription
If your browser does not render page correctly, please read the page content below

Management Financial Discussion and Analysis First Quarter 2021
General Information
Banco Nacional de Panama (the “Bank” or “Banconal”) was established in 1904 in the Republic of Panama.
Banconal is an independent, state owned bank, with a general banking license offering universal banking services
to the public and private sector. The Bank serves a systemically important role, serving as the financial arm of the
Panamanian government and all public entities. Additionally the Bank offers a portfolio of financial services to
individuals and companies across Panama.

With 90 branches, Banco Nacional has the largest
branch network with in the Republic of Panama, 311
ATMs and a state-of-the-art electronic banking
platform.    Giving   continuity   to   the    digital
transformation of virtual channels, Banconal's
electronic banking website was renewed in February
2021, online banking services are now friendlier, with
better user experience, adapted to the tastes,
preferences and needs of our clients. Likewise, it
maintains the security and privacy that users need
when making their transactions.

                                                             Every year Banco Nacional holds a traditional Field
                                                             Day during the dry season. Being proactive in
                                                             maintaining this year’s biosafety rules, the Bank
                                                             replaced the face-to-face human convergence in
                                                             working production farms which became the training
                                                             classrooms, to a virtual classroom. This year’s Field
                                                             Day theme was "Sustainable Rice Production with
                                                             Integral Vision", presenting the latest trends in rice
                                                             production.

Banco Nacional de Panamá recognizes Corporate Social
Responsibility as a shared commitment of an
organization with its social surroundings and the
environment, where it operates. Within this concept,
Banconal has been practicing social responsibility for
more than 40 years.

The Bank’s Corporate Social Responsibility strategy is
focused on four mainstays: health, education,
environment and culture.

With this strategy, sustainable projects, social
investment, cultural management and development of the Banconal community are managed. It was structured
according to ISO 26000, aligned with the United Nations Sustainable Development Goals and the 2030 Agenda,
the National Strategic Plan with a State Vision 2030 and with the Sustainable Finance Protocol of Panama.

.

                                                         2
Banconal in numbers
Q1 - 2021
The Bank’s balance sheet contracted by 5.6% during
the first three months of 2021. The contraction is the
result of reductions in deposits, both from the public
and private sectors. The decrease in private deposits
is due to a reduction in deposits from banks. The
reduction in deposits from customers is reflected in a
decrease in the bank's assets.
Total assets decreased by US$ 941.9 million, closing
at US$ 15,930.2 million at Mach 31, 2021. The
reduction in assets is reflected in a decrease in the
investment portfolio.
The liquidity ratio at March 31, 2021 is 87.1%, short
of three times the minimum of 30% required by the
regulator.
Delinquent and past due loans correspond to 4.8% of
the Bank's total loan portfolio. The reserve for
possible loan losses amounted to US$ 113.1 million.
Past due loans over 90 days have a reserve coverage
for possible losses (loan loss provision and dynamic
provision) of 1.82 times as of March 31, 2021.
Total liabilities decreased by 6.0% or US$ 961.3
million, due to a reduction in deposits of 7.2%. Of total
deposits, private time deposits fell US$ 379.9 million
due to bank deposit withdrawals, and public time
deposits which decreased by US$ 604.2 million as a
result of funds withdrawals by the government to
cover operating expenses.
Equity reached US$ 981.6 million, an increase of 2.0% compared to total equity as of December 31, 2020 (US$
962.2 million). At the end of the first quarter of 2021, capital adequacy ratio reached 17.9%.
The Bank has investment grade risk ratings by the three main rating agencies:
o Standard and Poor's (“BBB”, with a stable outlook)
o Moody's (“Baa2”, with a stable outlook)
o Fitch Ratings (“BBB-” with negative outlook)
3
Financial Analysis

At the end of first quarter 2021, Banco Nacional’s balance
sheet shows a contraction of 5.6%. The contraction, primarily
in liquid assets, is a reflection of the reduction of client
deposits, both from the private and public sectors. The
composition of the Bank’s balance sheet continues to show
high levels of liquidity; liquid assets and investments
represent 67.8% of total assets. Loans are 30.6% of assets.
Customer deposits account for 81.5% of liabilities and equity,
financings 10.6% and other liabilities 1.8%. Equity funds
constitute 6.1% of the total balance sheet

Assets

Assets totaled US$ 15,930.2 million. In comparison with year-
end 2020 balance sheet numbers, assets decreased by US$
941.9 million or 5.5%, as a result of a reduction in bank
deposits in the amount of US$ 136.7 million and in
investments in securities of US$ 727.7 million. The
contraction in total assets is a result in the utilization of funds
by the Government of Panama deposited in the Bank to fund
operating expenditures.

Liabilities

Liabilities totaled US$ 14,948.5 million as of March 31, 2021,
decreasing by US$ 961.3 million, compared to December 31,
2020 figures. The contraction of 7.2% or US$ 1,009.7 million
occurs in customer deposits, mainly in public sector deposits
and bank deposits. The drop in public sector deposits is due
to the use of resources by the Government to cover operating
expenses.

Equity

At the end of first quarter 2021, the Bank's total equity closed
at US$ 981.7 million, an increase of US$ 19.5 million
compared to December 31, 2020. The increase is due to the
period’s retained earnings for the period.

                                                             4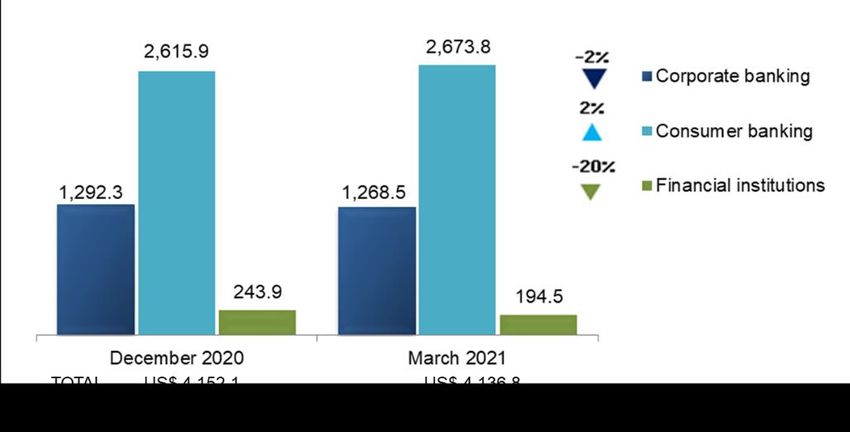
Liquidity and Sources of Funds

Banconal maintains robust liquidity levels. As of
March 31, 2021, the financial liquidity ratio was
64.6% and the legal liquidity ratio closed at 87.1%,
well above the 30% required by the
Superintendency of Banks of Panama.

Liquid assets totaled US$ 10,809.9 million (cash,
bank deposits, securities purchased under resale
agreements, and fixed income investments). The
level of liquid assets fell by 7.5%, from US$
11,692.4 million at December 31, 2020. As of
March 31, 2021, liquid assets represented 83.3% of
total customer deposits and 67.9% of total of
assets.

                                                        As of            As of
     (In US$ thousands)                                March 31,      December 31,       Change
                                                         2021             2020        US$       %

     Cash and cash equivalents                              280,485        299,687    -19,202    -6.4%
     Deposits in banks at amortized cost:
     Demand deposits- foreign                              61,796           90,825    -29,029   -32.0%
     Time deposits - local                                295,081          340,143    -45,062   -13.2%
     Time deposits - foreign                            7,744,084        7,787,473    -43,389    -0.6%
     Less: Reserve for bank deposit losses                    153              121         32    26.4%
     Total bank deposits at amortized cost              8,100,808        8,218,320   -117,512    -1.4%
     Total cash, cash equivalents and bank
     deposits at amortized cost                         8,381,293        8,518,007   -136,714    -1.6%
     Securities purchased under resale
                                                             15,165         33,314    -18,149   -54.5%
     agreements
     Less: Reserve for investment losses                        11              62        -51   -82.8%
     Securities purchased under resale
     agreements at amortized cost                          15,154           33,252    -18,098   -54.4%
     Investments in securities                          2,420,525        3,145,743   -725,218   -23.1%
     Less: Reserve for investment losses                    7,079            4,577      2,502    54.7%
     Investments in securities, net                     2,413,446        3,141,166   -727,720   -23.2%
     Total Liquid Assets                               10,809,893       11,692,425   -882,532    -7.5%

                                                        5
Banconal's investment portfolio contracted by US$ 727.7
million or 23.2%, from US$ 3,141.1 million as of December
31, 2020 to US$ 2,413.4 million as of March 31, 2021. The
reduction in the portfolio is due to the redemption of
investments that have not been reinvested.
The Bank's investment portfolio is made up of sovereign and
corporate debt securities issued by Panamanian, US, Latin
American and supranational institutions. The Bank has a
conservative investment policy, investing primarily in liquid
investment grade fixed income securities. More than 90% of
Banco Nacional's investment portfolio is invested in
investment grade securities.
The Bank's funding sources consist of deposits and financings. Total sources of funds amounted to US$ 14,668.9
million as of March 31, 2021; of these, deposits amounted to US$ 12,979.3 million, which represents 88.5% of the
Bank's sources of funds. Deposits include demand deposits, time deposits, savings accounts, and bank deposits.
The following table shows Banconal's sources of funds as of March 31, 2021 and December 31, 2020:
As of As of
March 31, December 31, Change
(In US$ thousands) 2021 2020 US$ %
Deposits
Demand deposits 4,439,291 4,478,148 -38,857 -0.9%
Savings deposits 900,500 906,163 -5,663 -0.6%
Time deposits, Restricted - inactive accounts and
7,639,506 8,604,679 -965,173 -11.2%
Restricted - escrow funds
Total Deposits 12,979,297 13,988,990 -1,009,693 7.2%
Obligations
Foreign borrowings received at amortized cost 479,906 485,415 -5,509 -1.1%
Bonds payable - local at amortized cost 206,267 206,216 51 0.0%
Bonds payable - foreign at amortized cost 999,738 1,005,955 -6,217 -0.6%
Lease liabilities 3,645 3,397 248 7.3%
Total obligations 1,689,556 1,700,983 -11,427 -0.7%
Total Sources of funds 14,668,853 15,689,973 -1,021,120 -6.5%
Loan Portfolio
The Bank's gross loan portfolio totaled US$ 4,963.7 million as of March 31,
2021; a US$ 15.7 million reduction when compared to year end 2020 total of
US$ 4,979.4 million.
Loans to the public sector represented 16.7% of the total portfolio or US$ 826.9
million and loans to the private sector represent the majority of the portfolio with
US$ 4,136.8 million or 83.3%.
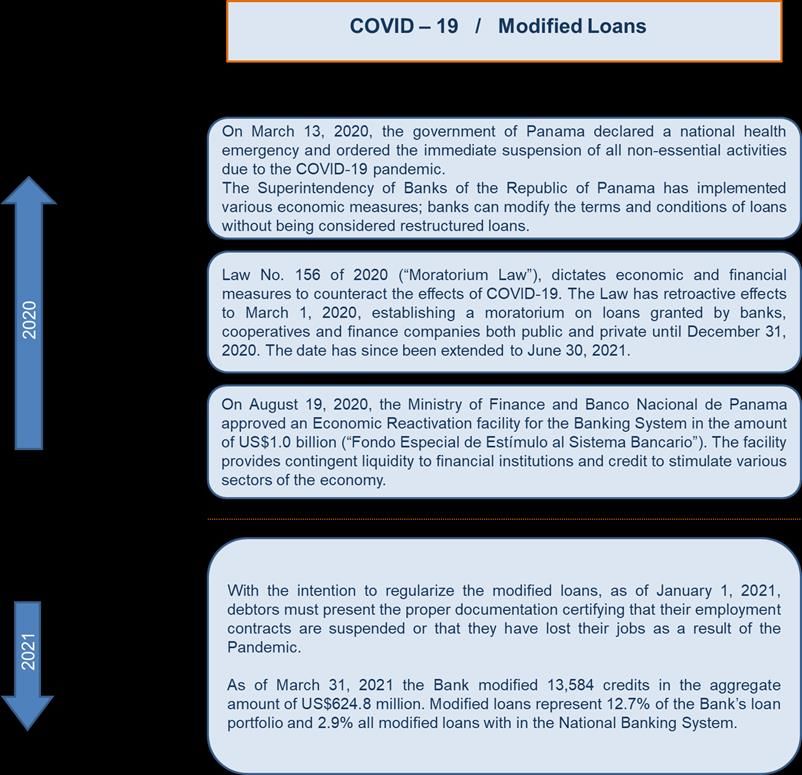
The following graph presents the private sector loan portfolio by type of loan.
Most of the Bank's loans have fixed interest rates, which can be readjusted at
the unilateral option of Banconal, at any time.
6
The corporate banking loan portfolio and loans to financial institutions fell by US$ 23.8 million and US$ 49.4 million
respectively, while consumer banking saw an increase in their portfolios of US$ 57.9 million, driven by the
residential mortgage loan portfolio.

Asset Quality

As of March 31, 2021, total past due and overdue loans amounted to 4.8% of the total loan portfolio (as of
December 31, 2020: 2.7%). The quality of the loan portfolio has been affected by COVID-19 Pandemic. In line
with the increase in past-due and overdue loans, the Bank has increased its loan loss reserves to cover additional
delinquent loans.

                                                          7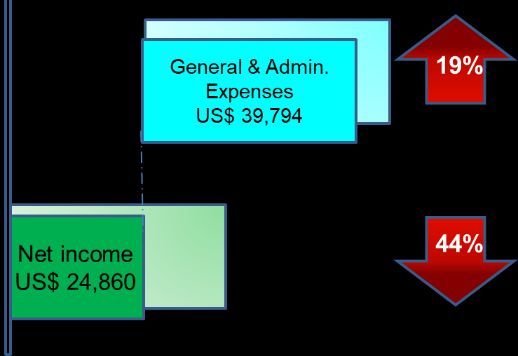
The increase in provisions was driven by macroeconomic variables due to the COVID-19 pandemic.

Loan Loss Reserves

The following table shows the movements in the Bank's reserve account for loan losses for the periods ended
March 31, 2021 and December 31, 2020:

                                                                            As of
  (US$ thousands)                                    As of March 31,                                Change
                                                                         December 31,
                                                          2021               2020            US$                %
  Balance at the beginning of the period                    108,251             62,918        45,333          72.1%
  Reserve charged to expenses                                  6,328            46,426       -40,098         -86.4%
  Recoveries                                                     383             1,195          -812         -67.9%
    Write-off loans                                           -1,818            -2,288           470         -20.5%
  Balance at the end of the year                            113,144            108,251         4,893           4.5%

The reserve for loan losses increased to US$ 113.1 million as of March 31, 2021, or 2.3% of the total loan portfolio,
from US$108.3 million as of December 31, 2020, or 2.2% of the portfolio. The accumulation of reserves is to face
the weakening asset quality indicators of the loan portfolio due to the economic impact of COVID -19 on the Bank's
clients.

                             As of March 31              As of December 31
                                  2021                          2020                              Change
(US$ thousands)      Loans       Allowances   %         Loans      Allowances   %        Loans       Allowances

Low risk            4,841,524         56,924 1.2%      4,861,413        54,129 1.1%       -0.4%              5.2%
Significant risk       27,648          6,604 23.9%        32,984         8,588 26.0%     -16.2%            -23.1%
Default risk           94,545         49,616 52.5%        84,998        45,534 53.6%      11.2%              9.0%
Total               4,963,717        113,144 2.3%      4,979,395       108,251 2.2%       -0.3%              4.5%

Modified Loans

Given the situation presented by the COVID-19 Pandemic, the Superintendency of Banks established a temporary
credit category, called “modified credits”. The guidelines established by the Superintendency apply to both
consumer loans and corporate loans. Modified loans are loans that have adhered to the moratoriums established
to ease the burden of economic hardship caused by COVID-19.

As of March 31, 2021, the Bank has 13,584 modified loans on its books for an aggregate amount of US$ 624.2
million. Modified loans represent 12.7% of the Bank's loan portfolio and 2.9% of all modified loans within the
National Banking System.

                                                           8
The provision for the modified special mention portfolio must be established to cover credit risk, ensuring
compliance with IFRS and prudential standards. Banks will constitute a provision equivalent to the higher value
between the provision according to IFRS of the modified special mention portfolio and a generic provision
equivalent to three percent (3%) of the gross balance of the modified loan portfolio, including accrued interest not
collected. and capitalized expenses.
The following table details the modified special mention portfolio categories and their respective provisions and
regulatory reserves as of March 31, 2021:
As of March 31, 2021
Low Significant Default
(In US$ thousands)
risk risk risk Total
Loans within the modified special mention category
Modified loans:
Residential mortgages 352,531 0 0 352,531
Personal loans 49,915 264 0 50,179
Agricultural 18,854 0 0 18,854
Commercial 202,110 0 0 202,110
Financial institutions 1,130 0 0 1,130
Gross balance 624,540 264 0 624,804
Additions (less):
Interest receivable 17,231 13 0 17,244
Unearned interest and commissions -941 -3 0 -944
Total loans subject to provisions Agreement No. 009-2020 640,830 274 0 641,104
Comparison: IFRS 9 reserve and generic provision
IFRS 9 reserve requirement 38,475 84 0 38,559
Generic provision calculation 3% 19,225 8 0 19,233
Total IFRS 9 registered reserve 38,475 84 0 38,559
Generic provision (to complete 1.5%) 0 0 0 0
Regulatory reserve (to complete 3%) 0 0 0 0
Total provisions and reserves 38,475 84 0 38,559
Capitalization
As of March 31, 2021, the Bank's total equity was US$ 981.7
million, an increase of US$ 19.5 million compared to
December 31, 2020. The increase is due to retained earnings
for the period. Total equity to total assets reached 6.2% as of
March 31 of 2021.
As of March 31, 2021, the Bank's regulatory capital totaled
US$ 955.5 million and the ratio of total capital to risk-weighted
assets (US$ 5,346.1 million) was 17.9%, much higher than
the minimum regulatory capital of 8.0 % required by the
Superintendency of Banks of Panama. Market risk-weighted
assets and operational risk-weighted assets are included in
accordance with the regulatory requirements.
9Net Income for the Period ended March 31, 2021
The following table shows the principal components of the Bank’s income for the period ended March 31, 2021
and 2020:
As of March 31, Change
2021 2020 US$ %
(In US$ thousands)
Interest and fee income 85,025 96,351 -11,326 -11.8%
Interest expense 23,375 22,404 971 4.3%
Net interest and commission income 61,650 73,947 -12,297 -16.6%
Impairment Allowances, net (1) 8,812 5,497 3,315 60.3%
Net interest and commission income, after provisions 52,838 68,450 -15,612 -22.8%
Fees for banking services 5,626 4,938 688 13.9%
Other income(2) 6,593 5,125 1,468 28.6%
Total other expenses 403 261 142 54.4%
Total other income, net 11,816 9,802 2,014 20.5%
Total general and administrative expenses 39,794 33,497 6,297 18.8%
Net income 24,860 44,755 -19,895 -44.5%
Net income at quarter end, March 31, 2021 decreased by US$ 19.9 million, or 44.5% in comparison to net income
for the same period 2020.
Interest and Commission Income
For the period ended March 31, 2021, Banconal's net interest and
commission income decreased by 16.6% to US$ 61.7 million from US$
73.9 million in 2020. The decrease is attributed to lower income from
interest on deposits, due to a low interest rate environment; lower loan
generation; and an increase in financing costs related to the issuance of
bonds and other financing contracted during third quarter 2020.
As of March 31, Change
(In US$ thousands) 2021 2020 US$ %
Interest income and commission income
Loans 62,776 58,699 4,077 6.9%
Deposits in banks 3,341 10,317 -6,976 -67.6%
Securities 16,882 25,130 -8,248 -32.8%
Loan fees 2,026 2,205 -179 -8.1%
Total interest, commission and fee income 85,025 96,351 -11,326 -11.8%
Interest expense
Deposits 12,769 20,606 -7,837 -38.0%
Borrowings 10,564 1,748 8,815 504.3%
Lease liabilities 42 49 -7 -14.3%
Total interest expenses 23,375 22,403 972 4.3%
Net interest and commission income 61,650 73,948 -12,298 -16.6%
10Loss Provisions and Other Income
Provisions for losses increased by 60.3%, from a total of US$ 5.5 million
to US$ 8.8 million. The increase occurs mainly in the provision for losses
on investments and the provision for loan losses.
Other income increased 21.4%, from US$ 10.1 million as of March 31,
2020 to US$ 12.2 million as of March 31, 2021. The increase is due to
commissions generated by the discount of the Digital Voucher to
participating merchants in the Panama Solidario Program.
General & Administrative Expenses
General and administrative expenses increased by 18.8% during the first
quarter of 2021 compared to the same period of 2020. The increase of
US$ 6.3 million, mainly attributed to personnel expenses, repair and
maintenance expenses, professional services fees and transport of
values. The efficiency ratio was 61.5%.
As of March 31, Change
(In US$ thousands) 2021 2020 US$ %
Salaries and other personnel expenses 26,782 21,684 5,098 23.5%
Rentals 262 240 22 9.2%
Repairs and maintenance 2,995 2,248 747 33.2%
Depreciation and amortization 3,251 3,165 86 2.7%
Electricity 808 897 -89 -10.0%
Advertising 283 668 -385 -57.6%
Communications 1,358 1,510 -151 -10.0%
Insurance 113 41 72 175.0%
Stationery and office supplies 298 324 -26 -8.2%
Fees and professional services 1,349 894 455 50.9%
Transportation of personnel 167 273 -106 -38.6%
Transportation of valuables 588 91 497 546.2%
ATMs 427 381 46 12.1%
Others 1,114 1,081 33 3.1%
Total general and administrative expenses 39,795 33,497 6,298 18.8%
Dividends
During the first quarter of 2021, Banco Nacional paid dividends to the Government of Panama in the amount of
US$ 5,370,111 corresponding to 50% of net income for the months of November and December 2020.
1112
Income Statement

                                                                                         As of March 31,                                    Change
                                                                                       2021          2020                            US$                  %
 (In US$ thousands)
 Interest and fee income                                                                  85,025                 96,351             -11,326               -11.8%
 Interest expense                                                                         23,375                 22,404                 971                 4.3%
 Net interest and commission income                                                       61,650                 73,947             -12,297               -16.6%
 Impairment Allowances,           net (1)                                                   8,812                 5,497                3,315               60.3%
 Net interest and commission income, after provisions                                     52,838                 68,450             -15,612               -22.8%
 Fees for banking services                                                                  5,626                 4,938                  688               13.9%
 Other income(2)                                                                            6,593                 5,125                1,468               28.6%
 Total other expenses                                                                         403                   261                  142               54.4%
 Total other income, net                                                                  11,816                  9,802                2,014               20.5%
 Total general and administrative expenses                                                39,794                 33,497                6,297               18.8%
 Net income                                                                               24,860                 44,755             -19,895               -44.5%

_____________________
(1)
    Includes (reversal of) provision for losses in deposits with banks, (reversal of) provision for investment securities losses, provision for loan losses and provision
for valuation of foreclosed assets.
(2)
     Includes dividends, net gain on investments in securities and others.

Balance Sheet

 (US$ in thousands)                                                         March 31,                  December31,                           Change
 Assets                                                                       2021                        2020                           US$          %
 Cash and cash equivalents                                                     8,381,293                    8,518,007                   -136,714     -1.6%
 Securities purchased under resale agreements                                     15,154                       33,252                     -18,098   -54.4%
 Investments in securities, net                                                2,413,446                    3,141,166                   -727,720    -23.2%
 Gross loans private sector                                                    4,179,144                    4,194,258                     -15,114    -0.4%
 Gross loans public sector                                                       832,968                      829,900                       3,068     0.4%
  Allowance for loan losses                                                     -113,144                     -108,251                      -4,893     4.5%
  Unearned interest and commissions                                              -26,063                      -25,846                        -217     0.8%
 Total loans, net                                                              4,872,905                    4,890,061                     -17,155    -0.4%
 Property, plant & equipment                                                      79,357                       80,750                      -1,393    -1.7%
 Other assets                                                                    168,018                      208,788                     -40,770   -19.5%
 Total assets                                                                15,930,173                    16,872,024                   -941,851     -5.6%

 Liabilities & Shareholder Equity
 Deposits                                                                      12,979,297                     13,988,989             -1,009,692             -7.2%
 Obligations with financial institutions                                          479,906                        485,415                 -5,509             -1.1%
 Bonds payable, at amortized cost                                                 999,738                      1,005,955                 -6,217             -0.6%
 Corporate bonds payable, at amortized cost                                       206,267                        206,216                     51              0.0%
 Other liabilities                                                                283,293                        223,232                 60,061             26.4%
 Total liabilities                                                             14,948,501                     15,909,807               -961,306             -6.0%
 Equity                                                                           981,672                        962,217                 19,455              2.0%
 Total Liabilities & Equity                                                    15,930,173                     16,872,024               -941,851             -5.6%

                                                                                  13
Financial Ratios
March 31, December 31,
2021 2020
Profitability and efficiency:
Net Interest Margin (1) 1.5% 2.1%
Return on average assets (2) 0.6% 0.9%
Return on average equity (3) 10.4% 12.9%
Efficiency (4) 61.5% 54.3%
Liquidity:
Primary Liquidity 64.6% 60.9%
Legal Liquidity (6) 87.1% 88.8%
Capital:
Total Capital ratio (7) 17.9% 17.5%
Equity/ assets (8) 6.2% 5.7%
Asset quality:
Past due loans over 91 days overdue / total loans (9) 1.9% 1.7%
Past due loans/ total loans (10) 4.8% 2.7%
Non-accrual loans / total loans (11) 1.4% 1.2%
Headcount 3,446 3,412
Branch network 90 90
(1)
Calculated as net interest income divided by total average interest-earning assets.
(2)
Calculated as net income divided by average total assets.
(3)
Calculated as net income divided by average total equity.
(4)
Calculated as total general & administrative expenses to net interest and commission income after provisions plus total other net
income.
(5)
Calculated as total liquid assets to total deposits.
(6)
Regulatory liquid assets are determined based on guidelines established by the Superintendency of Banks.
(7)
Calculated as total equity divided by total risk weighted assets by credit, market and operational risks.
(8)
Equity divided by total assets
(9)
Calculated as past due loans over 91 days overdue divided by total loan portfolio.
(10)
Calculated as total past due loans and overdue loans over 91 days divided by total loan portfolio.
(11)
Calculated as non-accrual loans divided by total loans.
The analysis is based on the information contained in the interim, unaudited financial statements, as of March 31,
2021. Some figures (including percentages) in this document have been rounded. The interim unaudited financial
statements as of March 31, 2021are available on the Bank’s web site www.banconal.com.pa
14You can also read