Stars, Star Clusters & Stellar Evolution - March 9, 2021 Stellar Evolution Open and globular stellar clusters
←
→
Page content transcription
If your browser does not render page correctly, please read the page content below
Stars, Star Clusters
& Stellar Evolution
        Stellar Evolution
 Open and globular stellar clusters

         March 9, 2021
      University of Rochester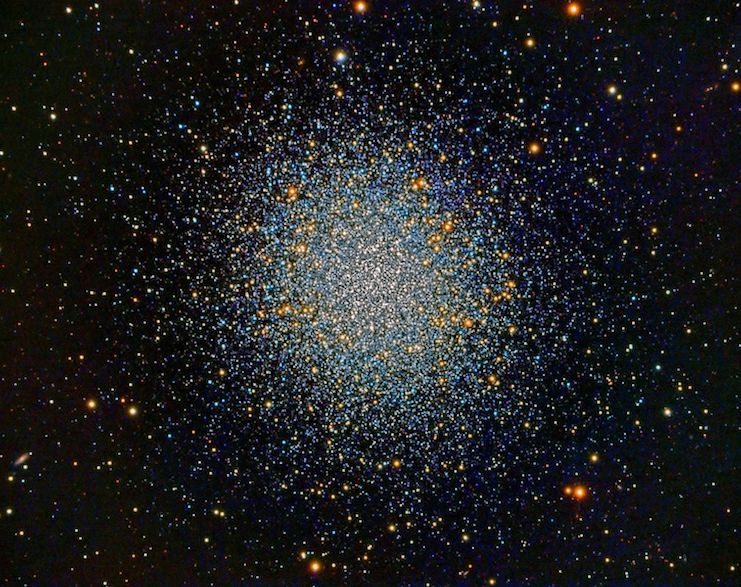
Stellar Clusters & Stellar Evolution

 I   Stellar evolution
 I   Changes on the main sequence
 I   Shell hydrogen fusion and subgiants
 I   Late stellar evolution: the giant branch,
     horizontal branch, and asymptotic giant branch
 I Evolution of high mass stars: the iron
   catastrophe
 I Type II (core-collapse) supernovae
 I Open and globular clusters as stellar clocks

Reading: Kutner Ch. 11.1 & 13; Ryden Sec. 14.2–14.3,              Supernova progenitor simulation (Mosta et al.
17.2, & 18.4; Shu Ch. 8 & 9                                              2014). Colors indicate entropy.

         March 9, 2021 (UR)         Astronomy 142 | Spring 2021                                             2 / 35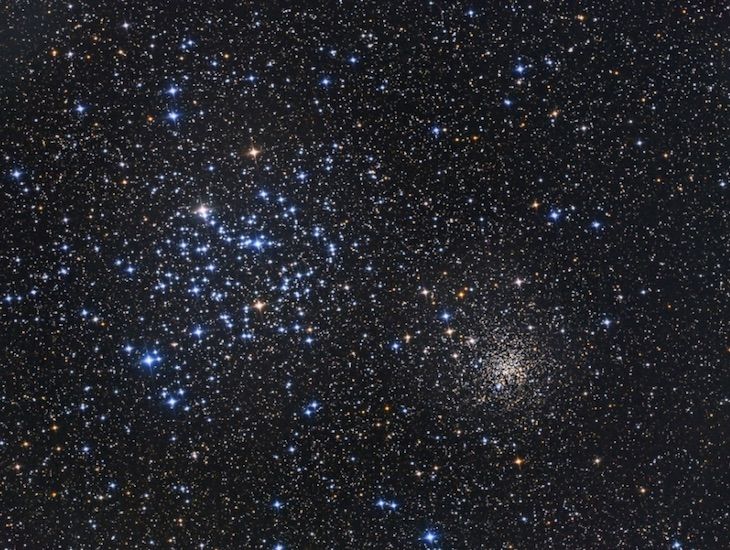
Mean molecular weight
For pure ionized hydrogen,
                                        mp + me
                                  µ=            ≈ 0.5mp
                                           2
For pure ionized helium,
                                    3.97mp + 2me
                               µ=                 ≈ 1.32mp
                                          3
In general we express the molecular weight in terms of the mass fraction X of hydrogen,
the mass fraction Y of helium, and the mass fraction Z of everything else (“metals”). For a
fully ionized gas,
                                  mp           3     1
                                       ≈ 2X + Y + Z
                                    µ          4     2
For example, the mean molecular weight for ionized gas with X = 0.70, Y = 0.28, and
Z = 0.02 (the abundances found on the Solar surface) is

                                         µ = 0.62mp

        March 9, 2021 (UR)           Astronomy 142 | Spring 2021                         3 / 35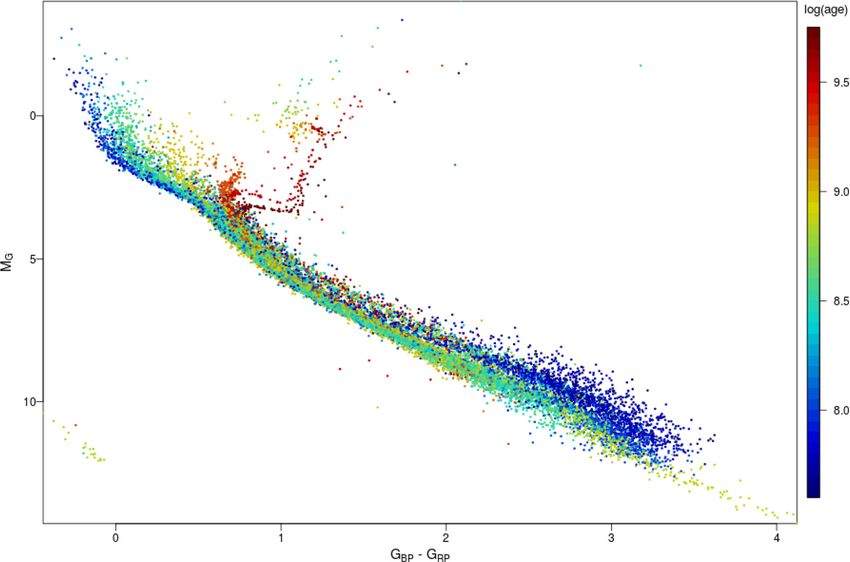
Stellar evolution on the Main Sequence
As hydrogen burns in the stellar
core, fusing into heavier elements,
the mean molecular weight of a star
slowly increases.
In the center of the Sun today,

               µ = 1.17mp

At a given temperature, the ideal
gas law says this would result in a
lower gas pressure and less support
for the star’s weight:

                               ρkT
            P = nkT =
                                µ
From “An Introduction to Modern Astrophysics” by Carroll and Ostlie.
          March 9, 2021 (UR)                  Astronomy 142 | Spring 2021   4 / 35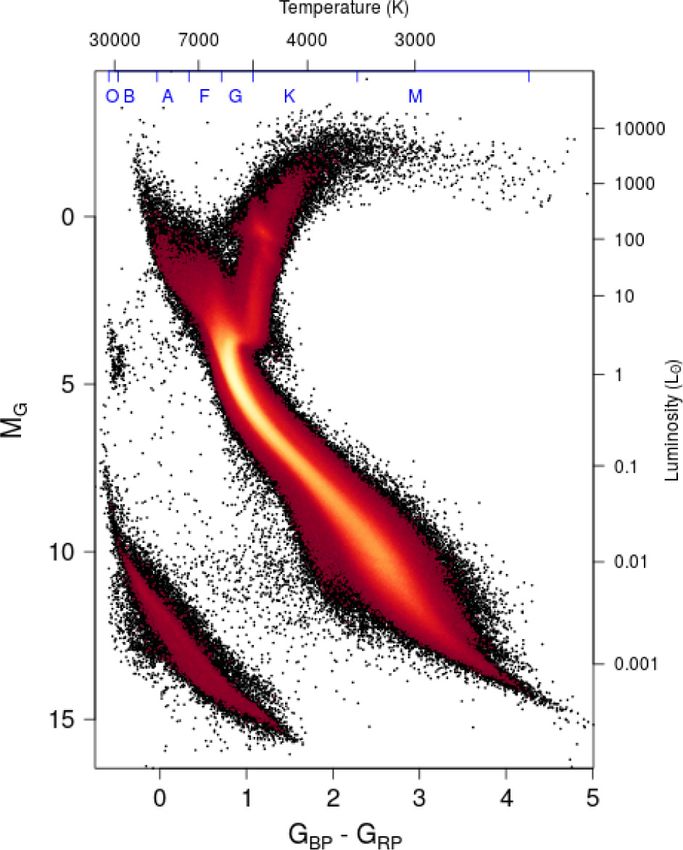
Stellar evolution on the Main Sequence

Therefore, as time goes on:
 I The core of the star slowly
    contracts and heats up.
 I The radius and effective
    temperature of the star slowly
    increase in response to the new
    internal temperature and
    density distribution.
 I The luminosity slowly and
    slightly increases in response
    to the increase in radius and
    effective temperature.

From “An Introduction to Modern Astrophysics” by Carroll and Ostlie.

          March 9, 2021 (UR)                  Astronomy 142 | Spring 2021   5 / 35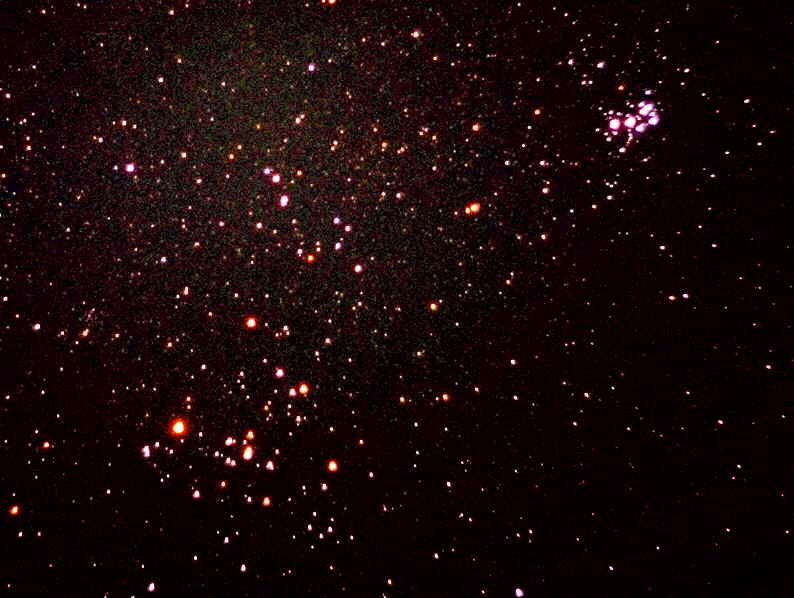
Shell hydrogen burning & the subgiant phase
Eventually, a star will exhaust the hydrogen at the very center.

The temperature is insufficient to ignite helium fusion but is high enough just outside the
center for a shell of hydrogen fusion to provide support for the star. Thus,

 I T is nearly constant in the core (isothermal
   helium core), which keeps increasing in mass
   due to hydrogen depletion.
 I There is increased luminosity and further
   expansion of the envelope of the star.
  I There is a decrease in effective temperature.
This is called the subgiant phase. The star moves off
the main sequence, upwards and to the right on the
H-R diagram.

        March 9, 2021 (UR)           Astronomy 142 | Spring 2021                         6 / 35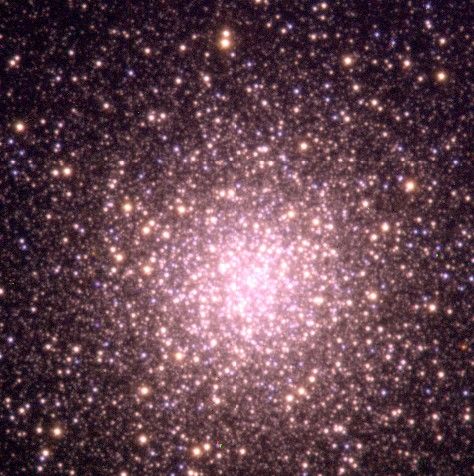
Observational H-R diagram

I Observational H-R diagram showing
  absolute magnitude vs. color index.
I Made using distances from the Gaia mission

      March 9, 2021 (UR)         Astronomy 142 | Spring 2021   7 / 35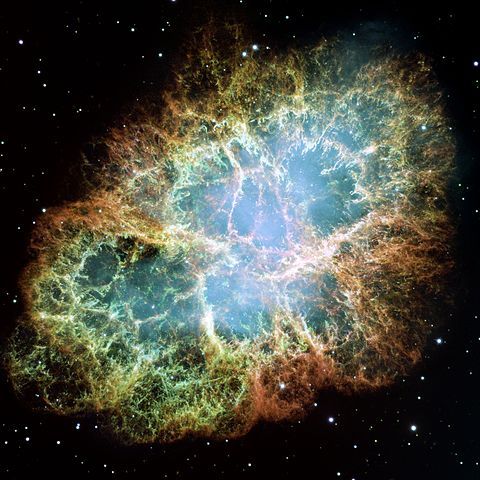
Degeneracy in the isothermal core
The subgiant phase ends when the mass of the isothermal He core becomes too great for
support of the star.
 I Reason for a maximum weight that can be supported by pressure in the core:
    electron degeneracy pressure.
 I The core is like a white dwarf, except with additional external pressure.
 I The maximum mass in the core (Schonberg & Chandrasekhar 1942) is

                                                     µenvelope 2

                                Miso. core
                                           = 0.37
                                 Mtotal              µiso. core
                                                     0.62 2

                                            ≈ 0.37
                                                     1.32
                                            = 0.08 for the Sun

At this point comes the red giant phase.
       March 9, 2021 (UR)           Astronomy 142 | Spring 2021                     8 / 35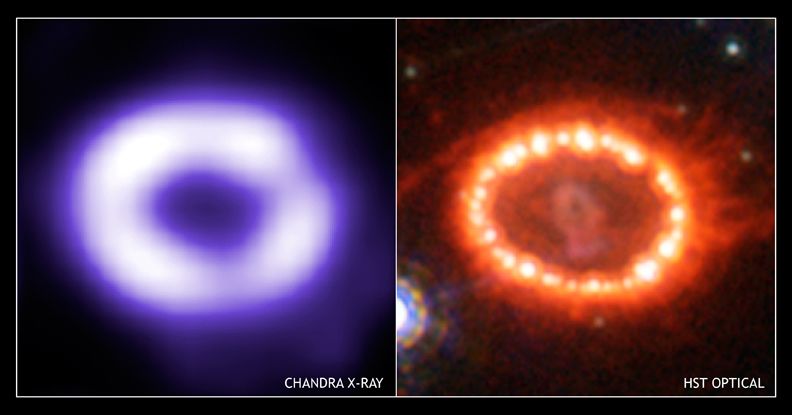
The red-giant phase

After the maximum mass of the core is
exceeded, the star moves up and to the right
in the H-R diagram.
  I The core collapses, causing a rise in ρc
     and Tc .
  I The convection zone extends inward
     (“dredge-up”).
  I Stellar radius dramatically increases due
     to the increase in radiation pressure from
     the interior, which now dominates
     support against gravitational collapse.

         March 9, 2021 (UR)           Astronomy 142 | Spring 2021   9 / 35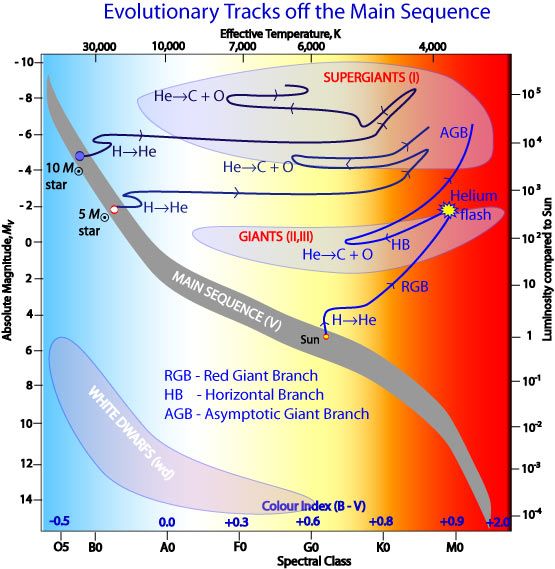
The triple-α process
The core temperature reaches 108 K and the triple-α process
                              342 He → 84 Be∗ + 00 γ + 42 He →           12     0
                                                                         6 C + 20 γ

begins helium fusion. The onset is
very rapid in stars with M ≥ M ,
leading to a phenomenon called the
helium flash.
The half-life of 8 Be is 10−16 s and it
decays back into two 4 He nuclei
unless it interacts with a third 4 He
nucleus to form 12 C. Some of the
12 C will then fuse with another 4 He

to form 16 O.

         March 9, 2021 (UR)                Astronomy 142 | Spring 2021                10 / 35
Explanation of solar elemental abundances
The triple-α process explains why C and O are so abundant (in a relative sense) compared
to the other heavy elements.
March 9, 2021 (UR) Astronomy 142 | Spring 2021 11 / 35A 1M star as a Red Giant
Red giant structure: extremely dense He core and extremely tenuous and cool H envelope (ρ = 10−4 g/cm3 ).
Images from ATNF.
March 9, 2021 (UR) Astronomy 142 | Spring 2021 12 / 35Late stages of stellar evolution
I The horizontal branch is the phase after
triple-α onset.
I Interior: core He burning, shell H
burning. The core is on the He main
sequence.
I Note the differences and similarities
between a 1M , 5M , and 10M star.
Diagram from ATNF.
March 9, 2021 (UR) Astronomy 142 | Spring 2021 13 / 35Late stages of stellar evolution
H-R diagram showing observations of stars in binary systems and globular clusters
March 9, 2021 (UR) Astronomy 142 | Spring 2021 14 / 35Nomenclature: Spectral type
The “Harvard” spectral type of a star is a classification based on the strength of
absorption lines of several molecules, atoms, and ions (Cannon & Pickering 1901).
I Generally, types A–M correspond to steady decreases in the strength of hydrogen
lines. Type O is weaker still.
I Type P for planetary nebulae and Q for miscellany. N not used.
I In 1925 Cecilia Payne showed that the spectral type sequence OBAFGKM is a
sequence of decreasing temperature from roughly 35000K to 3500K (Payne 1925).
I Numbers 0–9 add a further refinement of temperature within the spectral classes (0 =
hottest, 9 = coolest).
I L, T, and Y recently added for cooler brown dwarfs.
Examples: Vega is an A0 star; the Sun is a G2 star; Pollux is a K2 star; Betelgeuse is an M2
star.
March 9, 2021 (UR) Astronomy 142 | Spring 2021 15 / 35Harvard spectral classification
Class Te [K] M [M ] R [R ] L [L ] Frac. MS Pop. [%]
O ≥ 30000 ≥ 16 ≥ 6.6 ≥ 30000 0.00003
B 10000 − 30000 2.1 − 16 1.8 − 6.6 25 − 30000 0.13
A 7500 − 10000 1.4 − 2.1 1.4 − 1.8 5 − 25 0.6
F 6000 − 7500 1.04 − 1.4 1.15 − 1.4 1.5 − 5 3
G 5200 − 6000 0.8 − 1.04 0.96 − 1.15 0.6 − 1.5 7.6
K 3700 − 5200 0.45 − 0.8 0.7 − 0.96 0.08 − 0.6 12.1
M 2400 − 3700 0.08 − 0.45 ≤ 0.7 ≤ 0.08 76.45
Table of spectral classes O through M for the Main Sequence. From wikipedia. See also Habets & Heintze (1981) and
Ledrew (2001).
March 9, 2021 (UR) Astronomy 142 | Spring 2021 16 / 35Nomenclature: Luminosity class
At Yerkes Observatory in the 1940s, Morgan, Keenan, and Kellman added another
dimension to classification with luminosity classes (Morgan et al. 1943).
V main sequence or “dwarf” stars (the Sun)
IV “subgiants”, brighter than V by 1 or 2 magnitudes for the same spectral type
III normal “giants”, another few magnitudes brighter
II, I “bright giants” and “supergiants,” even brighter (Antares, Betelgeuse)
VI, VII “subdwarfs” and “white dwarfs” (Sirius B). Subdwarfs are metal-poor MS
stars. White dwarfs are degenerate stellar remnants.
Examples: Vega is an A0V star; the Sun is G2V, Pollux is K2III, and Betelgeuse is M2I.
March 9, 2021 (UR) Astronomy 142 | Spring 2021 17 / 35H-R diagram
March 9, 2021 (UR) Astronomy 142 | Spring 2021 18 / 35After the horizontal branch: M < 2M
I Isothermal C-O core forms as He is
exhausted.
I Not enough weight to overcome
degeneracy pressure.
I Core cannot collapse and ignite C-O
fusion (requires 500 MK!)
I H/He burning in outer core, ejection of
rest of stellar envelope, forming a
planetary nebula (few 1000 yr
timescale).
The core becomes a 0.6M C-O white dwarf
with T0 ∼ 108 K. It lasts forever unless it has
a close stellar companion.
March 9, 2021 (UR) Astronomy 142 | Spring 2021 19 / 35After the horizontal branch: M > 2M
I Asymptotic giant branch
(ABG/supergiant) evolution
I Repeated core collapse after fuel
exhaustion, up to Si fusion to produce
Fe-peak elements.
I R and L steadily increase while Te
decreases.
I Each successive fuel is exhausted faster
than the last. For a 15M star (Woosley
& Janka 2006):
Fuel H He C Ne
Time 107 yr 106 yr 103 yr 0.7 yr
O, Mg Si, . . . Fe . . .
2.6 yr 18 dy 1s
March 9, 2021 (UR) Astronomy 142 | Spring 2021 20 / 35What happens after the nuclear fuel is exhausted?
For most M > 2M stars:
I During burning of the heavier elements and radiative support of the stellar envelope,
stars tend to be hydrodynamically unstable
I This leads to the loss of large fractions of the stellar mass.
I Oscillations: note that evolution takes stars across the instability strip, which is
nearly vertical at Te ∼ 5000 K.
I Stellar winds can also remove significant amounts of material.
These processes can keep a star’s core mass below the SAC limit, so the final states of the
star are like those of lower-mass objects: planetary nebula phase and white dwarf
remnant.
March 9, 2021 (UR) Astronomy 142 | Spring 2021 21 / 35What happens after the nuclear fuel is exhausted?
For the most massive stars (M & 8M ):
I Mass loss is insufficient to keep the core in the white dwarf phase; maximum mass of
Fe white dwarf is 1.26M .
I Result: further collapse and neutronization (and creation of signicant number of
neutrinos).
I When the collapsing core reaches tens of km in size, neutron degeneracy pressure
sets in, which can stop or slow the collapse.
I However, since the collapse has been from white-dwarf to neutron-star dimensions,
infalling material from the stellar envelope is going very fast (a large fraction of c).
I Result: envelope rebounds off the stiff neutron-degenerate material and blows up the
rest of the star.
This is called a core collapse or Type II supernova.
March 9, 2021 (UR) Astronomy 142 | Spring 2021 22 / 35Core-collapse (Type II) supernova
Nomenclature: Type II or CCSN. Remnant is a NS or more rarely a BH, depending on
core mass (M = 1.3 − 2.2M ).
Image from NASA/CXC
March 9, 2021 (UR) Astronomy 142 | Spring 2021 23 / 35Supernova types: Light curve classification
Light curve: luminosity vs. time. Note the extreme absolute magnitudes of these
explosions!
March 9, 2021 (UR) Astronomy 142 | Spring 2021 24 / 35SN1987A: A recent nearby supernova
I The last “naked eye” supernova occurred in the
Large Magellanic Cloud, a Milky Way satellite
galaxy.
I SN1987A (Feb. 23, 1987): a Type II
I Output luminosity temporarily exceeded
luminosity of the entire galaxy!
I First supernova for which we knew the
progenitor star.
I Neutrino burst observed by three detectors
(Kamiokande II, IMB, Baksan).
March 9, 2021 (UR) Astronomy 142 | Spring 2021 25 / 35SN1987A after a few decades
X-ray: NASA/CXC/U. Colorado/S. Zhekov et al. Optical: NASA/STScI/CfA/P. Challis.
March 9, 2021 (UR) Astronomy 142 | Spring 2021 26 / 35A Type II supernova after 1000 years
NASA/HST mosaic.
March 9, 2021 (UR) Astronomy 142 | Spring 2021 27 / 35Observation of stellar evolution: Star clusters
I Stars tend to form in clusters at about the same age (within 1 − 2 Myr of each other)
and are nearly the same distance from us.
I H-R color-magnitude diagrams for stars in the cluster make it very easy to infer the
stars’ location on the main sequence.
I If we make an H-R diagram of a cluster we tend to see a turnoff point.
I The turnoff is caused by stars exhausting their H supply and moving along the
horizontal branch.
I Higher-mass stars move off the MS first, so the turn off starts on the
high-mass/high-Te end of the H-R diagram (upper left) and moves down as
lower-mass stars age and exit the MS.
I In other words, the turnoff point acts like a clock, telling us the age of stars in the
cluster with very good accuracy.
March 9, 2021 (UR) Astronomy 142 | Spring 2021 28 / 35The turnoff point
H-R diagram for 32 open clusters, colored by age (Gaia Collaboration 2018).
March 9, 2021 (UR) Astronomy 142 | Spring 2021 29 / 35Open and globular clusters
Stars are classified into open (young) or globular (old) clusters.
Properties of open clusters: Properties of globular clusters:
I Low density, irregular, lots of blue stars I High density, spherical, few blue stars
I Low random velocities (few km/s) I Higher random velocities (tens of km/s)
I Hundreds of thousands of stars, not I Millions of stars, gravitationally bound
always gravitationally bound Archetypes: ω Centauri, M3, M13, 47
Archetypes: Pleiades (M45), Hyades, h and Tucanae
χ Persei
March 9, 2021 (UR) Astronomy 142 | Spring 2021 30 / 35Open clusters: the Pleiades (M45)
The Pleiades are about 135 pc away and are roughly 110 Myr old.
Left: Optical image of the Pleiades cluster with the brightest stars highlighted.
Right: H-R diagram of optical sources in the cluster (Gaia Collaboration 2018).
March 9, 2021 (UR) Astronomy 142 | Spring 2021 31 / 35Open clusters: the Hyades
The Hyades are the closest open cluster (43 pc) and are 625 Myr old.
Left: the Hyades (lower left) and Pleiades (upper right).
Right: H-R diagram of optical sources in the cluster (Gaia Collaboration 2018).
March 9, 2021 (UR) Astronomy 142 | Spring 2021 32 / 35Open clusters: M67
M67 is 900 pc away and is the oldest known open cluster: 4 Gyr, the same age as the Sun.
Left: M67, from N. Sharp and M. Hanna, NOAO/AURA/NSF.
Right: H-R diagram of optical sources in the cluster (Gaia Collaboration 2018).
March 9, 2021 (UR) Astronomy 142 | Spring 2021 33 / 35Globular clusters: 47 Tuc
47 Tuc is about 13 Gyr old, like all Galactic globular clusters, and it is 4.0 kpc away.
RR Lyrae stars are not plotted (note gap in HB).
Left: 47 Tucanae (NASA/ESA/HST).
Right: H-R diagram the Gaia Collaboration (2018).
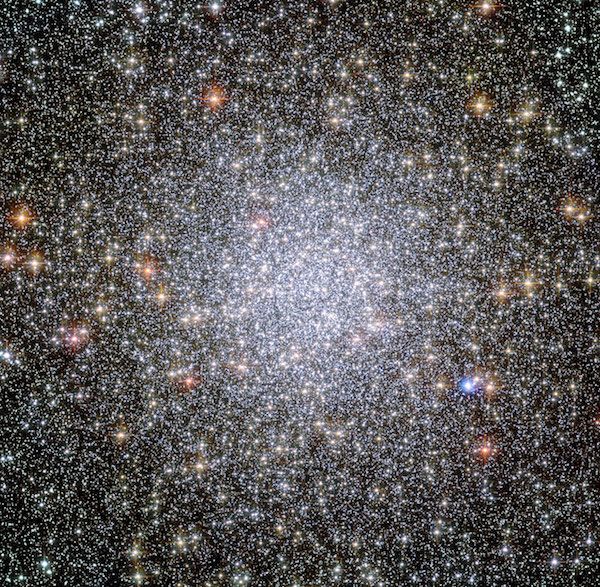
March 9, 2021 (UR) Astronomy 142 | Spring 2021 34 / 35More globular clusters: M13 & M3
Left: Globular cluster M13 taken with an 8” Schmidt-Cassegrain telescope (wikimedia commons).
Right: M3, from P. Challis (APOD).
March 9, 2021 (UR) Astronomy 142 | Spring 2021 35 / 35You can also read