In this issue Central Queensland seasonal climate outlook and information for producers December 2020
←
→
Page content transcription
If your browser does not render page correctly, please read the page content below

Central Queensland seasonal climate outlook and
information for producers
December 2020
From your Central Queensland Climate Mates
In this issue…
November 2020 was the hottest November on record, with
a period of severe heatwave across most of the state. What
heat extremes can mean for beef cattle production in
northern Australia
Climate driver update, and likely scenarios
The La Nina is still forecast to deliver a wetter summer.
Outlooks from the main climate agencies around the world
Next seasonal update will be around late January
1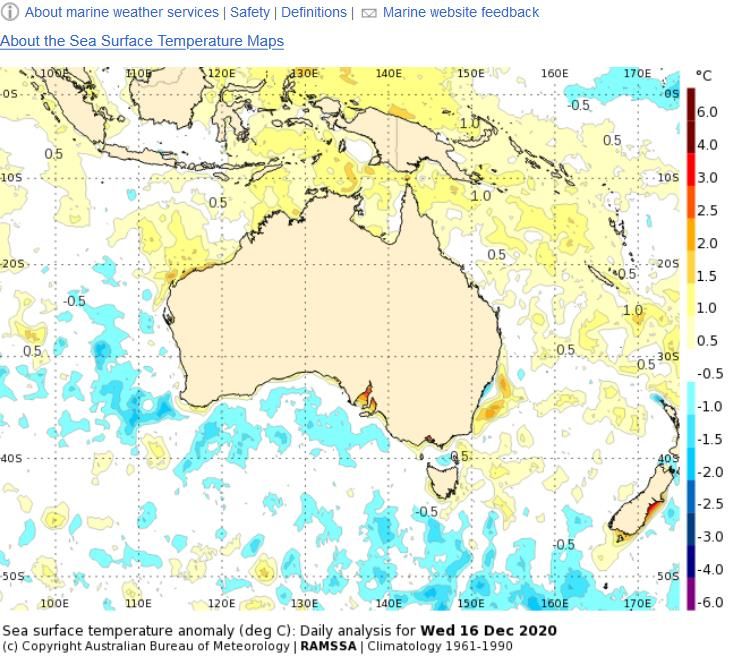
A Merry Christmas and a wet and prosperous 2021 to you and your family!

                                                                                     © Ellie and Tessa Gale (2020)

   Best wishes and all the best for the coming wet season from your central Queensland Climate Mates team!

November 2020 the hottest on record
The Bureau of Meteorology (BOM) has just confirmed that November 2020 was Australia's hottest November on
record for maximum, minimum and mean temperatures. Spring 2020 was also the country's hottest spring on
record for mean and minimum temperatures.

                                                                      The maximum temperature decile map
                                                                      shows a large area of the continent
                                                                      where November maximums were very
                                                                      much higher than average, and the area
                                                                      in central Australia where the average
                                                                      November maximum temperature was
                                                                      the highest on record.
                                                                      November's average maximums came
                                                                      in at 2.9oC above the 1961-90 average,
                                                                      surpassing the 2.4oC mark set in
                                                                      November 2014.

Figure 1: November 2020 maximum temperature decile map
                                                                                                                     2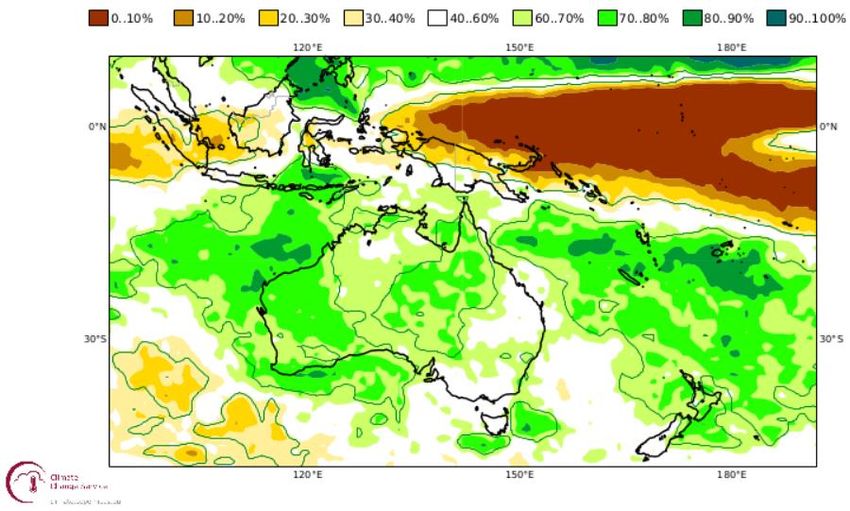
What do increasing maximum temperatures mean for producers?
There is sufficient evidence now that average maximum temperatures are increasing, and an increasing
temperature has resulted, and will continue to result in more extreme heat periods. For areas of the inland
Burnett, this will more than likely mean significantly more days over 35oC, and for areas further inland more days
over 40oC. Periods of extreme heat can have a significant impact on beef cattle production.
At a recent NACP team meeting, a presentation by UQ researcher Associate Professor John Gaughan delivered
some startling facts regarding heat stress on beef cattle in northern Australia.
Some major points of concern raised from Johns research:
There is an unsustainable high rate of calf wastage and cow mortality experienced by 75% of beef
businesses in northern Australia
Average calf wastage in northern Australia is approximately 15% (target is 5%).
Average cow mortality rate is around 8% (target is 4%)
Recent research has identified that heat stress is a major cause for such high mortality rates, creating a
great opportunity for improvements in response to targeted management interventions
The research has also shown that the main barrier for adoption of the project outputs is the lack of confidence in
the predicted climate models, and the projected advantages of providing shade, better nutrition, and the cost of
implementing management interventions.
The CQ Climate Mates team will be delving into this research in more depth during 2021, as we feel that heat
stress on beef production as pointed out in John Gaughans research is a far more important factor than most of
us probably realised until now.
La Nina is still yet to deliver for the CQ region: patience required
The 2020 spring has been very dry in most of central and south-eastern Queensland (figure 2), with below
average rainfall recorded in most areas. November was particularly dry, with the Queensland south-east corner
receiving well below average rainfall (figure 3).
st th
Figure 2: rainfall decile map 1 September – 30 November Figure 3: November 2020 rainfall decile map
All the major climate agencies are still forecasting above median rainfall from January through to March. See
seasonal outlooks from page 6.
Despite the main drivers (Pacific SST, the SOI, trade winds) ticking the boxes for La Nina establishment, we need
to consider that there are a number of other drivers and influences that need to be in the right place for the La
Nina to deliver increased rainfall. Hopefully this is now starting to occur, but it could well mean some areas may
not receive the promised increased rainfall. It may be a case of storm/La Nina lotto. Fingers crossed!
3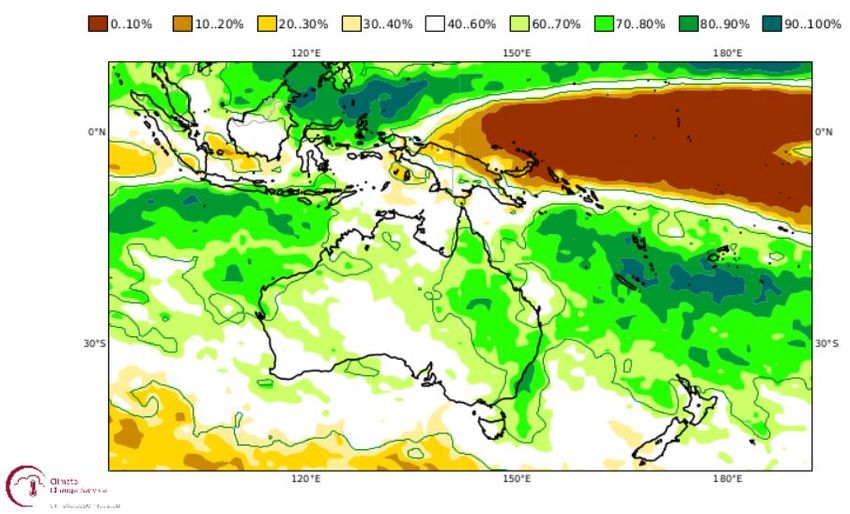
What the climate drivers are telling us at the moment
The Pacific Ocean
Oceanic and atmospheric indicators reflect a mature La Nina with little variation over last fortnight. Model
outlooks suggest the event will peak at moderate levels during December, returning to a neutral phase during the
late summer or autumn.

                                                                     The anomaly map is continuing to display the
                                                                     classic La Nina pattern, with the large pool of
                                                                     cool water in the eastern Pacific and warming
                                                                     in the western Pacific.
                                                                     The central Pacific has warmed much more
                                                                     than the far western Pacific at this time, and
                                                                     the Coral Sea has not yet warmed up
                                                                     significantly. The latest SST map for Australia is
                                                                     shown in more detail in figure 5 below.
                                                                     Note the much warmer than normal SSTs in
                                                                     the northern hemisphere, especially around
                                                                     Japan. What, if anything, does this signal?
                                                     th
Figure 4: Pacific sea surface temperature anomaly map 16 December (courtesy NOAA)

The Coral Sea is still slow to warm up
The sea surface temperature anomaly map below is showing that the SST along most of eastern Australia
(including the western Coral Sea) is still only around average for this time of the year.

                                                                Although areas in the north-east Coral Sea are
                                                                around 0.50C to 1.00C warmer than normal, much
                                                                of the western Coral Sea is still only around average
                                                                temperature for this time of the year. This will
                                                                inhibit any tropical low or cyclone development in
                                                                the western Coral Sea in the immediate future.
                                                                However, note the warming of seas to the north
                                                                and north-west of the continent. This warming is
                                                                consistent with the movement south of the
                                                                monsoon trough, and has contributed to recent
                                                                significant rainfall in the top end and Kimberley
                                                                regions.
                                                                Note also the pool of warmer water along the NSW
                                                                coast, which could be partly responsible for the
                                                                extreme weather over the last week or so in those
                                                                regions.
                                                               th
Figure 5: Australian region sea surface temperature anomaly map 16 December 2020

The Indian Ocean
The SST map shown in figure 4 above is displaying warmer ocean temperatures in the area just to the north-west
of Australia. As mentioned, this warming, coupled with a moderate strength MJO passing through the region
would have contributed to significant rainfall in the Kimberley and top end recently.
However the Indian Ocean Dipole (IOD) is still neutral. With the establishment of the monsoon trough, the IOD
should remain neutral, and will have little or no impact on the Australian climate over the next few months.

                                                                                                                     4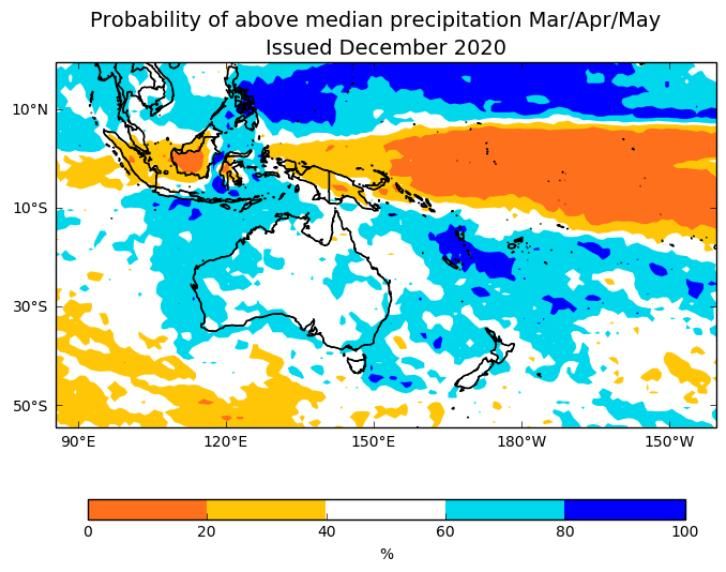
The Southern Annular Mode (SAM)
The SAM refers to the north/south movement of the strong westerly winds that dominate the middle to higher
latitudes of the southern hemisphere. This belt of strong westerly winds is also associated with the storm systems
and cold fronts that move from west to east.
During a SAM positive phase in summer, the belt of westerlies has moved further south towards the Antarctic.
This allows increased moisture flow onto the Australian east coast, which can result in increased rainfall in
eastern Australia, and a reduced chance of extreme heat events. A positive phase in summer is more frequent
with La Nina.
During a SAM negative phase in summer, the belt of westerlies has moved closer to Australia. This can cause in
increased dry air flowing east from the interior, resulting in reduced rainfall in eastern and southern Australia, and
more extreme heat events. A negative SAM in summer is more frequent with El Nino.

             Figure 6: SAM positive phase (summer)                Figure 7: SAM negative phase (summer)
                                                       The SAM level and strength is indicated by a graph. After
                                                       being in negative to neutral territory during early November,
                                                       the SAM has now moved into a positive phase. The
                                                       projected level is indicated by the mean of the ensemble
                                                       models (green line), which is generally positive until at least
                                                       early 2021.
                                                       If the SAM continues on the forecast track, it will improve
                                                       chances of increased rainfall in eastern Australia.
                                                       The SAM could be a very important driver of eastern
                                                       Australian rainfall over the next three months, so we will be
                                                       keeping a close eye on it.
     Figure 8: SAM current and forecast graph (BoM)
The Madden-Julian Oscillation (MJO)
                                           A pulse of the MJO has contributed to increased cloudiness and rainfall
                                           across Australia's tropics. This pulse is expected to slowly track further
                                           eastwards, but remain in a location favourable for active monsoonal
                                           conditions in the coming week.
               th
             16 December                   Keep an eye on the MJO over the next week or two, particularly when it
                                           gets to the western Pacific (Phase 6). It will need to move out of the
                                           circle to have any significant impact though.
                                           It is likely that a monsoon trough in the vicinity of severe tropical
                                           cyclone Yasa (east of Vanuatu) will extend westwards in the coming
                                           week, across the Gulf of Carpentaria and into the Timor Sea, to the
                                           north of Australia. Assisted by the MJO, this could lead to the
                                           establishment of a broad monsoon flow across northern Australia, and
                                           potentially the official onset of the Australian monsoon at Darwin. TC
                                           Yasa is not expected to move into Australian waters.
                                 th
Figure 9: MJO phase diagram to 16 December (BoM)
                                                                                                                    5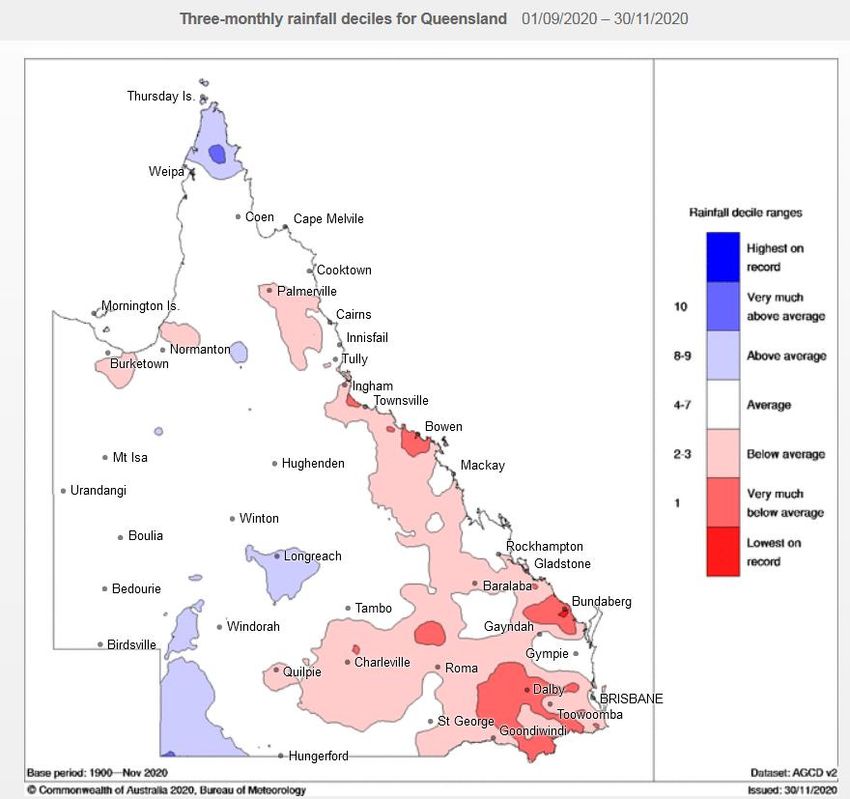
Outlooks for the next three to five months
Summary
Since the La Nina was declared in September, many people have been expecting it to take effect immediately.
Unfortunately it doesn’t work like that. Although the main drivers (Pacific SST and SOI) officially established the La
Nina, other influences haven’t been around to make it rain. However, the signs are now there that the wet season
isn’t far away.
Climate outlooks indicate rainfall during December 2020 is likely to be above average over most of northern
Australia while rainfall from January to March 2021 is likely to be above average for most of the north-eastern
half of the country.
The major climate agencies (BoM, ECMWF, and UKMO) seem to be in broad agreement that the La Nina will
deliver above median rainfall for most of eastern Australia. There is some disagreement about how much, and
where. Therefore it is always wise to have a look at the range of seasonal forecasts out there, rather than just
relying on one source.
Bureau of Meteorology rainfall and temperature outlooks (updated 17th December)
There is a 75 – 80% probability of January to March rainfall being higher than median throughout most of
eastern and central Queensland
There is a 60 – 75% probability of above median rainfall from February through to April in the CQ region,
indicating that the BoM is expecting La Nina to hang around at least until Autumn 2021
Figure 10: BoM rainfall outlook January to March Figure 11: BoM rainfall outlook February to April
th
ECMWF rainfall outlooks (updated 11 December)
ECMWF is forecasting a similar probability to BoM of higher than median rainfall from January to March over
most of eastern Australia. The forecast from March to May is for around average rainfall.
Note the very low rainfall probability forecast for the central Pacific just north of the equator, right through to
autumn. Also both forecasts seem to be indicating the highest probability for rainfall will be in the far western
Coral Sea. With severe TC Yasa now threatening in the Fiji region this already seems to be happening.
Figure 12: ECMWF rainfall outlook January to March Figure 13: ECMWF rainfall outlook March to May
6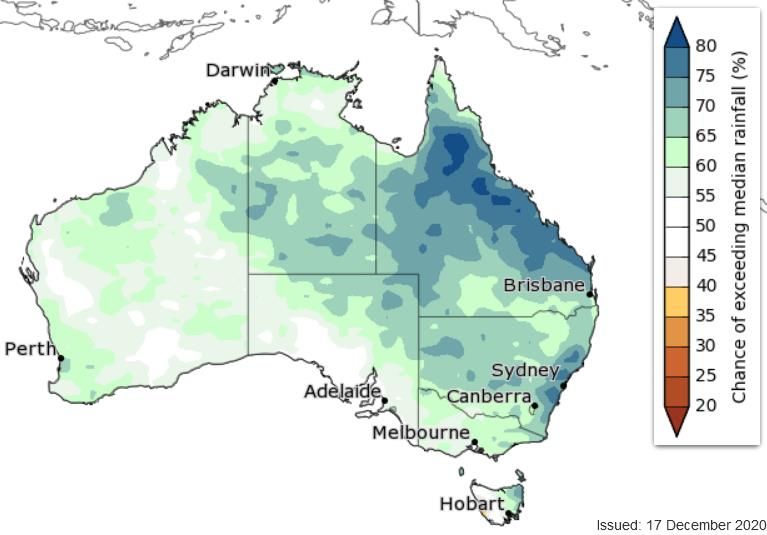
UKMO rainfall outlooks (updated 11th December)
The UKMO forecast is slightly drier for most of Queensland from January to March, with a probability of 60 – 80%
above median rainfall for CQ but around average for large areas of the state. March to May forecast rainfall is
around average for most of the continent. UKMO is not so optimistic about a long lasting La Nina.

    Figure 14: UKMO rainfall outlook January to March       Figure 15: UKMO rainfall outlook March to May

Some useful links to follow over the next few weeks
Bureau of Meteorology
Long-range weather and climate
Go to www.bom.gov.au/climate. There is a great deal of information on this page, including updates on all the
relevant climate drivers, what’s happening in the tropics, and seasonal outlooks (updated fortnightly).
Short term weather: MetEye
Go to www.bom.gov.au/australia/meteye. Type in your location and there will be a detailed forecast for the next
week. You can select either map view or text view.
Meteologix
This weather forecast product was detailed in our October update. You can compare a range of climate models
including ACCESS (BoM), ECMWF, UKMO, Canadian, GFS, to name a few. Most forecast 7 to 10 days, with GFS
forecasts out to 16 days. The link is meteologix.com/au/model-charts/euro/australia/significant-weather

Your central Queensland Climate Mates team
Peter Crawford (Miriam Vale) 0427 024 921, e-mail peter.crawford@usq.edu.au
Daniel Rea (Rockhampton)      0448 439 117, e-mail daniel.rea@fba.org.au
Nikki Pilcher (Moranbah)      0428 981 224, e-mail nikki.pilcher@usq.edu.au
Check out our new Central Queenslands Climate Mates Facebook page at:
https://www.facebook.com/climatematesCQ

                            We look forward to catching up again in 2021!

                                                                                                                7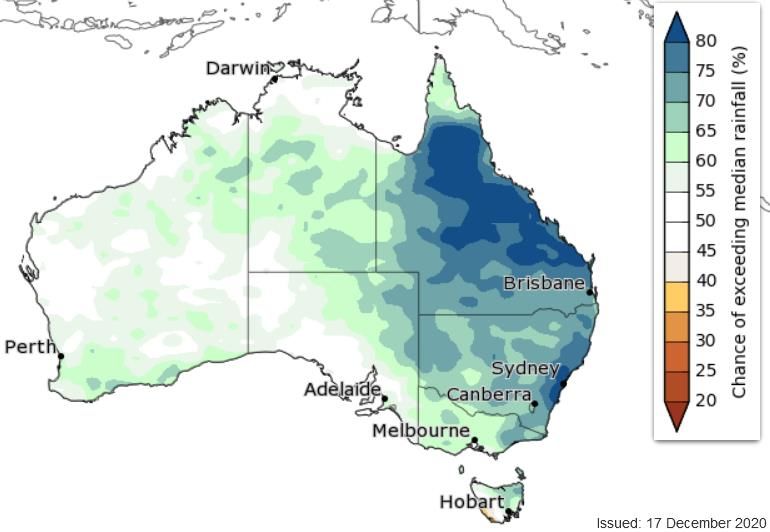


You can also read