How to get weather and pest data? - François Brun (ACTA) IPM CC, October 2016 with contributions of the other lecturers - MODELIA
←
→
Page content transcription
If your browser does not render page correctly, please read the page content below
How to get weather and pest
           data?

            François Brun (ACTA)
     with contributions of the other lecturers
             IPM CC, October 2016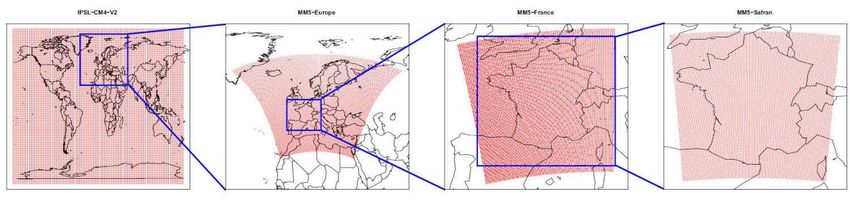
Which data ?
• Weather and Climate
  – Weather : conditions of the atmosphere over a short
    period of time
  – climate : atmosphere behavior over relatively long
    periods of time.

• Pest and Disease data
  – Effects of conditions : experiments
  – Epidemiology : observation / monitoring networks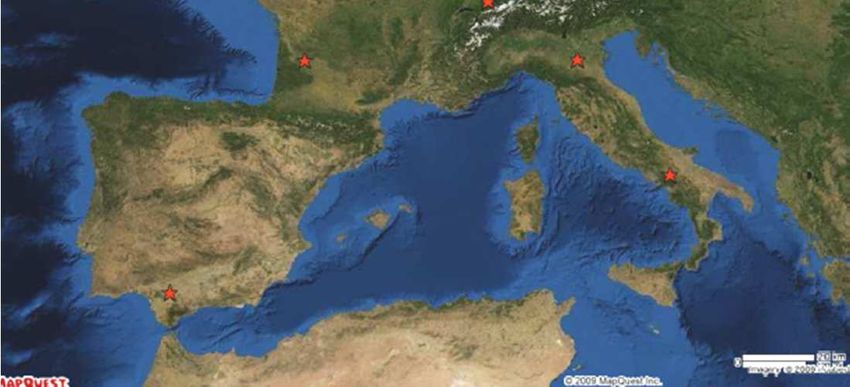
Weather and Climate data
Past Weather                      Historical Climate Data
– Ground weather station          –   Average and variability
– Satellite,…                     –   Real long time series
                                  –   Reconstituted long series
                                  –   Simulated long series (1961-
                                      1990 : reference)

Forecast Weather                  Climate projections
– Prediction with model           – Prediction with model
– Short term : 1h, 3h, 12h, 24,   – IPCC report
  3 day, 15 day.                  – 2021-2050 : middle of
– Seasonal prediction : 1 to 6      century period
  months (~ el nino )             – 2071-2100 : end of century
                                    period
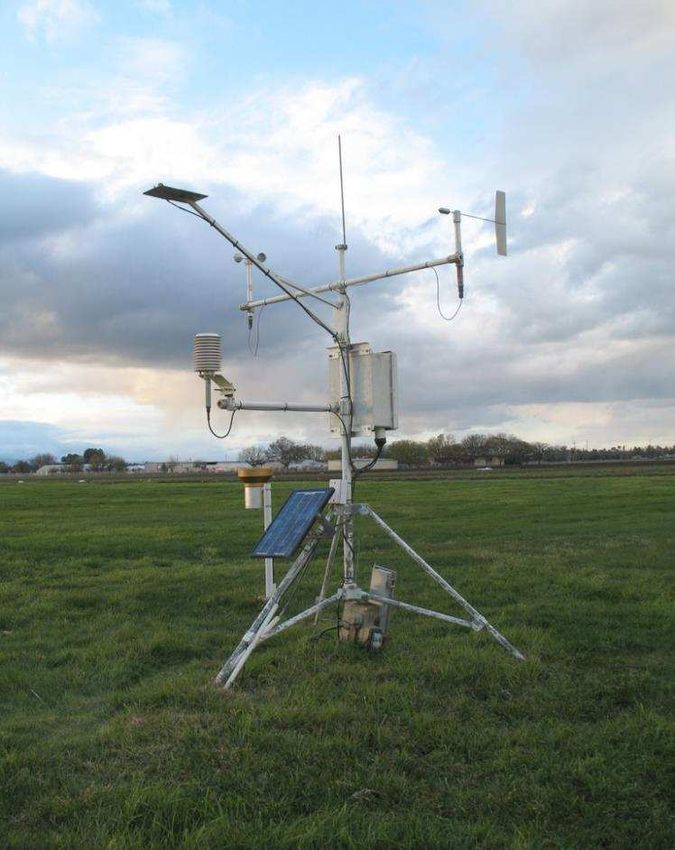
Past Weather data
Standard : at 2 m height
                              Standard weather station
                                                       Useful for us
                              • Frequent
                                 –   Thermometer : temperature
                                 –   Anemometer : wind speed
                                 –   Wind vane : wind direction
                                 –   Hygrometer : humidity
                                 –   Barometer : atmospheric pressure
                              • Less frequent
                                 – Ceilometer : cloud height
                                 – Present weather sensor
                                 – Visibility sensor
                                 – Rain gauge : liquid-equivalent
                                   precipitation
                                 – Ultrasonic snow depth sensor for
                                   measuring depth of snow
© Choi                           – Pyranometer : solar radiation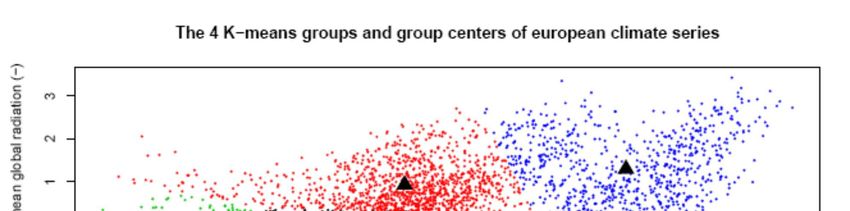
Past Weather data
In field / micro weather observations
                                  Wetness duration

    Temperature and humidity in
             canopy

                                       Water in soil

© Choi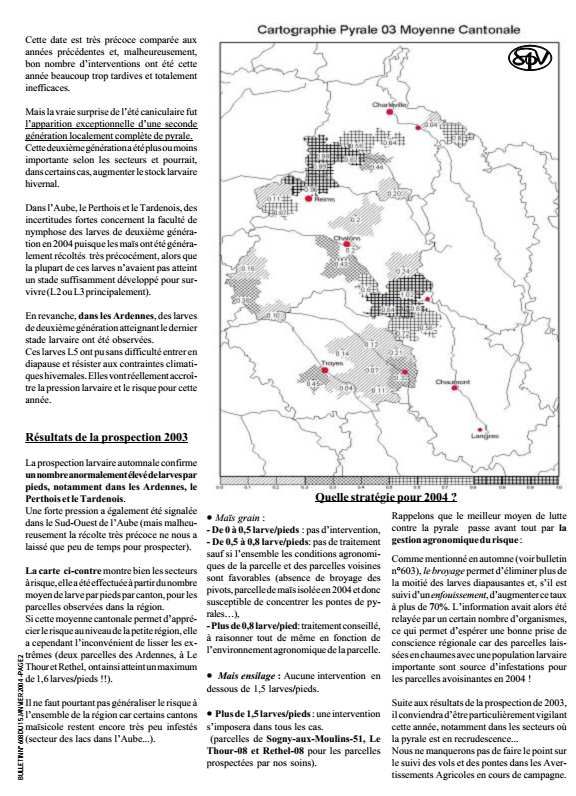
Past Weather data
Where to retrieve them ?
• Your own weather station on/near the experimental
  sites
           !!! The issue of validation, incomplete series
• You haven’t these data
  – Ask local others near the site : ok if a few…
           !!! The issue of validation, incomplete series
  – Use available databases
           Often validated, complete series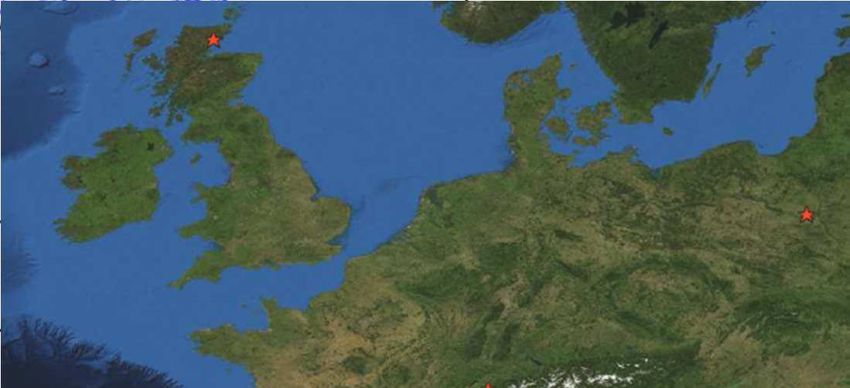
Past Weather : Example of databases
• Local database
  - RADOME-Meteo France (daily-hourly stations)
  http://publitheque.meteo.fr/okapi/accueil/okapiWebPubli/index.jsp

• International database
  – METAR (METeorological Aerodrome Report)
  Stations of airports
  https://mesonet.agron.iastate.edu/request/download.phtml
  – NASA Power data (gridded data)
  http://power.larc.nasa.gov/cgi-bin/agro.cgi?email=agroclim@larc.nasa.gov

  – Agri4Cast Data (European Commission)
      • Gridded data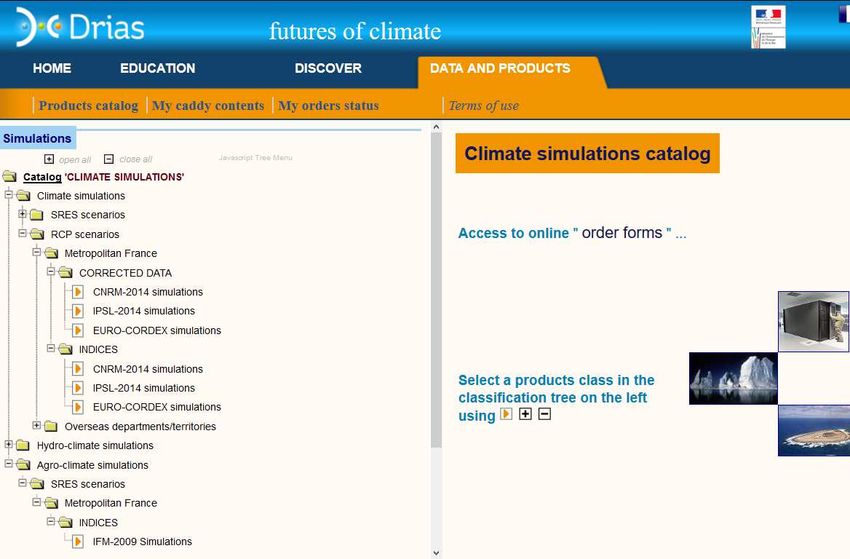
Agri4Cast Data (European Commission)

http://agri4cast.jrc.ec.europa.eu/DataPortal/Index.aspx
Agri4Cast Data : ex. Request for Toscana

Agri4Cast Data : ex. Request for Toscana

GRID_NO;LATITUDE;LONGITUDE;ALTITUDE;DAY;TEMPERATURE_AVG;PRECIPITATIO
73109;44.52363;9.89329;534;19750101;3.1;0
73109;44.52363;9.89329;534;19750102;2.6;0
73109;44.52363;9.89329;534;19750103;2;0
73109;44.52363;9.89329;534;19750104;2.3;0
73109;44.52363;9.89329;534;19750105;2.4;0
73109;44.52363;9.89329;534;19750106;2.5;0
73109;44.52363;9.89329;534;19750107;1.1;0
73109;44.52363;9.89329;534;19750108;2;0
73109;44.52363;9.89329;534;19750109;1.8;0
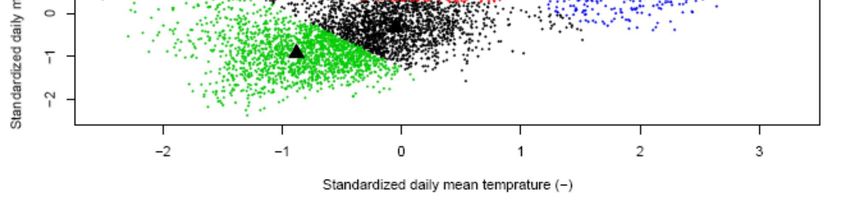
Example of use
• weathers series Typology

NOAA/OAR/ESRL PSD www.cdc.noaa.gov
• For wheatpest : standardized daily mean
  temperature and radiation (March 1st-July
  31st) calculated for each climate series (61
  years from 1948 to 2008 and 82 points,
  i.e. 5002 climate series).                     ENDURE D2.12
Example of R script to use Nasa data
# Function to retrieve weather data for one site (GPS) for several years (1st jan YearBeg TO 31th dec YearEnd)
fetch_weather
Forecast Weather data
Recent past data                          Next hours and
                           model(s)
(initial conditions)                      days predictions

 Example : http://forecast.io/raw

    Day of prediction
                                      Prediction day +7
                                      ??? Real ???

         Different model
Climate data : Emission scenarios
• Defined by Intergovernmental Panel on Climate
Change (IPCC)
• The SRES Scenarios
– Old one : used until the fourth IPCC report (IPCC Fourth
Assessment Report, AR4).
• The RCP Scenarios
– last IPCC report (AR5 report)
– RCP : Radiative Concentration Pathway
– used to produce climate projectionsWhat radiative forcing is?
change in the radiative balance (the difference between the incoming radiation and
outgoing radiation) at the top of the troposphere (10-16 km of altitude), due to a change
in a factors of climate change - such as the concentration of the greenhouse gas.
Name radiative forcing Concentration (ppm) Trajectory
RCP8.5 >8,5W.m-2 en 2100 >1370 eq-CO2 en 2100 Increasing
~6W.m-2 au niveau de ~850 eq-CO2 au niveau de Stabilization without
RCP6.0
stabilisation après 2100 stabilisation après 2100 overshoot
~4,5W.m-2 au niveau de ~660 eq-CO2 au niveau de Stabilization without
RCP4.5
stabilisation après 2100 stabilisation après 2100 overshoot
Pic à ~3W.m-2 avant 2100 Pic ~490 eq-CO2 avant
RCP2.6 Peak and then decline
puis déclin 2100 puis déclinGlobal model : ex. the IPSL-CM climate model
Climate data : large scale to local scale
• Example of MM5 France
            Global prediction,                                             Local prediction,
       Useful for climatic scientist                                    Useful for other scientist
Ex : global increase in T on sea surface                                  Ex : daily T and P

                                    downscaled

     IPSL-CM4             MM5-Europe               MM5-France                         SAFRAN
                           45 km resolution                                         15 km resolution
                                              Source : http://www.drias-climat.fr/accompagnement/sections/67
Example of Drias for French projection https://drias-prod.meteo.fr/okapi/accueil/okapiWebDrias/index.jsp
raw daily data from
simulations of 3 models
R Script for use Drias data :
 • ClimateChange_RCP.read.weather.drias.r
#setwd("D:/CourseSmach/data/weather/DRIAS")
setwd("D:/data/modelia_formation/Volterra2016/data/weather/DRIAS")
fichier ="tasmintasmaxtasprwsmax_metro_IPSL_WRF_histo_QT_REF_19710101-20051231.txt"
weather_drias1 = read.table(file = fichier,skip=54,sep=";",stringsAsFactor=F)
fichier ="tasmintasmaxtasprwsmax_metro_IPSL_WRF_rcp4.5_QT_RCP4.5_20060101-21001231.txt"
weather_drias2 = read.table(file = fichier,skip=54,sep=";",stringsAsFactor=F)
weather_drias=rbind(cbind(period="histo",weather_drias1),cbind(period="rcp45",weather_drias2))
names(weather_drias)=
c("period","Latitude","Longitude","Date","tasmin","tasmax","tas","pr","wsmax")
rm(fichier,weather_drias1,weather_drias2)

head(weather_drias)
attr(weather_drias, "nom_variable")= c("Date : Date du jour sous la forme 'AAAAMMJJ'",
                      "Latitude, Longitude : position du point de grille SAFRAN en degres decimaux
(WGS84)",
                      "tasmin : Temperature minimale journaliere a 2 m [K]",
                      "tasmax : Temperature maximale journaliere a 2 m [K]",
                      "tas : Temperature moyenne a 2 m [K]",
                      "pr : Precipitations totales [mm jr-1]",
                      "wsmax : Vent maximal sans rafales [m/s]")

weather_drias$date=as.Date(paste(weather_drias$Date),"%Y%m%d")
weather_drias$year=as.numeric(format(weather_drias$date,"%Y"))
weather_drias$Tmin=weather_drias$tasmin-273.15
weather_drias$Tmax=weather_drias$tasmax-273.15
weather_drias$Tmean=(weather_drias$Tmin+weather_drias$Tmax)/2
Available data and unit !
head(weather_drias)
period Latitude Longitude Date tasmin tasmax tas pr wsmax date year Tmin Tmax Tmean
1 histo 43.5677 1.4967 19710101 267.1 277.5 274.3 0.52 0 1971-01-01 1971 -6.05 4.35 -0.85
2 histo 43.5677 1.4967 19710102 274.7 276.1 275.5 1.06 0 1971-01-02 1971 1.55 2.95 2.25
3 histo 43.5677 1.4967 19710103 270.7 275.1 274.1 9.21 0 1971-01-03 1971 -2.45 1.95 -0.25
4 histo 43.5677 1.4967 19710104 268.4 269.9 270.0 0.61 0 1971-01-04 1971 -4.75 -3.25 -4.00
5 histo 43.5677 1.4967 19710105 270.0 275.3 271.9 1.18 0 1971-01-05 1971 -3.15 2.15 -0.50
6 histo 43.5677 1.4967 19710106 272.5 276.9 275.0 0.36 0 1971-01-06 1971 -0.65 3.75 1.55
• "Date : Date du jour sous la forme
'AAAAMMJJ'",
• "Latitude, Longitude : position du point
de grille SAFRAN en degres decimaux
(WGS84)",
• "tasmin : Temperature minimale
journaliere a 2 m [K]",
• "tasmax : Temperature maximale
journaliere a 2 m [K]",
• "tas : Temperature moyenne a 2 m [K]",
• "pr : Precipitations totales [mm jr-1]",
• "wsmax : Vent maximal sans rafales
[m/s]")NetCDF : Network Common Data Form • Extension *.nc / *.cdf • self-describing : a header with meta data and structure • Compact format ant for a fast access : difficult to read in excel => need an interface • R package : https://cran.r-project.org/web/packages/RNetCDF
Pests and Diseases data
• literatures, reports, …
  => meta-analysis

• experiments,…

• Monitoring network
  – raw data
  – Aggregated information in weekly report
Example : a monitoring network Pests/Diseases
    From field to database (Vigicultures® for arable crops in France)

  At the beginning of the campaign                                     Each week
  Field choice -> regional network

                                                          Phenology of wheat            Counting Slugs

                                                                                             And
                                                                                             others

     Blé tendre hiver en Champagne-Ardenne         septoria              Brown rust

    Characterization of field plots            harmonized protocol and quantification
                              Cultivar
                              Date of sown            Several dozen variables
                              Precedent crop                                   (stade=Z31, SEPF1=5,…)
A lot of information capitalized!
Cumulated in the database from 2008 to 30 juin 2015
Nb Nb
Espèces Nb parcelles observateurs observations
Betterave 1937 307 45037
Blé dur (hiver et printemps) 950 205 53509
Blé tendre (hiver et printemps) 7895 1408 929731
Colza 6783 1225 612761
Féverole (hiver et printemps) 399 162 23201
Lin fibre (hiver et printemps) 674 198 40558
Lin graine (hiver et printemps) 134 64 7097
Luzerne 62 21 11856
Maïs doux 118 15 2478
Maïs grain 6437 683 191342
Orge (hiver et printemps) 3550 963 379789
Pois protéagineux (hiver et printemps), pois chiche 1228 454 77433
Pomme de terre 1043 110 55515
Sorgho 33 13 486
Tabac 60 14 1620
Tournesol 961 282 65188
Triticale 160 68 20870
32424 2518471
Source : CODIR Vigicultures® - 15 26
septembre 2015Example of valorization
A tool to analyse the epidemiological Dynamics
Sur feuille F1, au 28 mai 2015
• estimating the dynamics of the
incidence of the disease regionally
from observations and taking into
account certain practices.
• Application to wheat Septoria
– data : weekly frequency of presence
of Septoria on 3 last leaves from
Vigicultures®
– Method : generalized mixed model
Provide a service to the producers
of the data: a report up to date
automatically
Source : Michel et al., 2015Example of septoria data data/septoria/BDD_septoriose.txt
Aggregated information in weekly report
• http://www.pestobserver.eu
1er avertissement agricole Bourgogne (1946)

    30                                  SMACH 6-7 octobre 16
31
How to use these data ?
pests/diseases data
                             model
 past weather data

                                                Scientists
                        build & evaluate
   on a few sites
 past weather data
                             model
Pests/Diseases data
                        build & evaluate
  on a large scale

   Current year             model

                                             Agricultural
                                              advisers
   weather data         prediction now
Current year + short
                             model
  term prediction
                       prediction +7-14 d
   weather data

                                            Scientists,
                             model

                                              maker
                                              policy
  Climate Change
                         Future climate
     projections
                            change
Conclusion • Choice depends – on your research question – on the methodological approach
a lot of of database available online !
https://mesonet.agron.iastate.edu/request/download.phtml
http://www.dwd.de/EN/ourservices/cdcftp/cdcftp.html
https://www.ncdc.noaa.gov/cdo-web/datatools
http://power.larc.nasa.gov/cgi-bin/agro.cgi?email=agroclim@larc.nasa.gov
http://publitheque.meteo.fr/okapi/accueil/okapiWebPubli/index.jsp
https://catalog.data.gov/dataset/noaas-climate-divisional-database-nclimdiv
https://data.noaa.gov/dataset/integrated-surface-global-hourly-data
http://www.esrl.noaa.gov/psd/data/gridded/
http://www.wmo.int
http://cmip-pcmdi.llnl.gov/cmip5/data_portal.html                            • See the excel file
http://www.worldclim.org/
http://data.giss.nasa.gov/impacts/agmipcf/agmerra
http://tools.agmip.org/acsgtr.php
                                                                                   – Weather
http://www.cordex.org
http://dias-dss.tkl.iis.u-tokyo.ac.jp/ddc/viewer?ds=d4PDF_RCM&lang=en              – Climatic
http://www.drias-climat.fr
https://www.stateclimate.org/climate_services_catalog                                projection
http://artsandsciences.sc.edu/geog/hvri/historical-climate-data-catalogue
http://data.worldbank.org/data-catalog/cckp_historical_data
http://www.realclimate.org/index.php/data-sources/
https://iridl.ldeo.columbia.edu
https://earthengine.google.com/datasets/
https://www.sciencebase.gov/catalog/
http://www.usda.gov/wps/portal/usda/usdahome?navid=data
https://www.loc.gov/rr/scitech/SciRefGuides/weather.html
http://www.climatesmartplanning.org/data.html
http://www.emetsoc.org/resources/education-qualification/educational-catalogues-and-databases/
http://adam-digital-compendium.pik-potsdam.de/adaptation-catalogue/option-database/drought.html
You can also read