Supplement of Water exchange between the Sea of Azov and the Black Sea through the Kerch Strait
←
→
Page content transcription
If your browser does not render page correctly, please read the page content below
Supplement of Ocean Sci., 16, 15–30, 2020
https://doi.org/10.5194/os-16-15-2020-supplement
© Author(s) 2020. This work is distributed under
the Creative Commons Attribution 4.0 License.

Supplement of
Water exchange between the Sea of Azov and the Black Sea through
the Kerch Strait
Ivan Zavialov et al.

Correspondence to: Alexander Osadchiev (osadchiev@ocean.ru)

The copyright of individual parts of the supplement might differ from the CC BY 4.0 License.
The BSAS12 model briefly described in the paper is a new configuration of the European ocean general
circulation model NEMO for the Black Sea and the Azov Sea. BSAS12 is developed jointly at the Ocean
Modelling Laboratory (OML) of the Shirshov Institute of Oceanology in Moscow and the MultiscalE
Ocean Modelling (MEOM) group of the Institut des Géosciences de l’Environnement in Grenoble with
the main objective to study the processes driving the exchanges between the Black Sea and the Azov Sea.
We present in this Supplementary Material a first assessment of the surface circulation produced the
model simulation described in the paper.
1. Model spin-up
The model has been run from 1992 to 2017, and
the time evolution of the basin-integrated
quantities suggest two periods.
1992-2002: The basin-averaged salinity does not
exhibit any trend during the first 10 years of the
run (Fig. 1, top), indicating that evaporation,
precipitation, river runoff and salt flux through
the Bosphorus strait balance each other during
this period. For that period, the basin-averaged
temperature (Fig. 1, middle) shows a warming
trend (0.025°C/y), an indication of a non-
equilibrated heat balance. The Sea Surface
Height (SSH, Fig. 1 bottom) shows a quick
adjustment in the first year of the run (a drop of
~10 cm) but remains rather stable during the run.
2003-2017: After 2002, the basin-averaged
Figure 1: Time evolution of the basin averaged monthly salinity shows a small (~0.0012 psu/y) but
mean Salinity (top), Temperature (middle), and SSH regular positive trend. The basin-averaged
(bottom) for the whole duration of the simulation. temperature show a small decrease in the early
2000s but the warming trend resumes afterwards
but is smaller. The SSH also shows a small drop
after 2002. This suggest a change in the forcing
fields (ERAinterim reanalysis) that needs to be investigated.
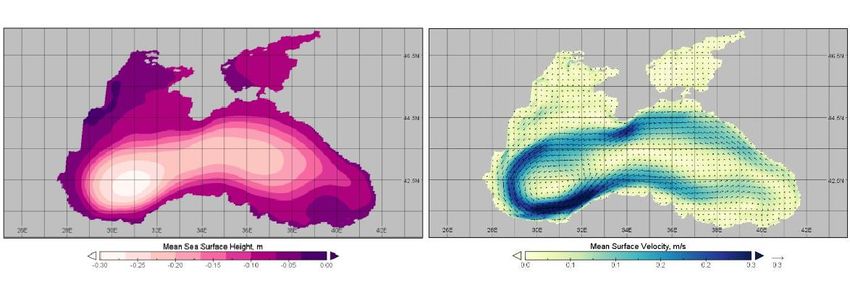
2. Large-scale mean circulation
The long-term time-mean large-scale circulation is shown in Fig. 2. The SSH and current patterns exhibit
the major circulation patterns described in the literature: the Western and the Eastern cyclonic gyres and
the Rim Current. The amplitude of the Rim Current (10 to 40 cm/s) is in good agreement with the
geostrophic currents derived from altimetry and floats by Menna and Poulain (2015). The Sevastopol and
the Batumi anticyclonic eddies, often reported in schematics of the circulation (e.g. Staneva et al., 2011),
do not appear as strong features in the time-mean, although they are clearly among the most energetic
features in the instantaneous flow (Figs. 3 and 4). Their time and space variability is such that their
signature in the mean does not appear as a coherent eddy signal. The mean SST (Fig. 2c) is in very good
agreement with the remote sensed estimates recently proposed for the period 1982-2015 by Sakalli and
Basusta (2018), the modelled SST being slightly warmer. This difference could be explained by the
different periods of averaging, the temperature increase over the deep Black Sea being significant from
the early 1990s (Sakkali et Batusta, 2018, Shapiro et al., 2010).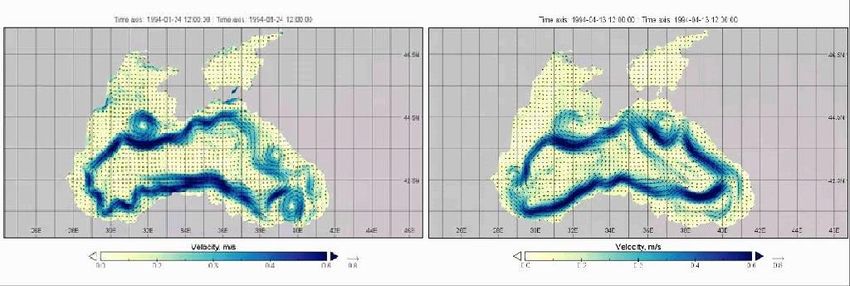
(a) (b)
(c)
Figure 2: Time mean for the period 1999-2009 of (a) SSH, (b) currents and c) SST simulated by BSAS12 (the total
duration of the run is 1992 to 2017).
3. Eddying circulation
The horizontal grid-resolution of the model is ~6.75 km. We estimate the eddy-scale LE to be LE=½,
with =2RD being the length-scale associated to the first radius of deformation RD. With this definition,
LE is an estimate of the characteristic eddy diameter. With RD=~20 km in the open sea, an estimate of the
eddy scale is LE=~60 km. Therefore, there are 9 grid-points to resolve the eddy scale, which is enough to
resolve the largest eddies. Nevertheless, we consider this model as eddy-permitting (and not eddy-
resolving) because it does not properly resolve the shelf eddies that have a smaller characteristic length-
scale. We also mention that the use of the UBS advection scheme for momentum (Upstream-Biased
Scheme, Shchepetkin and McWilliams, 2005, see also the NEMO documentation), which prevents the use
of an explicit viscosity and significantly reduces the dissipation of the mesoscale instabilities. This allows
the generation of numerous and energetics mesoscale eddies (Figs. 3 and 4).
The instantaneous surface (5 m depth) circulation is illustrated in Figure 3 with two currents snapshots. At
large scale, it agrees reasonably well with the previous analyses based on obervations or models (e.g.
Staneva et al., 2001, Kovalev et al., 2003, Stanev, 2005, Menna and Poulain, 2015, Kubryakov et al.,
2016, Miladinova et al., 2017). The main circulation features (i.e. the Rim Current, the Western and the
Eastern cyclonic gyres, the Sevastopol and Batumi eddies) are well represented and exhibit realistic
amplitudes (instantaneous currents between 30 to more than 60 cm/s) and a large variability.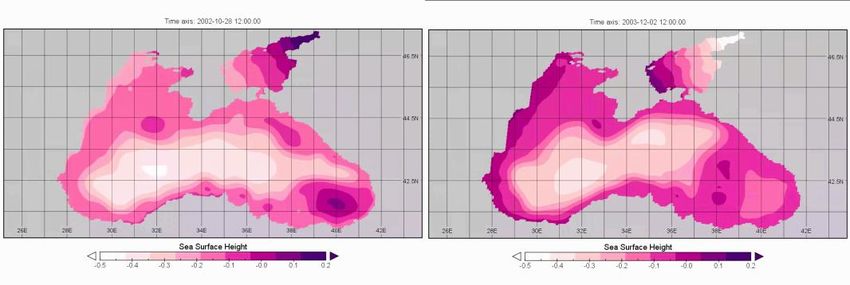
Figure 3. Instantaneous (daily mean) currents simulated by the BSAS12 model on 23 January 1994 (left), and on 13
April 1994 (right).

The variability of the flow is again illustrated with instantaneous maps of the SSH. Fig. 4a shows a
situation where the western and eastern cyclonic gyres form a single gyre extending across the whole
basin, with well-formed Sevastopol and Batumi anticyclonic eddies. The Caucasus (or Sochi) eddy
appears stretching along the Caucasus coast, and a train of small anticyclones is seen along the Turkish
coast. These features are regularly reported in the literature (e.g. Stanev, 2005). The Azov Sea shows a
typical situation of south-westerly winds pushing waters up north. Fig. 4b shows a situation where the
centres of the western and eastern gyres are separated and the eastern gyre does not extend much to the
East. The Sevastopol eddy is weak and a weak cyclonic circulation feature is found in place of the Batumi
eddy. Again, similar situations are reported in the literature (e.g. Kubryakov et al., 2015). The Azov Sea is
in a situation of strong wind from the Northeast.

                           (a)                                                (b)

Figure 4. Instantaneous (daily mean) SSH simulated by the BSAS12 model (a) on 26 October 2002 and (b) on 1 st
December 2003.

The grid-resolution of 1/12° clearly allows the generation and propagation of large scale eddies and
meanders in the Rim Current. The eddy kinetic energy (EKE, Fig. 5) is high (> 200 cm2s-2) in the Rim
Current. The highest EKE values (between 400 to 500 cm2s-2) are found along the Crimean peninsula and
in the region where the Sevastopol Eddy is frequently observed. The western shelf break is also a region
of high EKE values. The southern part of the Rim Current (along the Turkish coast) does present smaller
EKE values (300 cm2s-2), suggesting a less unstable current. The locations of large eddy variability agree
well with the analysis of the eddy variability of Menna and Poulain (2015) using floats and altimetry
observations, and that of Kubryakov et al. (2016).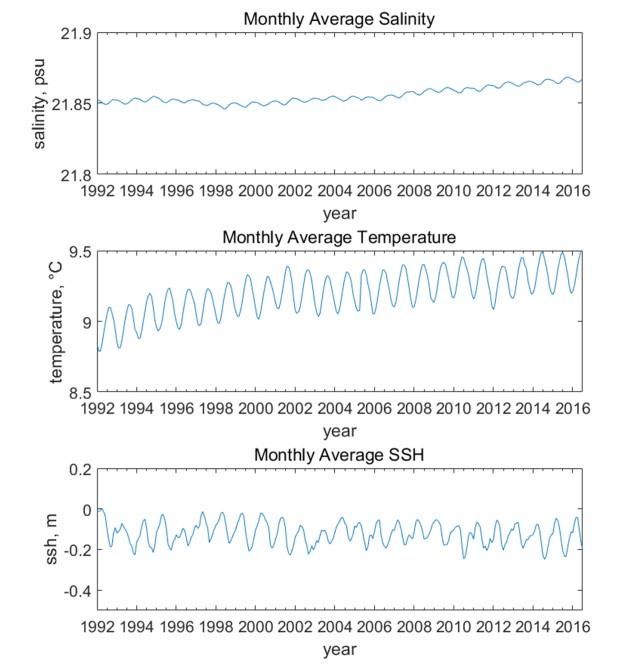
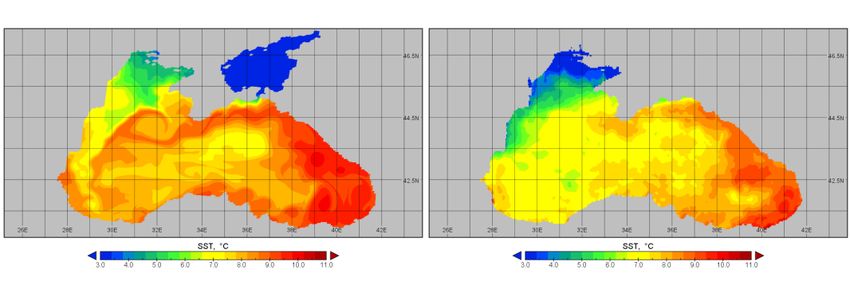
Figure 5. Mean eddy kinetic energy for year 1994.

4. Hydrography
As already mentioned, the basin averaged simulated temperature reveals a warming trend (Fig. 1, middle).
Such trends (often associated with salinity trends) are very common in ocean only simulations (i.e. not
coupled with an atmospheric model) where the atmospheric variables used to calculate the surface fluxes
with bulk formulae are prescribed (Barnier, 1998). Such trends reflects a misrepresentation of the ocean
feedback to the atmosphere, and a non-equilibrium between the initial conditions in T and S (generally a
climatology that does not reflect the instantaneous state of the ocean corresponding to the atmosphere)
and the prescribed atmosphere from which the fluxes are calculated. These trends are flattening after a
few years (or a few decades for large oceans) but produce biases in T and S fields. These biases are most
frequently towards a warmer and saltier ocean but do not prevent to use the model simulations to study
the variability and its generating processes.
In the present case, the warming corresponding to the temperature trend is mostly concentrated in the
depth range 70 to 110 m, and occurs within the Western and Eastern gyres (no figure shown). After 2003,
this warming is accompanied by a salinity increase. Note that these biases compensate each other in
density, which limits their impact on the geostrophic flow.
The sea surface temperature also shows a positive drift in temperature, consistent with the warming trend
in the deep Black Sea since the early 1990s (Shapiro et al., 2010, Sakali and Basusta, 2018). The trend
corresponds roughly to an SST increase of 2°C for both the Black Sea and Azov Sea and amounts to
~0.08°C/y, which corresponds to an increase of about 2°C over 25 years and compares well with that
estimated from remote sensed SST data for the same area by Sakalli and Basusta (2018).
The winter SST situation on 15 January 1994 is compared with the satellite SST produced by the
Copernicus Marine Services (CMEMS) in Fig. 6. The partition of water properties in the basin are
consistent between the data sets. The coldest and freshest waters are found on the western shelf of the
Black Sea. The eastern Black Sea is the place where the warmest waters are found and the Rim Current
generally carries waters warmer than those inside the western and eastern gyres. However, the modeled
waters are always warmer than the satellite product, suggesting that the warming trend of the model is too
large.
(a) (b)
(c)
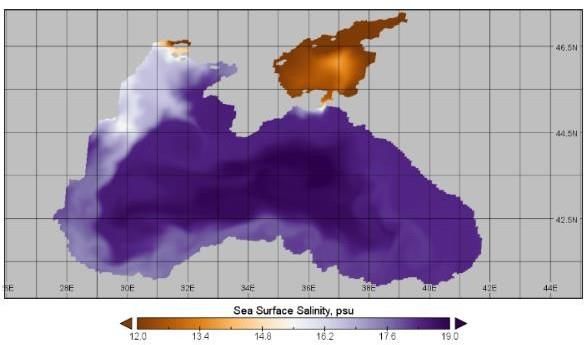
Figure 6. Instantaneous (daily mean) field of (a) the BSAS12 model SST, (b) the CMEMS SST (based on satellite
observations), (c) the BSAS12 model SSS on 15 January 1994.
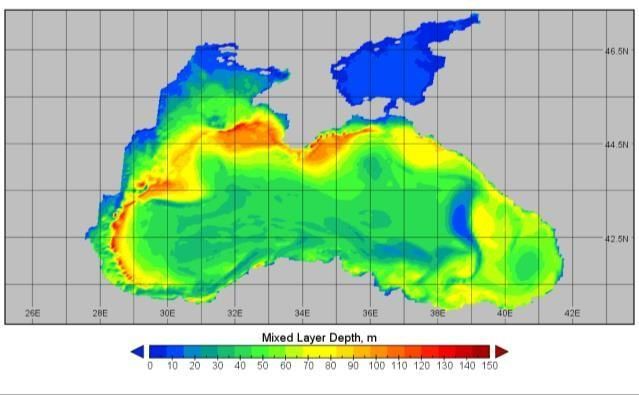
A snapshot of the Mixed Layer Depth (MLD) is shown in Fig. 7 for a day when MLDs in 2003 were at its
maxima. The MLD pattern is significantly influenced by the eddy field and the freshwater runoff.
Shallow MLD are found on the western shelf along the coast where the freshening by the river runoff is
important. Deep winter convection (MLD > 70 m) occurs on the outer side of the Rim Current, on the
East and West sides of Crimea, and along the Bulgarian shelf break.
Figure 7. The mixed layer depth on 25 February 2003.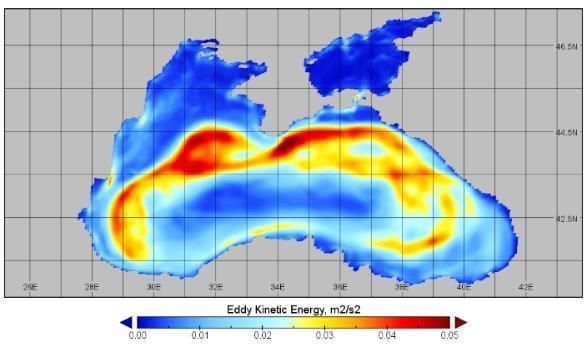
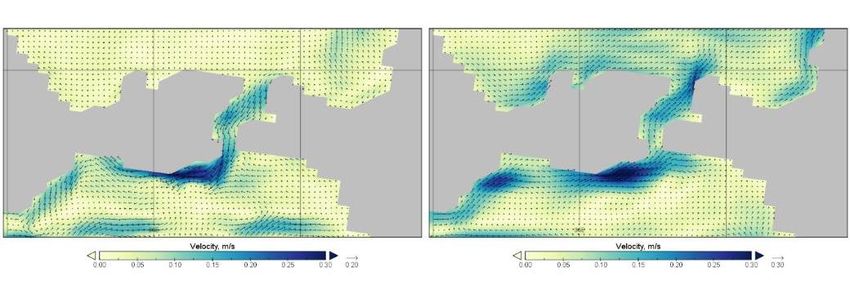
5. Kerch Strait through-flow
The Kerch Strait has been widened and represented by several grid-points in order to maintain the
possibility of a shear in the flow (Fig. 8). Despite this increase in channel width, the volume transport
through the strait is in a reasonable agreement with estimates published in the literature, as discussed in
the paper. This suggests that the transport through the strait is consistent with hydraulic control dynamics,
and thus depends to first order of the pressure difference (i.e. the wind stress) on each side of the strait
rather than from the details of the flow within the strait. This is confirmed by the analysis shown in the
paper, but also in sensitivity experiments that we carried out with different friction in the model (not
shown). We found that the transport through the strait was rather insensitive to the side-wall boundary
condition (free-slip or no-slip).
The flow in the strait exhibits velocities of the order of 20 cm/s that are amplified at the exit of the strait
in both cases shown (Fig. 8). The amplification comes from the circulation that joins the flow after it
exited from the strait.

                           2 January 1994                            3 February 1994

Figure 8. Instantaneous currents (top), temperature (middle) and salinity (bottom) in the Kerch Strait area at two
different dates describing situations comparable to those shown in the paper. The left plots is for 2 January 1994
and the right plots for 3 February 1994.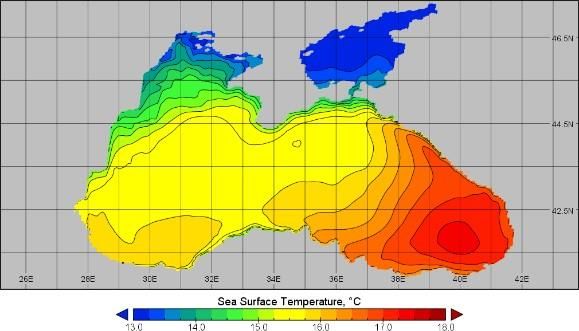
You can also read