CUSTOMER SATISFACTION INDEX OF SINGAPORE 2018 - Q3 SCORES FOOD & BEVERAGE AND TOURISM RESULTS OVERVIEW - Institute of Service ...
←
→
Page content transcription
If your browser does not render page correctly, please read the page content below
CUSTOMER SATISFACTION INDEX
OF SINGAPORE 2018

Q3 SCORES
FOOD & BEVERAGE AND TOURISM

RESULTS OVERVIEW
2018 Q3 SCORES
                                         FOOD & BEVERAGE AND TOURISM

     75.1 Tourism                                   74.2 Food & Beverage

     75.3 Hotels                                    75.3 Snack Bars & Food Kiosks                73.9 Cafes & Coffee Houses
     Luxury & Upscale Hotels                        74.5 Old Chang Kee                           75.6 Starbucks
     75.7 The Ritz-Carlton                          71.7 Jollibean                               72.3 Ya Kun
     75.5 Marina Bay Sands                          75.8 Other snack bars & food kiosks          71.4 Toast Box
     74.9 Grand Hyatt                                                                            74.2 Other cafes & coffee houses
     74.7 Pan Pacific Singapore                     74.4 Restaurants
     74.4 Shangri-La                                76.9 TungLok Signatures*                     73.6 Fast Food Restaurants
     74.0 Hotel Michael                             75.2 Crystal Jade Kitchen                    74.9 McDonalds
     73.2 Marina Mandarin                           74.9 Soup Restaurant                         74.2 Burger King
     73.1 Mandarin Orchard                          74.7 Fish & Co                               72.7 KFC
     Economy Hotels                                 74.6 Boon Tong Kee                           71.9 Mos Burger
     71.3 Fragrance Hotel                           74.6 Thai Express                            71.9 Subway
     70.6 Hotel 81                                  74.5 Sakae Sushi                             72.1 Other fast food restaurants
                                                    74.5 Din Tai Fung
     75.8 Other hotels                              74.5 Swensen’s
                                                    74.2 Jack’s Place
     74.1 Attractions                               74.2 Astons
     75.6 Sentosa                                   74.1 Ajisen Ramen
     74.7 Singapore Zoo                             74.0 Manhattan Fish Market
     74.4 Gardens By The Bay                        73.8 Sushi Tei
     74.2 Jurong Bird Park                          73.8 Seoul Garden
     73.9 Singapore Flyer                           73.6 Crystal Jade La Mian Xiao
     73.9 River Safari                              Long Bao
     73.6 S.E.A. Aquarium                           73.0 Dian Xiao Er
     73.1 Universal Studios                         72.7 Nando’s
     72.8 Night Safari                              72.0 Pizza Hut
     72.8 Adventure Cove                            71.6 Xin Wang Hong Kong Cafe
     70.9 Singapore Discovery Centre                75.2 Other restaurants
     72.0 Other attractions

This chart summarises the results of the CSISG 2018 satisfaction        The sparklines indicate the satisfaction score of their respective
scores in the Food & Beverage and Tourism sectors at the sector,        sectors, sub-sectors and companies over the past few years.
sub-sector and company levels.
                                                                                statistically significant increase in customer satisfaction
The sector scores (in gold) represents a weighted average of their              from 2017 to 2018
respective sub-sector scores (in blue). Satisfaction scores for sub-
                                                                                statistically significant decrease in customer satisfaction
sectors with individual company scores are weighted averages of
                                                                                from 2017 to 2018
these individual company scores.
All scores displayed are accurate to one-decimal place. Entities are            no significant year-on-year change in customer
presented in decreasing levels of satisfaction.                                 satisfaction score

* Companies indicated with an asterisk(*) are companies that have
  performed significantly above their sub-sector average.
* Sub-sectors indicated with an asterisk(*) are sub-sectors that
  have performed significantly above their sector average.
CSISG 2018 THIRD QUARTER RESULTS OVERVIEW
The Customer Satisfaction Index of Singapore (CSISG) computes customer satisfaction scores at the national,
sector, sub-sector, and company levels. The CSISG serves as a quantitative benchmark of the quality of goods
and services produced by the Singapore economy over time and across countries. This is the CSISG’s twelfth
year of measurement.

THIRD QUARTER RESULTS HIGHLIGHTS
Customer satisfaction saw statistically significant*
year-on-year improvements in both Food &                                                                                  Year-on-Year
                                                                                                       CSISG 2018
                                                                                                                            Change
Beverage (F&B) and Tourism sectors. The F&B
sector climbed 3.5% year-on-year to score 74.2
                                                                                Tourism                    75.1
points on a 0 to 100 scale. The Tourism sector
recorded a relatively more modest 1.2% year-on-                                 Hotels                     75.3
year improvement to score 75.1 points.
                                                                              Attractions                  74.1
In both instances, these performances represented
a fourth consecutive year of increase in customer                          Food & Beverage                 74.2
satisfaction scores and the highest recorded scores
in the 12-year history of the national CSISG study.                  Snack Bars & Food Kiosks              75.3

The F&B sector comprises of four sub-sectors:                                 Restaurants                  74.4
Cafes & Coffee Houses, Fast Food Restaurants,
Restaurants, and Snack Bars & Food Kiosks. While                       Cafes & Coffee Houses               73.9
each of these four sub-sectors saw higher scores
year-on-year, significant improvements were only                        Fast Food Restaurants              73.6
recorded for the Fast Food Restaurants and
Restaurants sub-sectors. Fast Food Restaurants                      Figure 1: Tourism and F&B Sector and sub-sector performance. A
scored 73.6 points, a 2.7% improvement, while                       green marker denotes a statistically significant improvement while the
Restaurants scored 74.4 points, a 4.0%                              blue marker denotes no significant change from the previous year.
improvement.

The Tourism sector comprises of the Attractions
and the Hotels sub-sectors. Year-on-year,
Attractions saw a significant 1.1% improvement in
customer satisfaction, scoring 74.1 points, while
the Hotels sub-sector’s performance, at 75.3
points, remained statistically unchanged.

Figure 1 illustrates the Q3 results and each sector
and sub-sectors respective year-on-year movements.

*Statistical significance for the CSISG study is measured at a confidence interval of 90%.
THIRD QUARTER KEY FINDINGS
Satisfaction with Attractions Significantly Higher When Visitors’ Search for Information Prior to Visit
Visitors that searched for information about the attraction prior to their
visit were significantly more satisfied than those that did not. In fact,
these visitors that did prior research also had significantly higher
scores in several other metrics recorded in the study, including
Customer Expectations, Perceived Quality, Perceived Value, and
Customer Loyalty.
Analysis between tourist and local visitors reveal this observation was
seen primarily among tourist respondents; these significant differences
are illustrated in Figure 2.
This suggest that Attraction operators can use this opportunity to shape
and frame customer expectations beforehand through interaction
channels such as marketing communications and social media; it can
set the stage for these guests to better experience their product
offering.
Figure 2: Performance of the five core CSISG
model dimensions for Attractions sub-sector
tourist respondents, segmented by those that
searched for information prior to visit and
those that did not.
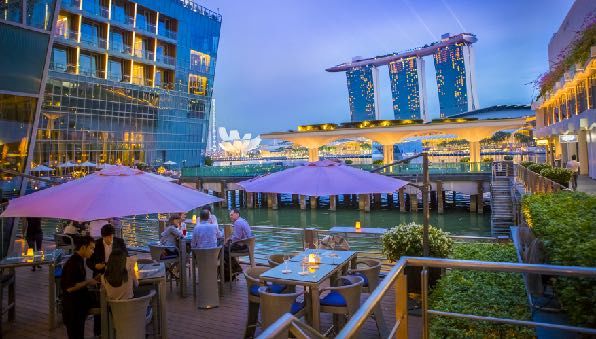
Product and Service Process Attributes at Upscale & Luxury Hotels Improve Year-on-Year; Staff Attributes
Remain Flat
Although several product and service process attributes at Upscale &
Luxury Hotels improved year-on-year, staff-related attributes remain
unchanged.
Specifically, the attributes “Responsiveness of staff”, “Helpfulness of
staff”, “Staff's ability to communicate professionally”, and “Staff's
ability to provide local recommendations and information” did not
record any significant year-on-year movements.
Impact analysis of the segment reveal the lattermost attribute, i.e.,
“Staff’s ability to provide local recommendations and information”,
was the largest driver of guests’ perceptions of quality.
Figure 3: Luxury & Upscale Hotels’ top 5
Figure 3 illustrates the top five drivers of quality for the Luxury & attributes with impact on Perceived Quality.
Upscale Hotels segment; Service elements remain key differentiators.
Hotel operators should focus on improving attributes that have the
greatest impact on quality; this will afford them the most efficient use
of resources when improving customer satisfaction.
*Statistical significance for the CSISG study is measured at a confidence interval of 90%.Fast Food Self-order Kiosk Users Found the Ordering Process Simpler
Within the Fast Food Restaurants sub-sector, customers that
used Self-order Kiosks as their most frequent method to
place their orders were found to have similar levels of
customer satisfaction when compared to customers who most
frequently place their orders via the traditional way, i.e., with
a counter service staff.
In addition, the group of customers that frequent kiosks
ordering rated a key metric ‘Ordering process is simple’
appreciably higher than customers ordering via the counter
service staff. This is illustrated in Figure 4.
Further analysis showed that a simple ordering process was a
significant driver of customers’ perceptions of quality. Thus,
Self-order Kiosks that can help simplify ordering processes
will likely lead to a more positive dining experience over time. Figure 4: Fast Food respondents’ Ratings for
“Ordering Process is Simple”, segmented by those
that frequently used counter service staff and those
that frequented Self-order Kiosks.
Majority of F&B Customers Still Prefer Ordering through Service Staff
The proportion of F&B respondents that prefer to use self-
ordering systems is still in the minority, with a majority of
respondents indicated a preference for service staff.
As illustrated in Figure 5, the most consumer resistance to
adopting self-order systems was observed at Restaurants,
with only 6.3% of respondents indicated a preference to self-
order. Further analysis within demographic segments also
reveal older customers, i.e., 50 years of age and above, as
the most resistant group.
While recognising the potential benefits of self-order
Figure 5: Proportion of F&B respondents that prefer to
systems, F&B operators should be cognisant of these order through self-ordering systems at each F&B sub-
preferences when introducing new service processes and sector.
systems such as Self-order Kiosks.
*Statistical significance for the CSISG study is measured at a confidence interval of 90%.CSISG BACKGROUND CSISG scores are generated based on the econometric modelling of survey data collected from end-users after the consumption of products and services. Company scores are weighted based on a separate incidence study. This incidence study helps determine each company’s sample profile and the local-tourist weights. Sub-sector scores are derived as a weighted average of company scores, in proportion to the local and tourist incidence interactions with the constituent companies. Sector scores are derived by aggregating the sub-sector scores proportionately to each sub-sector’s revenue contributions. Finally, the national score is weighted according to each sector’s contribution to GDP. CSISG scores customer satisfaction on a scale of 0 to 100 with higher scores representing better performance. Under a quarterly measure-and-release system, distinct industry sectors measured within each calendar quarter have their results released the following quarter. Companies in the Retail and Info-Communications sectors were measured in the first quarter, Air Transport and Land Transport in the second quarter, Food & Beverage and Tourism sectors in the third quarter, and finally the companies of Finance & Insurance and Healthcare sectors, in the fourth quarter. The national score for 2018 will then be computed using the data collected over these four quarters. For this third quarter of 2018, results for the F&B and Tourism sectors were collected and analysed. The F&B sector is made up of the Cafes & Coffee Houses, Fast Food Restaurants, Restaurants, and Snack Bars & Food Kiosks sub-sectors. The Tourism sector comprises of the Attractions and Hotels sub-sectors. CSISG 2018 FIELDWORK PROCESS Survey data for the F&B and Tourism sectors was collected between July and October 2018. Responses were through face-to-face interviews with Singapore residents at their homes and departing tourists at Changi Airport. The Q3 fieldwork garnered 3,060 interviews with locals and 3,840 interviews with departing tourists at the airport. Altogether, there were 6,900 unique responses covering 352 distinct entities in the Food & Beverage and Tourism sectors; 57 entities have published scores. *Statistical significance for the CSISG study is measured at a confidence interval of 90%.
contact us

For more details on the CSISG, the ISE Corporate Membership programme, and customised research,
please reach us at

Institute of Service Excellence
Singapore Management University
81 Victoria Street
Administration Building
Singapore 188065
Tel: +65 6828 0111
Fax: +65 6828 0690
Email: ise@smu.edu.sg

ise.smu.edu.sg
You can also read