Study on Customer Satisfaction, Procurement and Utilization Pattern of Rice from Fair Price Shops in Kollam Region, Kerala - IJRAR
←
→
Page content transcription
If your browser does not render page correctly, please read the page content below
[VOLUME 6 I ISSUE 2 I APRIL – JUNE 2019]                                       e ISSN 2348 –1269, Print ISSN 2349-5138
http://ijrar.com/                                                                          Cosmos Impact Factor 4.236

Study on Customer Satisfaction, Procurement and Utilization Pattern of
          Rice from Fair Price Shops in Kollam Region, Kerala
          1Anandhu T        S, 1Aravind M R, 1Arjun M Kumar, 1Chandhu D Kumar, 2Sony I S
                    1VIII Semester B.Tech Food Technology Students, 2Assistant Professor
                                      1Department of Food Technology
                         1TKM Institute of Technology, Karuvelil, Kollam, Kerala, India

      Received: February 17, 2019                                                    Accepted: March 22, 2019
       ABSTRACT: The Public Distribution System was brought about by the Central Government to address the
       rapidly climbing number of people suffering from the unavailability of food despite the massive amount of
       crops and other food products that are produced annually in India. But despite its successful
       implementation, it has been observed, general customer dissatisfaction towards the centers and a tendency
       to prefer alternative retail stores despite the products being offered at low prices. This study aims to find
       the causes that result in these observed complaints among the customers by studying the procurement,
       quality and utilization pattern of two varieties of rice obtained from fair price shops in Kollam region,
       Kerala.

       Key Words: Public Distribution System, Customer dissatisfaction, Fair Price Shops.

1. INTRODUCTION
India has one of the largest Public Distribution System (PDS) in the world. There are about 5.27 lakhs Fair
price shops (FPSs) working across the country (https://dfpd.gov.in/index.htm). The systems intend to
impart food security to the population that is deprived of food (Dreze et al. 2018). Later the priority has
been shifted from providing food security to the whole population to targeting the priority household to
provide them a means to purchase food grains at a subsidized rate. The households who are eligible will
receive subsidized food grains, i.e. rice, wheat, coarse grains under PDS. The price issued by the central are
comparatively very low from market price and are different for different type of card holders.
The functioning of PDS is such that both central and state governments share responsibilities to provide
food grains (Bhagyasree 2018). The central government procures food grains directly from farmers at a
minimum support price (MSP) and the sells it to the state government at the central issue prices. This is
known as centralized procurement. Usually, the minimum support price is higher than the market price.
Another type of procurement is such that ten states or union territories procure food grains for the central
pool at minimum support price on behalf of the FCI. This type of procurement is known as decentralized
procurement. It was introduced the expenditure of transport of grains from central godown to other states.
If surplus stock occurs, it must be handed over to FCI, and in case of shortage, FCI provides with sufficient
amount of grains. PDS also has the responsibility of transporting grains to the state godowns in each state.
Then it is the responsibility of the state government to transport the grains from the godowns to the fair
price shops. Also, there are many states where the price of the grains is further subsidized before providing
it to the consumers. The Food Corporation of India is a nodal agency that has the responsibility to tr ansport
food grains to the state godowns.
When it comes to the storage of food grains, the grains procured from different areas are stored under
different godowns under the control of FCI. Other than the grains required for the immediate distribution of
the public distribution system, the extra amount of grains are stored in the case of emergency use (Grover
2017). According to the storage rules of the food corporation of India, food grains are stored in covered
godowns and silos. As the godowns of FCI are not sufficient for storing the procured amount of grains, FCI
hires godowns from central and state warehousing corporations, government agencies and other private
parties (http://fci.gov.in/).
The networks of ration shops within a state are under the control of state-level ministries of food and civil
supplies. They also have the authority to handout licenses to the private traders who operate the shops. The
consumers are availed to purchase food grains only if they own a ration card (Kaul 2018). State
governments also issue ration cards to the natives and determine the quantities which consumers are to be
allotted. Recently Aadhaar cards are also being used in public distribution system for simplifying several
processes. The inclusion of Aadhaar cards in the system helps to identify and authenticate beneficiaries
Research Paper                              IJRAR- International Journal of Research and Analytical Reviews 987
[ VOLUME 6 I ISSUE 2 I APRIL– JUNE 2019] E ISSN 2348 –1269, PRINT ISSN 2349-5138
entitled to receive subsidies under the public distribution system. This also helps to prevent some of the
mal-practices that are likely to occur in fair price shops (https://epos.kerala.gov.in/).
According to FAO estimates in ‘The State of Food Security and Nutrition in the World, 2018’ report 195.9
million people go hungry every day in India. 21 % of children below 5 are under weight, 38.4% of children
under five years of age are stunted. India was ranked 100 out of 119 countries of the Global Huger Index
2017. A country on the path of development cannot afford to be a country where people lack food. Also, this
shows that there is a need to review the current Public Distribution System (Velmurugan et al. 2017).
There are total 8528512 cards in the state of Kerala and 35384875 peoples are the total beneficiaries in the
Kerala state. Within this, there are 731756 cards and 2842322 beneficiaries in the Kollam district, Kerala
(https://civilsupplieskerala.gov.in/index.php/cards).
2. RESEARCH METHODOLOGY
2.1 SURVEY
2.1.1 Research Design
Primary data has been collected from selected Fair Price Shop (FPS) in different regions of Kollam
district, Kerala. The present study is confined to consumers who reside in various regions in Kollam
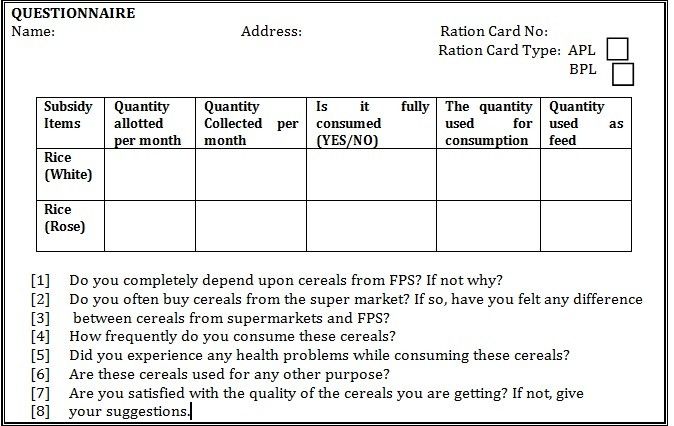
district. A quantitative approach is applied in the study. Consumer’s level of satisfaction towards
commodity collected from FPS has been identified through an interview pre-schedule (questionnaire)
which is shown in Figure 1.
2.1.2 Selection of area
To conduct the present study, four regions in Kollam district of Kerala state was selected. Random
sampling technique has been employed for their selection. Out of the selected regions survey has been
carried out among 100 cardholders.
2.1.3 Collection of Data
Among the 100 card holders the following data was collected:
Card distribution pattern
Dependency pattern
Procurement pattern
Utilization pattern
Consumer’s suggestion
2.1.4 Procedure
To conduct the study, primary data was collected from the FPS of different regions in Kollam based on
pre-structured interview schedule, and the results were tabulated. The format of the pre-structured
interview schedule was as shown in Figure 1 below. The questionnaire also helped in collecting the
details regarding the quantity of the rice allotted, collected and consumed by the card holders. It also
helps on enquiring about the amount of rice used as feed. The collected data were analysed to find out
the consumer’s satisfaction level.
Figure. 1 The format of pre-structured interview schedule for collecting data from Fair Price Shops
988 IJRAR- International Journal of Research and Analytical Reviews Research Paper[VOLUME 6 I ISSUE 2 I APRIL – JUNE 2019] e ISSN 2348 –1269, Print ISSN 2349-5138
http://ijrar.com/ Cosmos Impact Factor 4.236
3. SURVEY REPORT AND INTERPRETATION
3.1 Key Findings
Based on the survey results, among the 100 card holders are that 63% of the people partially and
completely depends on the FPS. Even though a higher percentage of the people depend on the FPS most of
them are not at all satisfied with the quality of rice provided. The rice from the FPS often has a foul odor and
undesirable taste. Also, the cooking time of the rice is not stable and, rice after cooking doesn’t often get
desired consistency. A minority of the card holders have an opinion that the rice allotted for them are not
supplied on the right time and, this may be the reason for relinquishing of the commodities from the FPS.
Majority of the card holders have an opinion that the amount of broken rice is more and this is considered
to be the insufficient amount of rice after cooking.
The procurement pattern of rice by the card holders shows that 78% of the card holders procure rice from
the FPS whereas the rest 22% relinquishes the rice provided through the FPS because of the low quality and
uneven supply of the rice. The survey also helped in finding out the utilization pattern of the rice from the
FPS. The card holders commonly use rice as a whole, processed into rice flour and also used as animal or
poultry feed.
3.2 Card Distribution Pattern
Different types of card holders were involved in the survey. The card distribution pattern based on the
economic status participated in the survey was depicted in Table 1.
Table 1: Card distribution Pattern
Card type Number of card holders
Non-priority 32
Subsidy 37
Priority 24
AAY 7
There are four types of cards viz., Non-priority, Subsidy, Priority, and AAY (Antyodaya Anna Yojana) cards.
The non-priority card is a white color card given to the people who are economically better and comes
above the poverty line whereas Subsidy card is a blue color card given to the people above the poverty line,
but they are not much economically better. Priority card is a pink color card given to the people below
poverty line such as poor people comes under this category. Antyodaya Anna Yojana (AAY) card is a yellow
color card given to the poorest of the poor people. Among the 100 card holders come under the purview of
the study, 32 come under the ‘Non-priority’ type whereas 37 card holders come under the ‘Subsidy’ card
types. Overall 69 card holders come above the poverty line, and the remaining 31 card holders come below
the poverty line. Among this 31 card holder’s 24 holds the priority cards, and seven card holders were the
poorest of the poor and hold AAY cards.
3.3 Dependency pattern
The dependency pattern shows how the card holders depend on the ricefrom the FPS; it depicts whether
they are completely dependent or partially dependent or nondependent and the dependency pattern was
shown in Table 2.
Table 2: Dependency pattern
No. of Card holders
Dependency Pattern
APL BPL Total
Fully dependent 0 14 14
Partially dependent 33 16 49
Non dependent 36 1 37
Among the 100 card holders 63 of them completely or partially depends on FPS, and the rest 37 does not
depend on Fair price shops. Within this 37 card holders, 36 are of the above poverty line (APL), and the
remaining 1 comes under below poverty line (BPL). Also, some of the card holders with in these
independent category depends on the fair price shop commodities but the procured commodities may not
be used for consumption but may be used as animal or poultry feed. From the survey, we understood that
14 card holders completely depend on the Fair price shops that belong to the BPL category. Moreover, 33
card holders (APL category) and 16 card holders (BPL category) partially depend on the Fair price shops.
Research Paper IJRAR- International Journal of Research and Analytical Reviews 989[ VOLUME 6 I ISSUE 2 I APRIL– JUNE 2019] E ISSN 2348 –1269, PRINT ISSN 2349-5138
3.4 Procurement Pattern
The procurement pattern gives details about the number of card holders who procures or relinquishes rice
from the FPS. The following data shown in Table 3 provides the details of the same.
Table 3: Procurement pattern
Procurement pattern No. of Card holders
Procures 78
Relinquishes 22
Table 3 shows the procurement pattern of the card holders. It states that 78 card holders procure the
commodities from the Fair price shops and the rest 22 card holders relinquish their ration. These 22 card
holders do not even collect any commodities for consumption or other uses like animal or poultry feed i.e.;
they do not utilize the service. According to the information provided by the Civil Supplies Department,
Government of Kerala, only 2% of the card holders utilize the services provided by the public distribution
system during the year 2002-2005. Now it has been increased to 55-60%. It shows that more card holders
procure commodities from FPS than in 2002-2005.
3.5 Utilization Pattern of Rice
The survey conducted helped to find out the utilization pattern of the rice (Table 4) that is collected from
the FPS. Customers utilize rice in different ways mainly as rice as a whole, flour and as feed.
Table 4: Utilization pattern of Rice
Utilization Percentage
Rice 58.9
Flour 61.8
Feed 47.43
Rice & Flour 25.5
Rice & Feed 14.5
Flour & Feed 23.5
Rice, Flour & Feed 3.5
It was clear from the Table 4 that 58.9% use the rice directly for cooking whereas 61.8% of people
processed this rice into flour for their convenience. It was also found that, 25.5% utilize the rice from FPS as
rice as a whole and as rice flour and 47.3% of the card holders use this rice as animal or poultry feed. There
are also people who use rice as a whole, and as feed; there are 14.5% who belongs to this category. It was
also found that 23.5% of card holders do not utilize the rice as a whole but utilized as flour and feed.
Moreover, 3.5% of the card holders utilize the rice from FPS as rice as whole, flour and feed.
4. CONCLUSION
The prime aim of this study was to identify the customer’s satisfaction, procurement and utilization pattern
of commodities from the Fair Price Shop. The utilization of commodities by the consumers depends on
satisfaction which they obtained from Fair Price Shop. The result of this study reveals that the customers
are satisfied when they obtain commodity with sufficient quantity and quality for their use. According to
their suggestion, the good quality commodity is rose rice which is not given to them in sufficient quantity.
Among the consumers, there are fully dependent, partially dependent and non-dependent categories. A fully
dependent consumer will be satisfied if they get sufficient good quality rice. Most of the consumers suggest
that the white rice obtained from Fair Price Shop has an unacceptable odor and consistency. The consumer’s
procurement of commodity can be increased through the accurate supply of quality and quantity they
needed.
6. REFERENCES
[1] Bhagyasree, P. G. (2018). A Study on the Performance of Public Distribution System With Reference To
Colachel Municipality.IOSR Journal of Economics and Finance, 8(3), 61-68.
[2] Dreze, J., Gupta, P., Khera, R., & Pimenta, I. (2018). Casting the Net: India's Public Distribution System after the
Food Security Act.
[3] Grover, A. K. (2017). Analysis of six monthly distribution system for food grains in the public distribution
system of Punjab, India: A beneficiary's perspective.
[4] Kaul, T. (2018). Household responses to food subsidies: evidence from India. Economic Development and
Cultural Change, 67(1), 95-129.
990 IJRAR- International Journal of Research and Analytical Reviews Research Paper[VOLUME 6 I ISSUE 2 I APRIL – JUNE 2019] e ISSN 2348 –1269, Print ISSN 2349-5138
http://ijrar.com/ Cosmos Impact Factor 4.236
[5] Velmurugan, R., & Lavanya, D. (2017). Problems in Public Distribution System at Coimbatore District.
International Journal of Pure and Applied Mathematics, 114(12), 277-287.
Websites
1. https://civilsupplieskerala.gov.in/
2. https://dfpd.gov.in/index.htm
3. https://epos.kerala.gov.in/
4. http://fci.gov.in/
Research Paper IJRAR- International Journal of Research and Analytical Reviews 991You can also read