PRELIMINARY SEISMIC RISK SCENARIOS FOR MALAGA, SPAIN
←
→
Page content transcription
If your browser does not render page correctly, please read the page content below
Proceedings of the 8th U.S. National Conference on Earthquake Engineering
                                                                  April 18-22, 2006, San Francisco, California, USA
                                                                                                   Paper No. 1638

           PRELIMINARY SEISMIC RISK SCENARIOS FOR MALAGA, SPAIN

    J. Irizarry1, A. Macau1, T. Goded2, D. Clavero3, A. Pazos4, S. Figueras1, R. Garcia5 and ERSE
                                           Working Group

                                                 ABSTRACT

         A preliminary seismic risk assessment is presented for the city of Malaga, one of
         the most important and populated cities of the southern coast of Spain. This
         seismic scenario is based on the seismic hazard assigned to the city by the
         Spanish seismic code in terms of intensity for a return period of 500 years. Soil
         effects in terms of intensity are evaluated using Arias Intensity computed from
         the ground motion obtained by a 1-D numerical method applied in different soil
         conditions. Damage scenarios are obtained using damage probability matrices
         developed for a similar region. Results indicate that a scenario with an intensity
         VII-VIII at rock sites can cause over 20,000 wounded persons, and more than
         90,000 homeless.

                                                 Introduction

        The city of Malaga, located on the south coast of Spain as shown in Fig. 1, is affected by
one of the higher seismic hazard levels expected within the country. Being the capital of the
Malaga province within the Andalusia region, this city is an important tourism, cultural and
economical center that has experienced a population explosion in the last decades. In the past
the city has been affected by strong earthquakes causing severe damages. This seismic hazard in
combination to the actual population concentration and the seismic vulnerability of its building
stock provide the city of Malaga with a potentially high risk of suffering severe damages is
affected by strong earthquakes like those of the past.

       A preliminary study of seismic microzonation is being conducted including microseismic
measurements at selected sites, in order to obtain the fundamental frequency of soils. A
geotechnical classification of soils was performed to evaluate transfer functions using numerical
methods for characterizing the soil response that will be considered in the vulnerability analysis.

1
  Researcher, Geological Survey, Institut Cartogràfic de Catalunya, Parc de Montjuïc, 08038-Barcelona, Spain.
2
  Researcher, Dept. of Geophysics , Universidad Complutense de Madrid, Spain
3
  Researcher, LIDYCCE, C/ Severo Ochoa 6, 29590-Campanillas, Málaga, Spain
4
  Researcher, Real Instituto y Observatorio de la Armada, Cadiz, Spain
5
  Adviser, LIDYCCE, C/ Severo Ochoa 6, 29590-Campanillas, Málaga, Spain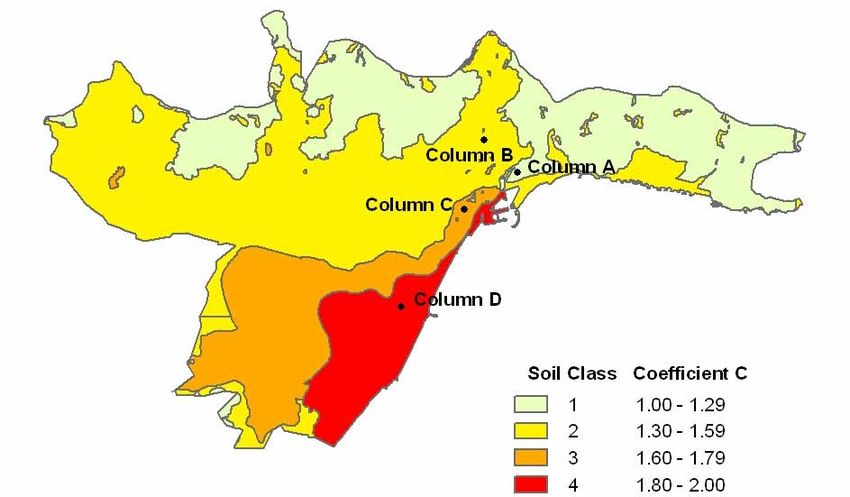
Figure 1.   Location of the municipality of Malaga.

         This paper presents the preliminary results of one of the two vulnerability assessment
approaches that are being applied to the city of Malaga. The results presented here correspond to
the first method based on the classification of the building stock of Malaga’s districts according
to the EMS-98 vulnerability classes and estimates damages using the damage probability
matrices in terms of intensity. The second approach classifies the vulnerability and estimate
damages by implementing the vulnerability index method using the structural typologies
distribution within the city.

                              Seismic Hazard Affecting Malaga

       The seismicity of the Iberian Peninsula (Iberia) is characterized by the occurrence of
earthquakes of moderate magnitude, generally lower than 5.0. The majority of the earthquakes
have a shallow depth (h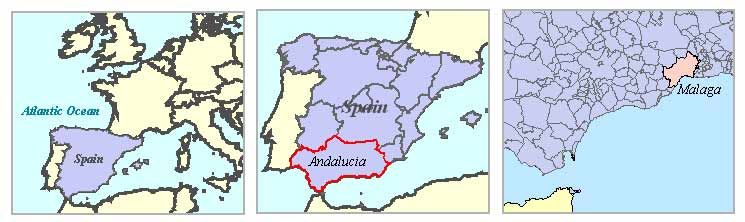
Figure 2. The left map shows the Iberian Peninsula seismicity for the 1980-2004 period and
          magnitudes greater or equal to 3.0. The right map shows the seismicity affecting the
          city of Malaga for the same period and all magnitudes. Light gray indicates
          superficial earthquakes (h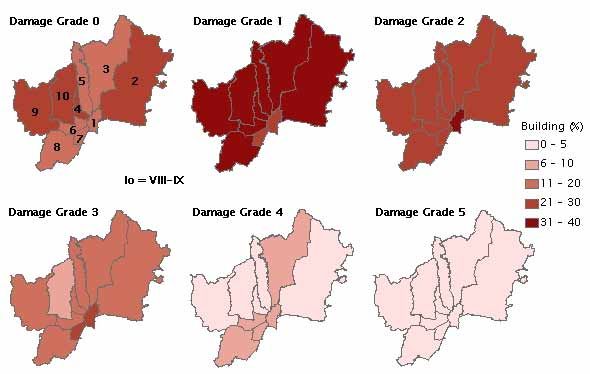
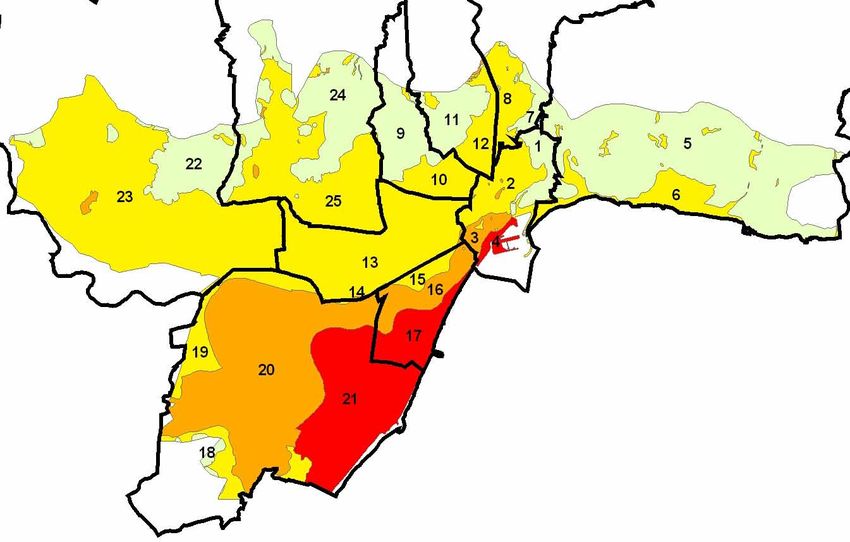
Figure 3:                      Seismic microzonation map for the city of Malaga; four soil classes are defined for
                              the different values of the C coefficient. The position of soil columns is also shown.

        1-D method (Shake) was used to obtain the transfer function and the ground motion for
all the defined soil classes shown on Fig. 3. A characteristic soil column was defined for each
zone from geotechnical data of Malaga provided by LIDYCCE (Laboratorio del Instituto de
Investigación, Desarrollo y Control de Calidad de Edificación). This database contains
information of about 400 drills.

       As input motion at rock one acceleration record was selected from the European Strong
Motion Database (Ambraseys et. al. 2000) whose spectral content is similar to the response
spectrum defined by NCSE-02. This acceleration record is scaled to a PGA of 0.11g that
corresponds to the PGA value proposed in the NCSE-02 for Malaga. The two computed transfer
functions with the fundamental frequencies previously obtained from Nakamura’s method are
shown in the Fig. 4 for column C (soil class 3) and column D (soil class 4).

                                 Transfer function Column C                                  Transfer function Column D

                      4                                                              7
                                                                                     6
                      3                                                              5
                                                                     Amplification
      Amplification

                                                                                     4
                      2
                                                                                     3
                                                                                     2
                      1
                                                                                     1
                      0                                                              0
                          0           5        10          15   20                       0       5         10         15   20
                                          Frequency (Hz)                                             Frequency (Hz)

Figure 4:                 Transfer functions for columns C (soil class 3) and D (soil class 4) together with
                          fundamental frequencies (big dot) obtained by Nakamura’s method in sites located
                          near the drillings.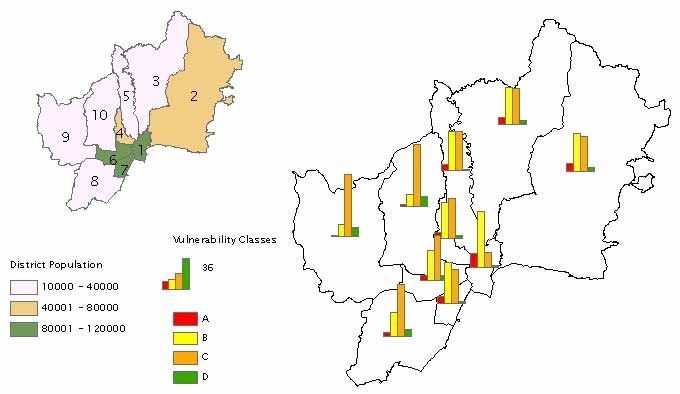
The PGA and Arias Intensity (AI) values of the different synthetic acceleration records
obtained for the soil columns have been calculated. Their values are shown in Table 1. Soil
classes 2 and 3, characterized by soft thin soils, show a similar amplification for PGA an AI. It
was observed that soil class 4 has a higher amplification for AI than for PGA. This observation
can be due to the presence of a deep basement (fundamental frequency of 0.4Hz) that produces a
longer acceleration records and in consequence a higher AI. So, Arias Intensity seems to be more
representative of the whole soil response than PGA.

        Arias Intensity and macroseismic intensity can be related from empirical observations, as
for example the relation proposed by Cabañas et al. (1997) for the Mediterranean area. In this
way, the intensity increment (∆Ii) representative of each soil class can be obtained, using Eq. 1,
from the soil to rock ratio of the Arias Intensity (AIi/AIR). The macroseismic intensity increment
obtained for each soil class is shown in Table 1. These values will be used to increase the
intensity value proposed for a reference soil for the city of Malaga.

       ∆Ii = 0.66*Ln(AIi/AIR)                                                                 (1)

Table 1:   PGA and AI values computed for each soil class together with the adopted values of
           macroseismic intensity increment.

               Soil Class         PGA(g)           AI (cm/s)          ∆I MSK
                    1              0.11              19.4               +0.0
                    2              0.14              36.7               +0.5
                    3              0.14              38.9               +0.5
                    4              0.14              63.7               +1.0

                                Seismic Vulnerability of Malaga

       Malaga’s vulnerability assessment is based on the classification of the building stock of
the municipality according to the EMS-98 (Grünthal 1998) vulnerability classes using the
methodology developed by Chávez (1998) and exposed by Roca et al. (2005). Fig. 5 shows the
vulnerability classes assigned by the EMS-98 to common structures of masonry, reinforced
concrete, steel and wood. Chávez (1998) established the distribution of the vulnerability classes
according to the age, height and location of the building stock. To obtain the number of
buildings in each vulnerability class, the age and height distribution must be known for both the
urban and rural areas of the municipality. The vulnerability classes distribution by Chávez
(1998), also shown in Fig. 5, was defined based on the expert judgment of architects who knew
very well the construction history of the Catalonian region in Spain.

        The building height and year of construction data for each district of Malaga was
obtained from the National Institute of Statistics of Spain. The building distribution of Malaga
according to height and year of construction periods proposed by Chavez (1998) is shown in
Fig.6. As can be seen the majority of buildings have less than 5 levels; higher levels correspond
to recent construction. Then, the vulnerability classes’ distribution percentages are applied to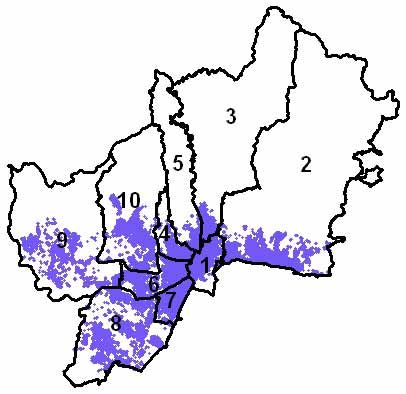
obtain the vulnerability class distribution shown in Fig.6. Vulnerability classes A and D have the
lower percentages, while vulnerability classes B and C present almost equal percentages.
                                                                                               Vulnerability Classes Percentages by Chavez (1998)
                                                                         Until 1950                                 1951-1970                 After 1970

                                                            Levels    Urban                          Rural       Center        Dissem   Center       Dissem

                                                                      20A                            30A          5A            15A                    5A
                                                                      80B                            70B          50B           70B                   20B
                                                             5
                                                                                                                  15C           5D          60C       40C
                                                                                                                                            5D

                        Figure 5. EMS-98 Vulnerability Classes and its distribution according to Chávez (1998).

                       100                                                                     100
                                  5
                        90                                                                     90
                        80                                                                     80
                        70                                                                     70
                                                                         Building Percentage
 Building Percentage

                        60                                                                     60
                                                                                                                                        46
                        50                                                                     50
                                                                                                                          41
                        40                                                                     40

                        30                                                                     30

                        20                                                                     20
                                                                                                             8                                         5
                        10                                                                     10

                        0                                                                       0
                             Before 1950   1951-1970     After 1970                                          A            B             C              D

                                           (a)                                                                                 (b)

Figure 6.                       (a) Distribution of building stock according to Malaga’s City Council and (b)
                                vulnerability class distribution for the city of Malaga according to Chavez (1998).

        Fig. 7 shows the vulnerability classes distribution and to population for each district in
the city of Malaga. Most of the districts show low percentages of vulnerability class A. The
highest vulnerability class A is shown by district 1, Malaga’s historical center. The majority of
the districts have important percentages of vulnerability classes B and C, except districts 9 and
10 with a low percentage of vulnerability class B and district 1 with low presence of
vulnerability class C. Districts 8, 9 and 10 exhibit the larger percentages of buildings with
vulnerability class D. The districts with higher percentages of the most vulnerable classes A
and B, are those having high population.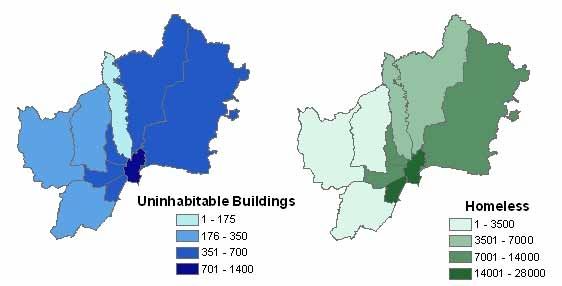
Figure 7.     Vulnerability classes distribution and population for each district of Malaga city.

                                   Seismic Scenarios for Malaga

        Almost all the population of Malaga is concentrated near the coast as can be seen in part
(a) of Fig. 8, so the population obtained for each district from the Malaga’s City Council was
concentrated over the urbanized area of the city. When the districts are superimposed over the
soil zonation, a total of 25 subdivisions are created because most of the districts are affected by
various soil zones. A number of buildings and population was defined for each district
subdivision proportional to its area contribution within the district. Finally the intensity with soil
effects was defined for each district subdivision by adding the intensity increment for each
corresponding soil class to the intensity at rock of VII-VIII.

                    (a)                                              (b)

Figure 8.     (a) Populated zone map where numbers indicate districts and (b) district subdivisions
for Malaga.
Damage distributions for each of the subdivision were obtained using the damage
probability matrices, developed by Chávez (1998) for each vulnerability class, that give the ratio
of buildings with different damage grades for a set of given intensities. An example of the
damage probability matrix for vulnerability class C is shown in Table 2. With the damage
distribution for each district subdivision, a damage distribution was obtained for each district
and for the whole Malaga city.
Table 2. Damage probability matrix for vulnerability class C.
Damage Grades
Intensity
0 1 2 3 4 5
VII-VIII 0.325 0.388 0.211 0.064 0.011 0.001
VIII 0.209 0.384 0.283 0.104 0.019 0.001
VIII-IX 0.144 0.324 0.314 0.165 0.047 0.006
The damage distribution obtained for the city of Malaga, shown in part (a) of Fig. 9, is
centered over damage degrees 1 and 2 indicating that the majority of the buildings would show
slight to moderate damages. A lower but significant 7%, over 2000 buildings of the city’s
building stock, can suffer severe damages. Part (b) of Fig. 9 shows the distribution of damage
grade by district.
The district identifying numbers are only shown for damage grade 0 to clarifying the
figure. As can be seen the probability of having no damage (damage grade 0) is lower in the
center and older districts, while the probability of suffering damages grade 1 and 2 is more or
less evenly distributed among the districts. Districts 1 and 7 show the higher probability of
suffering moderate grade 3 damages, while most of the center districts have the higher
percentages of buildings having severe damages of grade 4.
40
35
32
28
30
Building Percentage
25
18
20
16
15
10
6
5
1
0
0 1 2 3 4 5
Damage Grades
(a) (b)
Figure 9. (a) Damage grade distribution for the city of Malaga and (b) distribution of the
damage grade by district.The losses estimation included the uninhabitable buildings, the number of homeless, the
mortal victims and the persons slightly and severely injured for each district. The uninhabitable
buildings and homeless persons were calculated as done by Chavez (1998) and are shown in
Fig.10. The wounded persons and mortal victims were estimated as recommended by the ATC-
13 (1985). As can be seen the higher number for all these losses estimated concentrate in the
central districts. The considered scenario is expected to cause almost 5000 uninhabitable
buildings in Malaga, that is, a 15% of the total building stock of the city, and more than 20,000
wounded persons. This building loss would leave over 90,000 persons without home.
Figure 10. Estimation of uninhabitable buildings and homeless.
Conclusions
Malaga is a highly populated city located in one the most active seismic regions of
Spain. The preliminary results obtained for the scenario based on the NCSE-02, an intensity of
VII-VIII at rock sites, show that the city is very vulnerable to suffer seismic damage especially in
its old historical center. In addition most of the population is concentrated near the coast where
the soil amplifications are more critical. The consequences of such a scenario can cause a state
of emergency for which a lot of resources will be required and a good coordination of the
emergency management will be essential.
In a preliminary soil effects study, the soil response of soft soil sites is better
characterized using the AI than the PGA. Several synthetic acceleration record have been
obtained in different soil sites, using geotechnical data and their AI computed and correlated
with the macroseismic intensity in order to obtain, for each soil class, an intensity increment
value to consider the soil effects in the seismic risk scenarios. As a result the intensities from the
seismic scenario considered varied from VII-VII at rock sites to VIII-IX for soil class 4. A more
detailed study will be conducted to characterize all the soil conditions in Malaga city using 1D
method to obtain the transfer function and the expected ground motion for a greater density of
soil columns distributed by the city.
The seismic vulnerability analysis showed that the most vulnerable districts of Malaga
city are unfortunately those having a higher population. As a consequence the seismic scenario
proposed can cause approximately 5000 uninhabitable buildings, leaving over 90,000 homeless,
and over 20,000 wounded persons. The work on the seismic risk assessment for the city willcontinue with the application of the vulnerability index method for the evaluation of the
vulnerability based on the structural typologies of the building stock. More seismic scenarios
will be considered based on historical earthquakes and the current seismicity.
References
Ambraseys, N. N., Smit, P., Berardi, R., Rinaldis, D., Cotton, F., and C. Berge-Thierry, 2000.
Dissemination of European Strong-Motion Data. CD-ROM collection. European Council,
Environment and Climate Research Programme
ATC-13, 1985. Earthquake damage evaluation data for California, ATC-13. Applied Technology
Council, Redwood City, California.
Buforn, E., Sanz de Galdeano,C., and A. Udías, 1995. Seismotectonics of the Ibero-Maghrebian region,
Tectonophysics 248, 247-261.
Cabañas, L, Benito, B. and M. Herráiz, 1997. An approach to the measurement of the potential structural
damage of earthquake ground motion. Earthquake Engineering and Structural Dynamics,26, 79-
92.
Chávez, J., 1998. Evaluación de la vulnerabilidad y el riesgo sísmico a escala regional. Aplicación a
Cataluña. PhD Thesis. University of Barcelona, Spain.
Clavero, D., 2005. Riesgos Geológicos y Geotécnicos en el Término Municipal de Málaga. LIDYCCE
Dirección General de Protección Civil, 1997. Directriz Básica de Planificación de Protección Civil ante
el Riesgo Sísmico, Imprenta Nacional del Boletín Oficial del Estado, Madrid, Spain.
Grünthal, G., 1998. European macroseismic scale 1998, Cahiers du centre Européen de Géodynamique et
Séismologie 15, Luxemburg.
Muñoz, D., and A. Udías, 1988. Evaluation of damage and source parameters of the Malaga earthquake of
9 October 1680, Seismograms and Earthquakes of the World, 208-221.
Nakamura, Y., 1989. A method for dynamic characteristics estimation of subsurface using microtremors
on the ground surface. Quarterly Report of Railway Technical Research Institute. 30-1, pp 25-33
NCSE-02, 2002. Normativa de Construcción Sismorresistente Española. Comisión Permanente de
Normas Sismorresistentes, Real Decreto 997/2002. Boletín Oficial del Estado No. 244 del 11 de
octubre de 2002, Spain.
Roca, A., X. Goula, T. Susagna, J. Chávez, M. González and E. Reinoso, 2005. A simplified method for
vulnerability assessment of dwelling buildings and estimation of damage scenarios in Catalonia
(submited to Bulletin of Earthquake Engineering).You can also read