Data.census.gov: A Brief Demonstration - Brown University ...
←
→
Page content transcription
If your browser does not render page correctly, please read the page content below
data.census.gov: A Brief Demonstration
               Frank Donnelly, GIS & Data Librarian, Brown University
                                           May 21, 2021

Introduction
This tutorial demonstrates how to use data.census.gov to access and download US census data,
highlighting a specific approach using the advanced search feature. Given the size and complexity
of census data it’s best to apply filters to narrow choices down, based on dataset, geography, and
time period. In these examples we’ll access data profiles for a city and download home value data
for all county subdivisions in a state from the American Community Survey (ACS). We’ll conclude
with summaries of the census datasets and geographies.

1     Methods for Searching data.census.gov
The Census Bureau’s primary portal for accessing its data is data.census.gov at https://data.
census.gov/cedsci/. There are two principle options for obtaining data:
    1. To get basic data for a state, county, city, town, or ZIP Code, type the name in the search box.
       You will be able to preview recent data for these places, and navigate to individual tables.
       You can even type the name of a topic, like educational attainment, to find all tables related
       to this subject. This type of search allows you to casually browse and access data.
    2. If you want to chart a straight path to access the data you need, and you want to see the
       full range of datasets, topics, and geographies, use the Advanced Search. The following two
       sections focus on using this method, which brings you more directly to the data you’re looking
       for. The overview of datasets and census geography in the final sections provide you with
       necessary context for making decisions on how to filter data.

                                                   1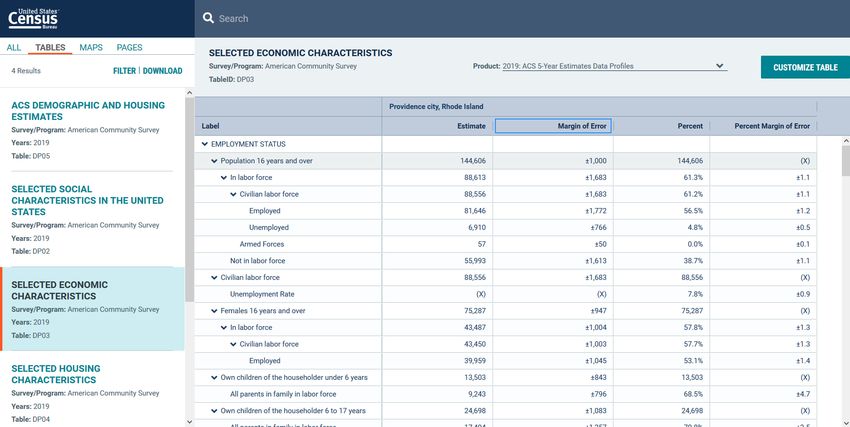
2     Downloading a Data Profile from the ACS
In this section we’ll download a data profile for Providence, Rhode Island that will give us a broad
overview of the population. We will look at the American Community Survey (ACS), as this is the
dataset that contains detailed socio-economic characteristics of the population on an on-going basis
(the ten-year census contains just basic demographic counts). Since Providence has a population
that’s greater than 65,000 people, it is included in both the 1-year and 5-year estimate series from
the ACS. We will look at the 5-year estimates as they have a lower margin of error.

    1. Go to data.census.gov at https://data.census.gov/cedsci/.

    2. Under the search box select the Advanced Search option.

    3. In the filters menu on the left, select Surveys. In the list of Surveys check ACS 5-Year
       Estimates Data Profiles.

    4. In the menu on the left select Years, and check 2019.

    5. In the menu select Geography. Choose Place. When the next menu opens, choose Rhode
       Island under Within State, then Providence city within the state. Places include legally
       incorporated cities and towns (but just cities in New England) and unincorporated settlements
       (census designated places or CDPs).

F. Donnelly                                      2                                Brown University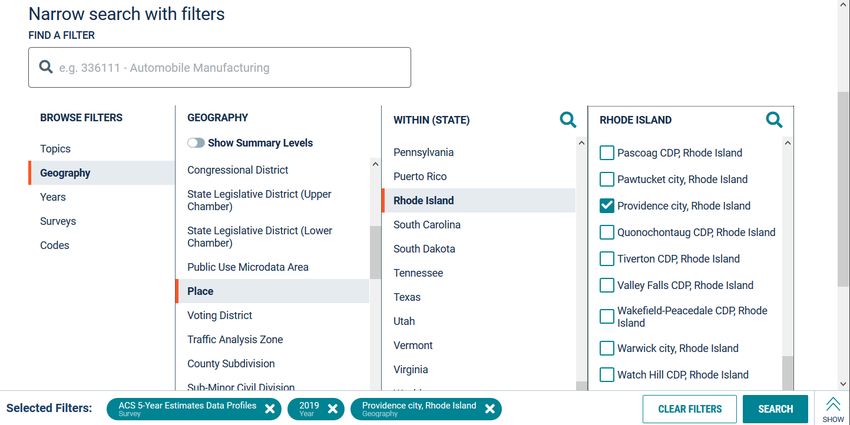
6. Hit the Search button in the lower right-hand corner.

  7. This takes you to a page that has results for tables, maps, and pages. At the top of the screen
     where it says ALL, click on the option for TABLES.

  8. This brings you to the Tables result screen. The four tables that are returned, with ID numbers
     DP02 to DP05, are data profile tables. They contain a large swath of data divided into broad
     topics: demographic, social, economic, and housing. Clicking on a table listed on the left
     provides a preview on the right. Click on the Selected Economic Characteristics table to
     preview it. You’ll see estimates with margins of error and percent totals for each value. In
     this example, we would say with 90% confidence that Providence had 88,613 people in the
     labor force between 2015 and 2019, plus or minus 1,683 people. We can tell that the labor
     force is a subset of the population 16 years and over, as it appears indented under this category.

  9. Click on the Customize Table button in the upper right-hand corner of the screen. This screen
     allows you to sort, hide, or filter data in the table.

F. Donnelly                                       3                                 Brown University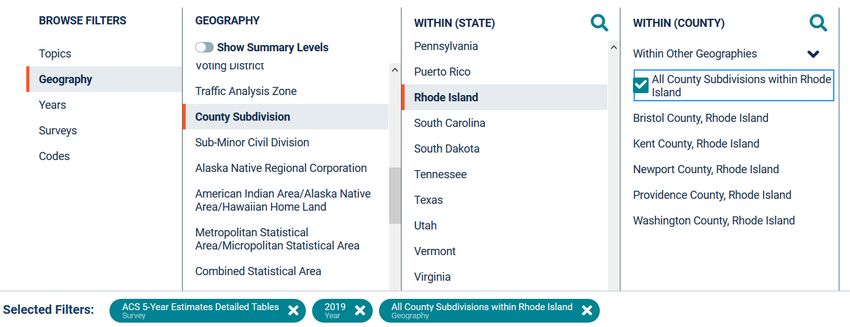
10. Clicking the Download button will save this table as a database friendly-file (with rows
     representing geography and columns representing attributes). Clicking the Excel button will
     save the table the way it appears on the screen, in a presentation format. Click the Download
     button on the toolbar above the table. Hit the Download button on this screen, and Download
     Now once the file is ready. When prompted save the file on your computer.

 11. All data that you download will be compressed in a zip file. Navigate to where the file was
     downloaded, right click, and choose the option to unzip the file (this step will vary based on
     your web browser and operating system). The csv file that contains the word ‘data’ is the
     actual data file, while the csv with the word ‘metadata’ contains a list of all the columns in
     the file. CSV files can be opened with any spreadsheet package, like Excel or Calc.

3     Downloading a Detailed Table from the ACS
The data profile tables are useful for obtaining a cross-section of different variables. If you want
something more focused, either fewer variables or a crosstab of data not published in the profiles,
you’ll want to search for detailed tables instead. You may also want to compare data for multiple
geographies. In this section we’ll download ACS data on home values for all county subdivisions
in Rhode Island.

    1. Go to https://data.census.gov/cedsci/ and select the Advanced Search option.

    2. If you just followed the previous example, select the Clear Filters button at the bottom of the
       Advanced Search screen to remove the filters from the previous search.

    3. In the filter menu, choose Surveys, then select ACS 5-Year Estimates Detailed Tables.

F. Donnelly                                       4                                Brown University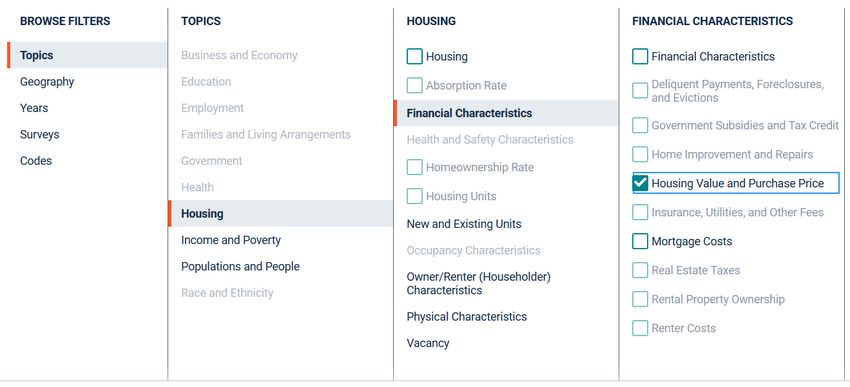
4. In the menu on the left select Years, and check 2019.

  5. In the menu select Geography. Choose County Subdivision. In the Within State menu
     choose Rhode Island as the state. In the Within County menu check the first box for All
     County Subdivisions in Rhode Island. County subdivisions are either legal administrative
     divisions (municipalities or MCDs) in states that have them (like Rhode Island), or statistical
     subdivisions created by the Census Bureau (CCDs) for states that don’t.

  6. In the filters menu select Topics. Choose Housing, then Financial Characteristics, then
     Housing Value and Purchase Price.

  7. Hit the Search button in the lower right-hand corner.

  8. This takes you to a page that has results for tables, maps, and pages. At the top of the screen
     where it says ALL, click on the option for TABLES.

F. Donnelly                                     5                                Brown University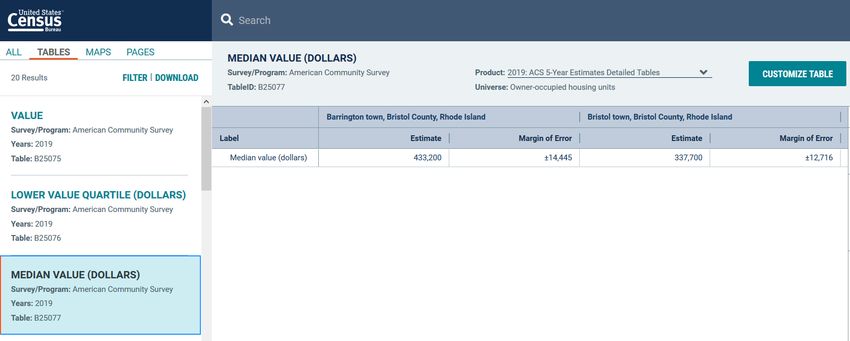
9. The Table results window includes twenty tables that are associated with housing value.
       Select a table in the list on the left to view it on the right. Each of the detailed tables
       begins with a letter ‘B’ for base table, which means it’s a detailed table focused on a narrow
       characteristic. Tables that begin with a ‘C’ are consolidated tables with fewer categories. Data
       is summarized in different ways; the Value table estimates the number of occupied housing
       units (the "universe" printed above the table) in different value brackets, while Median Value
       provides the median or middle dollar value of all owner-occupied homes.

 10. Select the Median Value Table B25077 in the results. Hit the Customize Table button. On
     the Customize screen hit the Download button and download and save the table.
 11. Unzip the download file, then open the csv file that contains the word ‘data’ in Excel or Calc.
     You’ll notice that each row represents a piece of geography and each column is an attribute,
     which is the opposite of the way it was displayed on the website.

4     Other Tips
    1. In the ACS, Subject tables are an alternative that sit in-between the profile and detailed tables.
       They contain a wider array of variables in one table relative to the detailed tables, but they are
       more focused than the profile tables. Access them via the Surveys menu, their ID numbers
       begin with the letter ‘S’.
    2. 1-year ACS estimates are only available for geographies that have 65,000 people or more. If
       you need data for small areas (tracts, ZCTAs) or need complete coverage for a geography that
       contains a mix of places above and below 65k (counties, places), use the 5-year ACS. 5-year
       ACS estimates also have lower margins of error compared to the 1-year ACS.

F. Donnelly                                         6                                 Brown University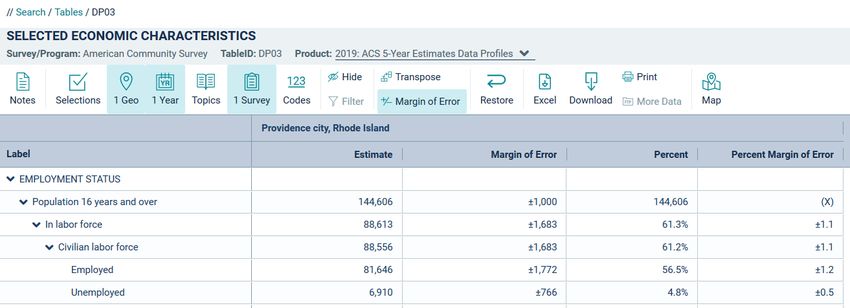
3. The decennial census (2020, 2010) contains fewer variables but is an actual count of the
population. Under Surveys the primary file is DEC Summary File 1. The table designation
system differs from the ACS; the letter P is for population counts, H is for housing counts,
and QT are quick tables similar to ACS Subject tables. There is one data profile table, DP-1.
4. If you know the ID number for the table you are looking for, you can enter it into the initial
search box and then filter by year, geography, and topic in the table view to narrow down
the results. Lists of tables are available in the technical documentation for both the ACS and
decennial census on the Census Bureau’s website.
5 Dataset Summary
Decennial Census
The decennial census is a 100% count of the population taken every ten years. The data represents
a snapshot of the nation at a fixed point in time. Variables are limited to basic demographic
and housing characteristics: race, sex, age, households, family relations, housing units, housing
occupancy, and tenure (owner versus renter occupied). Decennial census data is available for
practically all geographic areas. The most commonly used series is DEC Summary File 1. DEC
Redistricting Data (PL 94-171) contains few variables but is the first series to be released.
American Community Survey (ACS)
The ACS is a sample survey of the population that’s compiled every year. Since it’s a survey
(based on rolling monthly samples) and not a count, the values represent estimates with a 90%
confidence interval and margins of error for 1-year and 5-year periods. The number of variables is
more extensive than the decennial census; in addition to basic demographic characteristics the ACS
also includes socio-economic data like citizenship, educational attainment, income, occupation,
home value, and much more. Geographically the data is more limited; geographic areas with 65k
residents or more are published annually, and areas with less than 65k residents down to census
block groups are published as 5-year averages. New data is published near the end of each year.
Population Estimates
Population estimates are a third census dataset for population and housing. Annual estimates are
calculated using the last decennial census as a baseline and factor in births, deaths, and migration at
the county level from year to year. Variables are limited to age, sex, race, and housing units and are
only published for states, counties, metropolitan areas, and incorporated places. These estimates
are treated like counts, since they are generated from calculations and not from a sample survey.
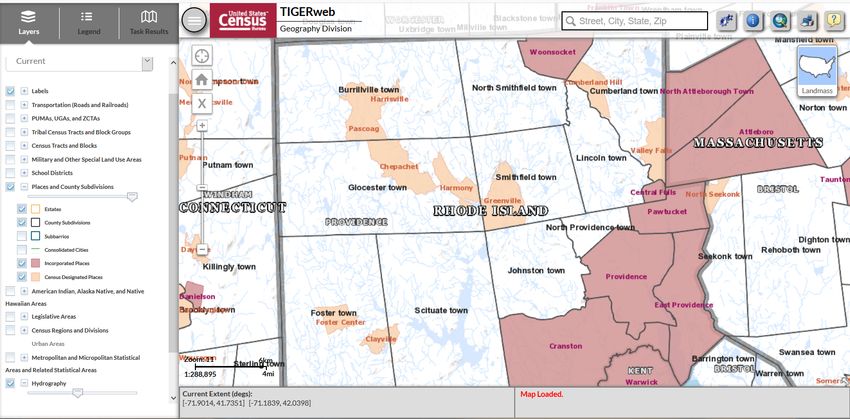
Geography in Brief
To view census geography for an area, visit TIGERweb at https://tigerweb.geo.census.gov/
tigerweb/. Choose the type of geography you want to see, check some reference layers to turn
them on, and zoom into an area or do a search for an address.
F. Donnelly 7 Brown University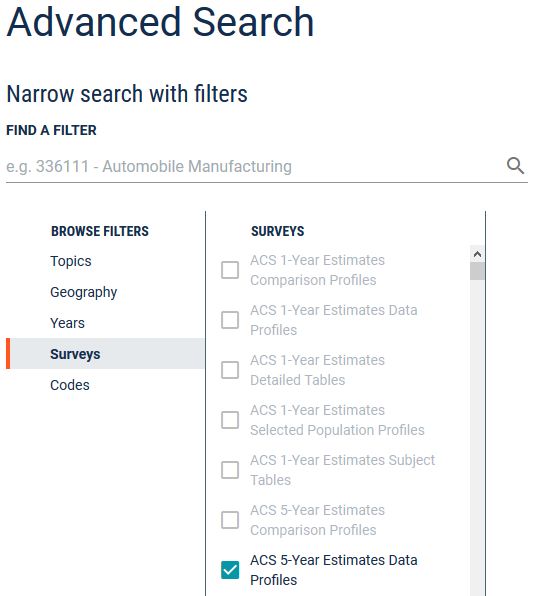
Census Tract : a statistical area designed to have an optimal size of 4,000 residents, with a general
     range of 1,200 to 8,000. Tracts never cross county boundaries. Available in the decennial
     census and 5-year ACS.

County : the legal and administrative subdivisions of states; there are over 3,000 counties in the
    US. Available in the decennial census and the ACS (partial 1-year, fully 5-year).

County Subdivision : legal subdivisions of counties (municipal civil divisions or MCDs) in states
    that have them, and areas created by the Census Bureau (Census County Divisions or CCDs)
    in states that don’t. Available in the decennial census and 5-year ACS.

Metropolitan Area : a concentrated, urban population center surrounded by adjacent areas that
     have a high degree of social and economic interaction with that center, created by aggregating
     counties. Available in the decennial census and the ACS.

Place : a concentrated settlement of people. Places include legally incorporated cities and towns,
     as well as unincorporated statistical areas delineated by the Census Bureau (CDPs). Available
     in the decennial census and the ACS (partial 1-year, fully 5-year).

PUMA : Public Use Microdata Area - a statistical area designed to have an optimal size of
   100k residents, created by aggregating census tracts. PUMAs never cross state boundaries.
   Available in the ACS.

ZCTA : ZIP Code Tabulation Area - the Census Bureau’s approximation of USPS ZIP Code
    delivery areas, created by aggregating census blocks. ZCTAs may cross any boundary,
    including state boundaries. Available in the decennial census and 5-year ACS. (Population
    data is not published for 5-digit ZIP Codes; this option appears in data.census.gov’s geography
    filters for economic datasets only).

F. Donnelly                                      8                                Brown University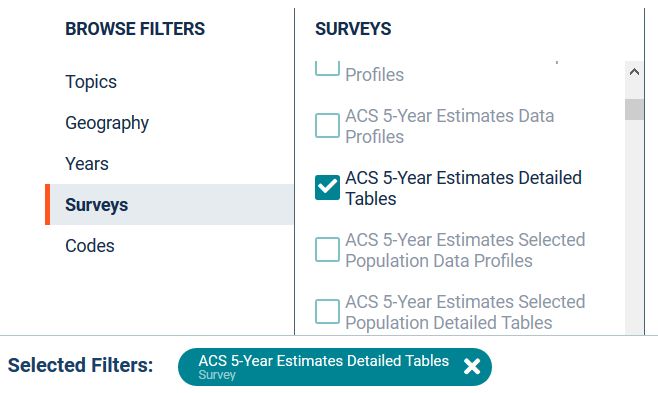
You can also read