2021 Weekly Housing Market Monitor April 12-15 National Association of REALTORS Research Group - National Association ...
←
→
Page content transcription
If your browser does not render page correctly, please read the page content below
2021
Weekly Housing Market
Monitor
April 12-15
National Association of REALTORS®
Research Group
Weekly Housing Market Monitor
 4-Week Contract Signings Up 6% from Prior Period*
During the past four weeks ending April 11, new pending listings or contracts
signed (pending sales) rose 58% from one year ago. New pending listings are
outpacing the 26% increase in new listings that came into the market in the
past four weeks.

The high year-over-year growths are arising from the low level of transactions
during March through June last year when the economy was in a lockdown
under stay-in-place orders to control the COVID-19 pandemic.

Compared to the prior 4-week period, new contract signings (pending sales)
rose 6.4% while new listings were up 10.6%.

* Based on preliminary data from a sample of about 200 MLS.
Weekly Housing Market Monitor
 Active Listings Decrease by 43% from One Year Ago
      While Pending Listings Increase by 41%*
There were nearly 9 new contracts signed for every 10 new listings that came
into the market during the past four weeks ending April 11.

During the past four weeks ending April 11, properties were typically on the
market for fewer days at 22 days compared to one year ago (35 days) and in
the prior 4-week period (23 days).

* Based on preliminary data from a sample of about 200 MLS.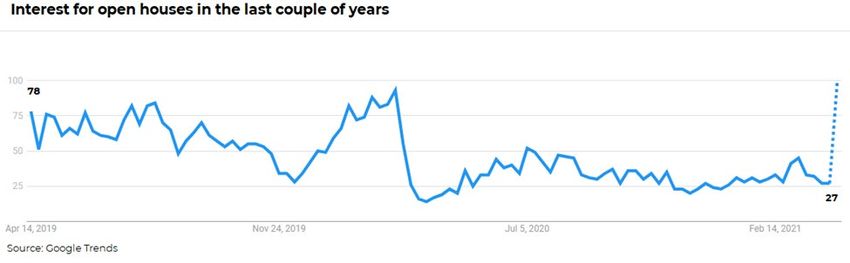
Weekly Housing Market Monitor
    Nearly 10 New Contracts Signed for Every 10 New
            Listings During Past Four Weeks*
During the past four weeks ending April 4, properties were typically on the
market for fewer days at 23 days compared to one year ago (37 days) and in
the prior 4-week period (28 days).

There were nearly 10 new contracts signed for every 10 new listings that came
into the market during the past four weeks ending April 4.

* Based on preliminary data from a sample of about 200 MLS.
Weekly Housing Market Monitor
Median Existing-Home Sales Price Increase at Annual
Pace of 13% in the Past Four Weeks
The median existing-home sales price in the past four weeks ending April 11
rose 13% from one year ago.
The sale to list price ratio increased to 98.2% (97.6% from the prior period), an
indicator that demand is still strong this spring season.Weekly Housing Market Monitor
30-Year Fixed Mortgage Rate Falls to 3.13%*
The 30-year year fixed mortgage rate for the week ending April 9 fell to 3.13%
as the benchmark 10-year Treasury note also fell to 1.68%.
Rising home prices are mortgage rates are cutting into affordability. As of
the week of April 9, NAR estimates the typical estimated monthly mortgage
payment on a typical existing home financed with a 10% down payment and
30-year mortgage at $1,290, up from $1,190 in April 2020 (+ $100). The
monthly mortgage is higher than the median rent of $1,199.
Chief Economist Lawrence Yun now expects the 30-year fixed mortgage rate
to average 3.5% in 2021.
*The mortgage payment varies by type of home and by borrower.Weekly Housing Market Monitor Fraction of Loans in Forbearance Declines to 4.66% The fraction of loans in forbearance decreased to 4.66% during the week of April 4 (4.90% in the prior week). The MBA estimates that 2.3 million homeowners are in forbearance plans (2.5 million in the prior week). Most distressed borrowers are working out payment options with lenders to keep their homes. Of the homeowners who exited forbearance during June 1, 2020 through April 4, 2021, 7.5% exited forbearance by refinancing their home or selling their home. With home prices rising, less than 2% ending in a short sale or deed-in-lieu (and other reasons). Both the moratorium on mortgage forbearance on federally backed mortgages and the CDC eviction moratorium have been extending through June 30, 2021, both of which were scheduled to end on March 31, 2021.
Weekly Housing Market Monitor
Inflation Rises to 2.6% in March 2020 with Potential to
     Accelerate in Second Half as Travel Resumes
Inflation accelerated to an annual pace of 2.6% in March 2021 after holding at
below 2% since March 2020.

Inflation picked up due to the surge in energy prices that rose 13.2% . As the
global economy continues to recovery, crude oil prices have recovered. The
West Texas Intermediate crude oil prices are now at $62.3/barrel, up from
$29.5/barrel in March last year at the onset of the COVID-19 pandemic.

Stripped of energy prices, the core inflation rate rose to only 1.6% (1.3% in
February 2021), so the FOMC still has room to continue its expansionary
monetary policy.
Weekly Housing Market Monitor
Inflation Rises to 2.6% in March 2020 with Potential to
Accelerate in Second Half as Travel Resumes
Among expenditure items, only prices of transportation are below year-ago
levels, indicating demand for transportation services for work or leisure
remain depressed. However, with more travel expected in the second half of
the year, transportation prices will also likely recover.
This month’s uptick in inflation and anticipation of higher inflation driven by
increased travel for work and leisure and a massive fiscal stimulus will tend
to push up the 10-year Treasury and hence the 30-year fixed mortgage rate
in the coming months.Weekly Housing Market Monitor
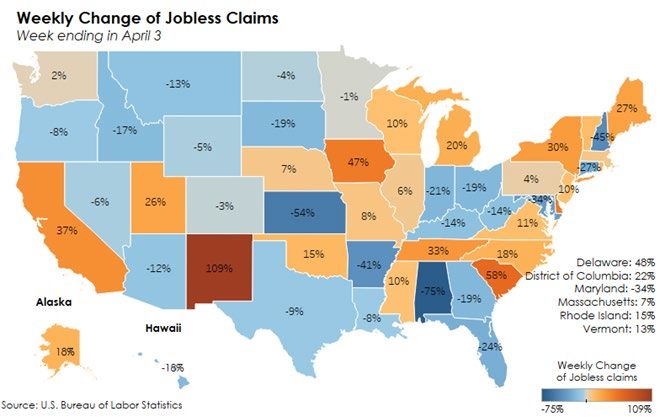
Jobless Claims: Week of April 3
Last week, the U.S. Bureau of Labor Statistics reported that the economy
added nearly one million jobs in March. That was the fastest acceleration
since August last year. In the meantime, job growth was revised up in both
January and February. Although the economy is creating jobs, layoffs are still
happening. The number of Americans applying for new jobless claims rose
by 18,172 last week to 740,878. Filling backlogs and rising COVID cases in
some states seem to be the main reasons for this increase of layoffs.
At the local level, 25 states reported a decrease in new claims for the week
ending April 3. Taking a closer look at the percentage change of the last
week's new claims with the new claims of the previous week, Alabama (-
75%) had the largest drop in layoffs followed by Kansas (-54%) and New
Hampshire (-45%). However, unadjusted new claims rose in New Mexico,
South Carolina, and Delaware. Particularly, compared to the previous week,
initial claims increased by 109% in New Mexico; 58% in South Carolina; 48% in
Delaware.
Click here to read the full analysis.Weekly Housing Market Monitor
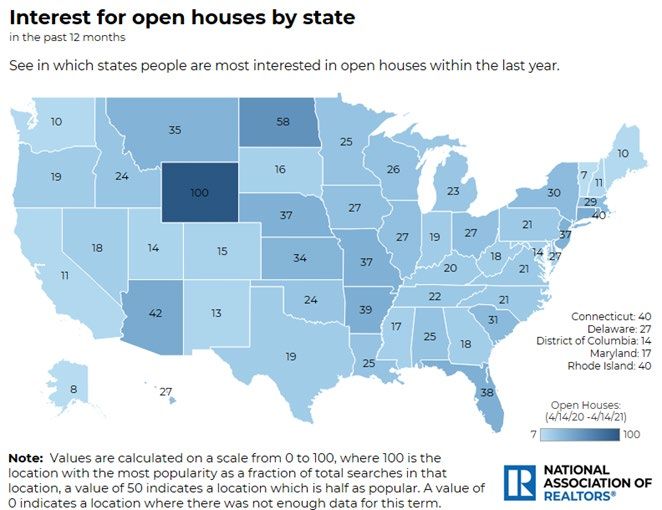
Open Houses
More people are searching to attend an in-person open house. Specifically,
public interest for in-person open houses is 64% higher than a year earlier.
Keep in mind that since the pandemic struck our country one year earlier,
year-over-year comparisons are going to be much higher for the next
several months. However, interest for open houses is lower by 65%
compared to 2 years earlier.
At the local level, interest is relatively stronger in Wyoming, North Dakota
and Arizona.
For more information on the latest
residential, commercial, and market trends,
read the Economists’ Outlook Blog.Weekly Housing Market Monitor
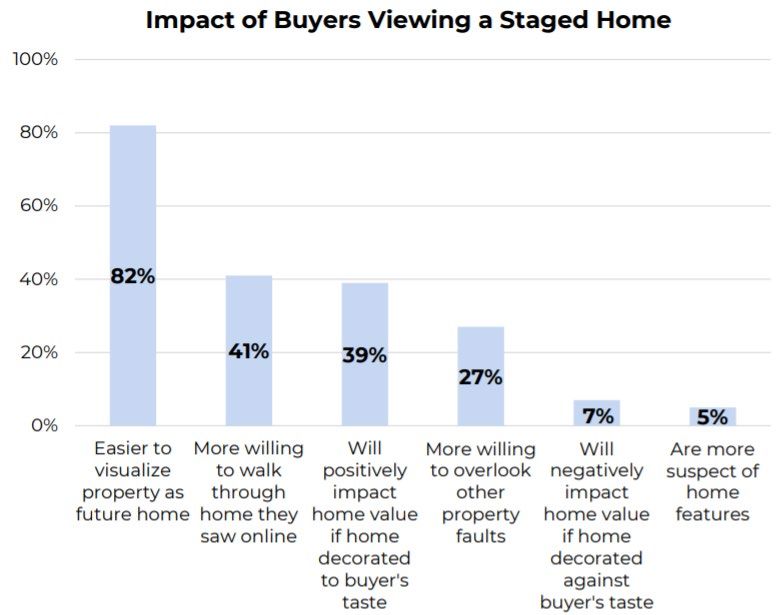
2021 Profile of Home Staging
Forty-seven percent of buyers’ agents cited that home staging had an effect
on most buyers’ view of the home.
Eighty-two percent of buyers’ agents said staging a home made it easier for a
buyer to visualize the property as a future home.
Staging the living room was found to be very important for buyers (46%),
followed by staging the master bedroom (43%), and staging the kitchen
(35%).
Read and download the full report hereNATIONAL ASSOCIATION OF REALTORS® RESEARCH GROUP Lawrence Yun, PhD Chief Economist & Senior Vice President Jessica Lautz, Doctor of Real Estate Vice President, Demographics and Behavioral Insights Gay Cororaton Senior Economist and Director of Housing and Commercial Research Nadia Evangelou Senior Economist and Director of Forecasting Meredith Dunn Research Manager Michael Hyman Research Data Specialist Hua Zhong Data Scientist ©2021 National Association of REALTORS® All Rights Reserved. May not be reprinted in whole or in part without permission of the National Association of REALTORS®. For reprint information, contact data@realtors.org.
The National Association of REALTORS® is America’s largest trade association,
representing more than 1.4 million members, including NAR’s institutes, societies
and councils, involved in all aspects of the real estate industry. NAR membership
includes brokers, salespeople, property managers, appraisers, counselors and
others engaged in both residential and commercial real estate. The term
REALTOR® is a registered collective membership mark that identifies a real estate
professional who is a member of the National Association of REALTORS® and
subscribes to its strict Code of Ethics. Working for America's property owners, the
National Association provides a facility for professional development, research and
exchange of information among its members and to the public and government
for the purpose of preserving the free enterprise system and the right to own real
property.

NATIONAL ASSOCIATION OF REALTORS®
RESEARCH GROUP

The Mission of the NATIONAL ASSOCIATION OF REALTORS® Research Group is to
produce timely, data driven market analysis and authoritative business
intelligence to serve members, and inform consumers, policymakers and the
media in a professional and accessible manner.

To find out about other products from NAR’s Research Group, visit
www.nar.realtor/research-and-statistics.

NATIONAL ASSOCIATION OF REALTORS®
RESEARCH GROUP
500 New Jersey Avenue, NW
Washington, DC 20001
202.383.1000
You can also read