Housing and Property Sector Chartpack - February 2018 - Finance.gov.ie

Page created by Tyler Porter
 
CONTINUE READING
Housing and Property Sector Chartpack - February 2018 - Finance.gov.ie
Housing and Property Sector Chartpack
February 2018
Housing and Property Sector Chartpack - February 2018 - Finance.gov.ie
Introduction
Given the important implications which developments in the property and construction sector can
have for the economy, the Department of Finance actively monitors developments in this sector on
an ongoing basis. The Housing and Property Sector Chartpack sets out some of the key indicators used
by the Department for this purpose. Each section of the Chartpack examines a different component
of the sector, including residential property prices and rents, affordability metrics, construction sector
activity, property market transactions, mortgage market activity and arrears levels. The publication
of the Chartpack is intended to provide a useful source of information on the sector and to make these
indicators accessible to a wider audience.

                                               Table of Contents
Housing and Property Sector Chartpack ................................................................................................. 1
Introduction ............................................................................................................................................ 2
   Section 1: Residential Property Price and Rent Developments ........................................................ 3
   Section 2: Affordability Metrics ......................................................................................................... 7
   Section 3: Construction Sector Activity ............................................................................................. 9
   Section 4: Property Market Transactions ........................................................................................ 13
   Section 5: Mortgage Market Activity............................................................................................... 15
   Section 6: Mortgage Arrears ............................................................................................................ 17

Department of Finance | Annual Taxation Report                                                                                                 Page | 2
Section 1: Residential Property Price and Rent Developments
 Figure 1.1 CSO Residential Property Price Index (RPPI)
                                                                Latest developments:

                                                                     Between November and December residential
                                                                      property prices increased by 0.5% nationally.

                                                                     In Dublin prices increased 0.2% between November
                                                                      and December.

                                                                     Prices outside of Dublin increased by 0.9% over the
                                                                      month.

                                                                Source: CSO. Note: RPPI reflect revisions to index as
                                                                published by CSO for all data to July 2017.
                                                                Last updated: February 2018 Next update: March 2018
 Figure 1.2 CSO RPPI Year-on-Year Change
                                                                Latest developments:

                                                                    In 2017, the national residential property index
                                                                     increased by 12.3% compared to 9% in 2016.

                                                                    In 2017, the residential property price index in Dublin
                                                                     increased by 11.6% compared with a growth rate of
                                                                     6.6% over the same period in 2016.

                                                                Source: CSO
                                                                Last updated: February 2018 Next update: March 2018
 Figure 1.3 CSO RPPI by Housing Type
                                                                Latest developments:

                                                                    Between November and December house prices
                                                                     increased by 0.4%.

                                                                    Apartment prices increased by 1.6% in December
                                                                     2017.

                                                                    Nationally excluding Dublin, house prices have
                                                                     increased 13.2% over the year.

                                                                    Dublin house prices are up by 10.8% over the year.

                                                                    Dublin apartment prices increased by 11.6% over the
                                                                     year.
                                                                Source: CSO
                                                                Last updated: February 2018 Next update: March 2018

Department of Finance | Housing and Property Sector Chartpack                                                   Page | 3
Figure 1.4 Comparison of Property Price Indices
                                                                Latest developments:

                                                                    According to the Daft House Price Report Q4 2017,
                                                                     asking prices increased by 1.6% over the quarter.

                                                                    There were an average of almost 21,000 properties
                                                                     available for sale nationwide during the fourth
                                                                     quarter. 565 lower than a year previously - the
                                                                     smallest fall in availability since early 2012.

                                                                Source: CSO, Daft.
                                                                Last updated: February 2018 Next update: March 2018
 Figure 1.5 Rolling 12 month Median Sales Price
                                                                Latest developments:
                                                                 The 12 month rolling median market transaction
                                                                    price was €229,950 nationally in December 2017.

                                                                   The 12 month rolling median price of a new dwelling
                                                                    was €309,999 in December 2017.

                                                                   The 12 month rolling median price of a second hand
                                                                    dwellings was €210,000 in December 2017.

                                                                Note: The estimated median price is not quality adjusted
                                                                and cannot account for the location or the physical
                                                                characteristics of the properties. New dwelling prices
                                                                have been revised upwards following the CSO revisions
                                                                to the RPPI which is now based on higher transaction
                                                                volumes.
                                                                Source: CSO
                                                                Last updated: February 2018 Next update: March 2018
 Figure 1.6 Dublin House Prices Year-on-Year Change
                                                                Latest developments:

                                                                   Across the Dublin regions, Dublin City house prices
                                                                    experienced the largest annual increase in in the 12
                                                                    months to December 2017, increasing by 13.2%.

                                                                   The lowest rate of annual growth across the Dublin
                                                                    regions was in Dún Laoghaire-Rathdown. In the 12
                                                                    months to October 2017 house prices increased by
                                                                    9%.

                                                                Note: The regional indices only reflect changes in house
                                                                prices and do not take into account apartment prices.

                                                                Source: CSO
                                                                Last updated: February 2018 Next update: March 2018

Department of Finance | Housing and Property Sector Chartpack                                                  Page | 4
Figure 1.7 Change in Regional House prices since trough
                                                                Latest Developments:

                                                                   House prices in the Mid-East Region have increased
                                                                    by 75% from the trough in the market.

                                                                   The Border region has seen the slowest growth in
                                                                    house prices, increasing 51% from the bottom of the
                                                                    market.

                                                                Note: The regional indices only reflect changes in house
                                                                prices and do not take into account apartment prices.

                                                                Source: CSO
                                                                Last updated: February 2018 Next update: March 2018
 Figure 1.8 12 Month Rolling Median Transaction Price by
 Region.
                                                                Latest developments:

                                                                    Significant variation in transaction prices across the
                                                                     country.

                                                                    Highest 12 month rolling median transaction price in
                                                                     December 2017 was in Dublin, at €350,000

                                                                    The lowest 12 month rolling median transaction price
                                                                     in December 2017 was in the border region at
                                                                     €118,000.

                                                                Note: The estimated median price is not quality adjusted
                                                                and cannot account for the location or the physical
                                                                characteristics of the properties.
                                                                Source: CSO
                                                                Last updated: February 2018 Next update: March 2018
 Figure 1.9 Rent Indices
                                                                Latest developments:

                                                                   Nationally, average rents rose by 3.9% between Q2
                                                                    2017 and Q3 2017 according to the RTB Index.

                                                                   Nationally the average rent was €1,056 in Q3 2017.

                                                                   According to Daft.ie, there were fewer than 3,150
                                                                    properties available to rent nationwide on February
                                                                    1st, down over 20% on the same date a year ago.

                                                                Note: The observation for January 2016 in the Daft
                                                                Rental Index is an outlier and has been excluded from
                                                                Figure 1.9.

                                                                Source: CSO, Daft, RTB
                                                                Last updated: February 2018 Next update: March 2018

Department of Finance | Housing and Property Sector Chartpack                                                    Page | 5
Figure 1.10 Rent Indices Year-on-Year % Change
 Figure 1.10 Rent Indices Year-on-Year % Change                 Latest developments:

                                                                   According to the RTB index, rents increased by 9.5%
                                                                    on an annual basis in Q3 2017.

                                                                   CSO CPI Private Rent inflation was approximately 6.1%
                                                                    in the 12 months to December 2017.

                                                                   Rents were 10.4% higher on an annual basis in
                                                                    December 2017, according to the Daft Rental Report.

                                                                Note: The observation for January 2016 and January 2017
                                                                in the Daft Rental Index are outliers and have been
                                                                excluded from Figure 1.10.

                                                                Source: CSO, Daft, RTB
                                                                Last updated: February 2018 Next update: March 2018
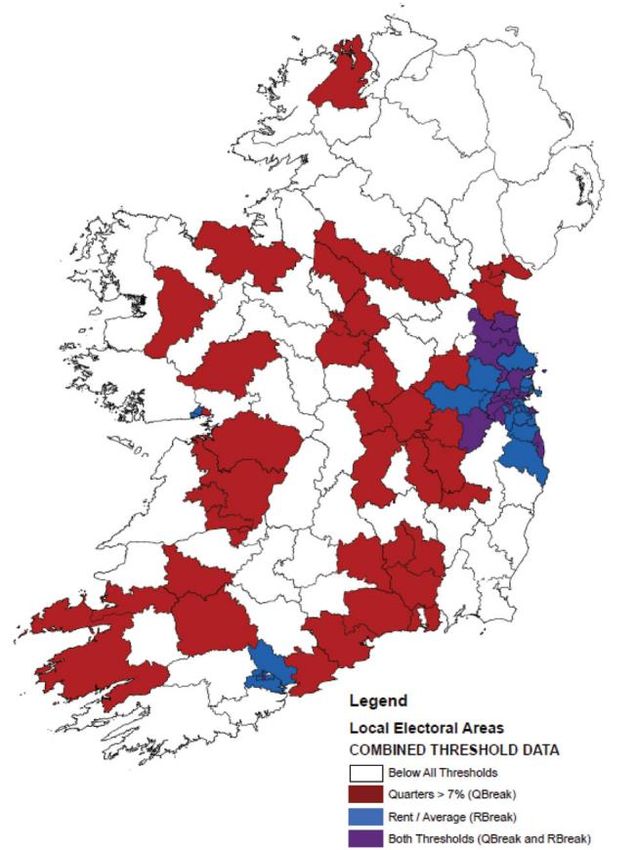
 Figure 1.11 Rent Pressure Zones
                                                                Latest developments:

                                                                   57% of all tenancies are now in a designated Rent
                                                                    Pressure Zone (RPZ).

                                                                   In Dublin rents increased 9.9% on an annual basis in
                                                                    Q3 2017.

                                                                   Outside of the Dublin Greater Area rents increased by
                                                                    9.2% on an annual basis in Q3 2017.

                                                                Note:
                                                                The two criteria required to be classified as an RPZ are:
                                                                (1) The annual rate of rental growth in an area must
                                                                    have exceeded 7% in 4 of the last 6 quarters.
                                                                (2) The average rent in an area must exceed the
                                                                    national average in that quarter.

                                                                    RPZ designations are reviewed quarterly and
                                                                    published as part of the RTB Rent Index.

                                                                Source: RTB
                                                                Last updated: December 2017 Next update: March 2018

Department of Finance | Housing and Property Sector Chartpack                                                  Page | 6
Section 2: Affordability Metrics
 Figure 2.1 House Price/ Disposable Income per capita
                                                                Latest developments:

                                                                    Average house prices were 12.86 times average
                                                                     disposable income per capita in 2017 Q3.

                                                                    This is marginally below the long term average of
                                                                     12.92.

                                                                Notes: House Price series is based on CSO average house
                                                                price in Q2 2017, which is then indexed to the CSO House
                                                                Price Index and the PRTB/ESRI Index. Long term average is
                                                                for period 1999Q4-2017Q2.

                                                                Source: CSO, ESRI/PTSB
                                                                Last updated: December 2017 Next update: March 2018
 Figure 2.2 House Price/ Disposable Income per household
                                                                Latest developments:
                                                                  Average house prices were 4.65 times average
                                                                     disposable household income in 2017 Q3.

                                                                    The ratio is just above the long term average of 4.5.

                                                                Definition: House Price/ Disposable Income per
                                                                household

                                                                Notes: House Price series is based on CSO average house
                                                                price in Q2 2017, which is then indexed to CSO House
                                                                Price Index and the PRTB/ESRI Index. Long term average is
                                                                for period 1999Q4-2017Q2.

                                                                Source: CSO, ESRI/PTSB
                                                                Last updated: December 2017 Next update: March 2018
 Figure 2.3 Debt servicing costs (FTB, working couple)
                                                                Latest developments:
                                                                  Debt servicing cost for FTB based on assumption of:
                                                                     working couple, LTV 80%, 25 years, average earnings,
                                                                     Dublin earnings assumed to be 10% greater than
                                                                     national average.

                                                                    Debt servicing costs for FTB’s are estimated to be
                                                                     21.2% of net income.

                                                                    Debt servicing costs in Dublin are estimated to be
                                                                     27.4% of net income for a FTB couple.

                                                                    Outside of Dublin, debt servicing costs are estimated
                                                                     to be equivalent to 16.7% of net income for a FTB
                                                                     Couple.
                                                                Source: EBS/DKM Affordability Index
                                                                Last updated: July 2017     Next update: TBC

Department of Finance | Housing and Property Sector Chartpack                                                    Page | 7
Figure 2.4 Average National Rent/Disposable Income per
 Household
                                                                Latest developments:

                                                                   Rents accounted for approximately 22.2% of
                                                                    disposable household income in Q3 2017.

                                                                   The Rent to Income ratio has now been above the
                                                                    long term average for 14 consecutive quarters.

                                                                Note: Long term average estimated for period 2002Q1-
                                                                2017Q2.

                                                                Source: CSO, RTB.
                                                                Last updated: December 2017 Next update: March 2018
 Figure 2.5 House Price/Rent Ratio
                                                                Latest developments:

                                                                   House prices are approximately 20.9 times average
                                                                    annual rents.

                                                                   The house price/rent ratio remains noticeably below
                                                                    the long term average of 23.85.

                                                                Note: Long term average is for period 2002Q1-2016Q4.
                                                                Source: CSO, RTB.
                                                                Last updated: December 2017 Next update: March 2018

Department of Finance | Housing and Property Sector Chartpack                                                Page | 8
Section 3: Construction Sector Activity
 Figure 3.1 Connections/Completions and Registrations
                                                                Latest developments:

                                                                    For the full year 2017 there were 19,272 house
                                                                     connections. This represents a 28.1% increase on the
                                                                     same period in 2016.

                                                                   Registrations in 2017 (9,466) are up 68% on 2016.

                                                                Source: DHPLG
                                                                Last updated: Jan 2018 Next update: February 2018
 Figure 3.2 Connections/Completions by Region
                                                                Latest developments:

                                                                    Connections/Completions in 12 months to December
                                                                     2017: Dublin 6,099 GDA 9,122 ROC 10,149

                                                                    House completions in Dublin in the 12 months to
                                                                     December 2017 (6,099) increased by 44% compared
                                                                     to the same period in 2016.

                                                                    In Kildare, Meath, Wicklow completions (3,023)
                                                                     increased by 47.1% in the 12 months to December
                                                                     2017, while the rest of the country (10,040) saw a
                                                                     17.4% increase in completions.

                                                                Source: DHPLG
                                                                Last updated: Jan 2018 Next update: February 2018
 Figure 3.3 Housing Connections/Completions by type
                                                                Latest developments:
                                                                  In Dublin, over 50% of housing units completed were
                                                                     apartments in 2005 and 2010. In 2017, apartments
                                                                     accounted for 34% of total completions in Dublin.
                                                                 In 2017, 58% (3,516) of residential units built in Dublin
                                                                    were scheme houses.
                                                                 Outside of the Greater Dublin Area 58.3% (5,403) of
                                                                    residential units completed in 2017 were individual
                                                                    houses compared with 31% in 2005.
                                                                Definition: "Individual House" is where connection is provided
                                                                to separate detached house. "Scheme House" is where
                                                                connection is provided to two or more houses. "Apartments" is
                                                                where all customer metering for the block is centrally located.

                                                                Source: DHPLG
                                                                Last updated: Jan 2018 Next update: February 2018
 Figure 3.4 House Commencements, Quarterly

Department of Finance | Housing and Property Sector Chartpack                                                       Page | 9
Latest developments:

                                                                    17,572 units were commenced in 2017, a 33%
                                                                     increase over 2016.

                                                                    There is a break in series in February 2014 due to
                                                                     change to data collection methodology.

                                                                Source: DHPLG
                                                                Last updated: Jan 2018 Next update: February 2018

 Figure 3.5 House commencements by region, Quarterly
                                                                Latest developments:

                                                                    In 2017, 60% of all commencement notices were in
                                                                     Dublin and the surrounding commuter counties.

                                                                    In 2017, commencement notices in Dublin increased
                                                                     by 30% compared to 2016.

                                                                    Commencement activity outside of the Greater
                                                                     Dublin Region has remained resilient, with activity
                                                                     increasing by 41.6% in 2017 compared to 2016.

                                                                Source: DHPLG
                                                                Last updated: Jan 2018 Next update: February 2018
 Figure 3.6 Construction Sector Employment
                                                                Latest developments:

                                                                    127,400 were employed in the construction sector in
                                                                     Q3 2017.

                                                                    Construction sector employment in Q3 2017 is 7%
                                                                     higher than the same period in 2016.

                                                                Note: There have been significant revisions to the
                                                                construction sector employment estimates as part of the
                                                                Labour Force Survey replacing the Quarterly National
                                                                Household Survey.

                                                                Source: CSO, LF
                                                                Last updated: January 2018 Next update: April 2018
                                                                2017

Department of Finance | Housing and Property Sector Chartpack                                                   Page | 10
Figure 3.7 Investment
                                                                Latest developments:

                                                                    Investment in the construction of new dwellings
                                                                     stood at €1,273 million in Q3 2017, 50.3% higher
                                                                     than in Q3 2016.

                                                                    Investment in new dwellings made up approximately
                                                                     10% of investment in Q3 2017.

                                                                Note: Investment equates to ‘Modified’ Gross Domestic
                                                                Fixed Capital Investment as it removes the distortionary
                                                                impact of R&D-related intellectual property imports and
                                                                aircraft leasing and better captures domestic investment
                                                                activity.

                                                                Source: Quarterly National Accounts. CSO.
                                                                Last updated: January 2018 Next update: April 2018
 Figure 3.8 Ulster Bank PMI
                                                                Latest developments:
                                                                  Housing activity continued to expand in December
                                                                     with a PMI figure of 59.4.
                                                                  This represents a 1.37% decrease in the rate of
                                                                     housing activity growth over the month.
                                                                  Whilst the rate of expansion has varied significantly
                                                                     month on month, housing activity has continuously
                                                                     expanded each month since July 2013.

                                                               Methodology:
                                                                PMI surveys selected companies which provide an
                                                                advance indication of what is happening in the private
                                                                sector economy by tracking variables such as output, new
                                                                orders, employment and prices across both
                                                                manufacturing and service sectors. A reading of >50(
Latest developments:

                                                                   Some 36,356 units have been granted planning
                                                                    permission in the Dublin Region and are currently
                                                                    within active construction sites. 60.2% of these units
                                                                    are yet permitted but not commenced.

                                                                   Approximately 7,393 units are currently under
                                                                    construction, of which 28.5% are in Dublin City.

                                                                Source: Dublin Housing Supply Taskforce Returns.
                                                                Last updated: August 2017 Next update: Dec 2017

Department of Finance | Housing and Property Sector Chartpack                                                   Page | 12
Section 4: Property Market Transactions
 Figure 4.1 Market Transactions
                                                                Latest developments:

                                                                    Transactions in Q3 2017 (13,329) decreased by 11%
                                                                     compared to the same period in 2016.
                                                                    Transactions in Q3 2017 increased by 16.2% in
                                                                     Dublin (4,565), increased by 25.6% in the GDA
                                                                     (1,687) and increased by 5% in the rest of the
                                                                     country (7,077) compared to Q3 2016.

                                                                Note: Because registrations are entered with a lag by
                                                                solicitors, figures for previous quarters are subject to
                                                                revision. Transaction volumes were revised upwards in
                                                                the latest RPPI release and now include a number of
                                                                formerly excluded transactions.

                                                                Source: CSO RPPI
                                                                Last updated: December 2017 Next update: March 2018
 Figure 4.2 Four Quarter Residential Property Trans.
                                                                Latest developments:

                                                                     At 49,641 transactions increased by 9.6 % in the four
                                                                      quarters to Q3 2017.
                                                                  Transactions increased by 16.4% in Dublin, increased
                                                                      by 19.1% in the Greater Dublin Area and by 3.9% in
                                                                      the rest of the country.
                                                                  Annual transactions are approximately 2.5% of total
                                                                      housing stock. (3.2% in Dublin, 3% GDA and 2.1%
                                                                      ROC).
                                                                Note: Because registrations are entered with a lag by
                                                                solicitors, figures for previous quarters are subject to
                                                                revision. Transaction volumes were revised upwards in
                                                                the latest RPPI release and now include a number of
                                                                formerly excluded transactions.

                                                                Source: CSO RPPI.
                                                                Last updated: December 2017 Next update: March 2018
 Figure 4.3 Regional Breakdown of Transactions
                                                                Latest developments:

                                                                    In 2010 Dublin accounted for approximately 35% of
                                                                     all transactions. In Q3 2017, Dublin accounted for
                                                                     34.3% of all transactions.

                                                                    The Midwest region has experienced the largest
                                                                     increase in the share of total transactions since 2010.
                                                                     Currently the Midwest region accounts for
                                                                     approximately 8.9% of all transactions.

                                                                Source: CSO RPPI.
                                                                Last updated: December 2017 Next update: March 2018

Department of Finance | Housing and Property Sector Chartpack                                                   Page | 13
Figure 4.4 Proportion of Residential Market Buyers
                                                                Latest Developments:

                                                                     Former owner occupiers represent largest share of
                                                                      the market, accounting for 44.2% of all transactions
                                                                      in Q3 2017.

                                                                     The share of FTB’s has fallen from over 50% in 2010
                                                                      to 24.6% in the Q3 2017.

                                                                     Non-Household purchasers (e.g. private firms and
                                                                      Institutions) accounted for 13.9% of market
                                                                      transactions in Q3 2017.

                                                                Source: CSO RPPI.
                                                                Last updated: December 2017 Next update: March 2018
 Figure 4.5 Non-Mortgage Purchasers
                                                                Latest developments:

                                                                    The volume of non-mortgage transactions declined
                                                                     by approximately 0.6% in the four quarters to Q3
                                                                     2017.

                                                                    By contrast, the number of mortgage drawdowns for
                                                                     house purchases increased by approximately 17.5%
                                                                     in the four quarters to Q3 2017.

                                                                Source: BPFI, CSO
                                                                Last updated: December 2017 Next update: March 2018
 Figure 4.6 Share of Non-Mortgage Purchasers in Total
 Market Transactions
                                                                Latest developments:

                                                                    Share of non-mortgage purchasers has begun to
                                                                     decline as the number of mortgage drawdowns has
                                                                     gradually increased.

                                                                    Non-mortgage purchasers accounted for
                                                                     approximately 43% of all market transactions in Q3
                                                                     2017.

                                                                Source: BPFI, CSO
                                                                Last updated: December 2017 Next update: March 2018

Department of Finance | Housing and Property Sector Chartpack                                                  Page | 14
Section 5: Mortgage Market Activity
 Figure 5.1 No. of Mortgages Drawn Down
                                                                Latest developments:

                                                                   The number of mortgage drawdowns for house
                                                                    purchase in Q4 2017 (8,709) was up by 14.65% over
                                                                    the same period in 2016.

                                                                   Composition of mortgage drawdowns in Q4 2017:
                                                                    FTB 5,249 Movers 3,085 and Investment 656.

                                                                   Approximately 60.3% of all mortgages drawn down
                                                                    for purchases were from first-time buyers in Q4 2017.

                                                                Source: BPFI – Data from BPFI member institutions
                                                                estimated to cover over 95% of the mortgage market.
                                                                Last update: January 2018 Next update: April 2018
 Figure 5.2 Value of Loans Drawn down
                                                                Latest developments:

                                                                   The value of mortgage drawdowns for house
                                                                    purchases in Q4 2017 (€1,943m) increased by 23.7%
                                                                    compared to the same period in 2016.

                                                                   Composition of mortgage drawdowns by value in Q3
                                                                    2017: FTB €1,111m, Movers €781m, Investment
                                                                    €51m.

                                                                Source: BPFI – Data from BPFI member institutions
                                                                estimated to cover over 95% of the mortgage market.
                                                                Last update: January 2018 Next update: April 2018
 Figure 5.3 Number of Mortgage Approvals
                                                                Latest developments:

                                                                   The volume of mortgage approvals (8,768) for house
                                                                    purchases in Q4 2017 rose by 9% compared to the
                                                                    same month in 2016.

                                                                   First time buyers accounted for 58.8% of mortgage
                                                                    approval for house purchases in Q4 2017.

                                                                Source: BPFI. Data from BPFI member institutions
                                                                estimated to cover over 95% of the mortgage market.
                                                                Last update: January 2018 Next update: April 2018

Department of Finance | Housing and Property Sector Chartpack                                                 Page | 15
Figure 5.4 Value of Mortgage Approvals
                                                                Latest developments:

                                                                   The value of mortgage approvals for house purchases
                                                                    in Q4 2017 (€1,999m) increased by 17.1% compared
                                                                    to the same period in 2016.

                                                                   First Time Buyers (€1,120m) accounted for 56% of
                                                                    mortgage approval value for house purchases in Q4
                                                                    2017.

                                                                Source: BPFI. Data from BPFI member institutions
                                                                estimated to cover over 95% of the mortgage market.
                                                                Last update: November 2017 Next update: Feb 2018
 Figure 5.5 Mortgage Interest Rates
                                                                Latest developments:

                                                                   The average mortgage interest rate on the stock of
                                                                    outstanding housing loans with original maturity over
                                                                    5 years was approximately 2.5% in December 2017.

                                                                   This figure disguises compositional differences
                                                                    between those on standard variable rates and tracker
                                                                    mortgages.

                                                                Source: Central Bank, CSO.
                                                                Last update: December 2017 Next update: Jan 2018
 Figure 5.6 Interest Rate on New Housing loans
                                                                Latest developments:

                                                                   The average mortgage interest rate agreed on new
                                                                    housing loans is 3.17%.

                                                                Source: Central Bank.
                                                                Last update: Jan 2018 Next update: Feb 2018

Department of Finance | Housing and Property Sector Chartpack                                                 Page | 16
Section 6: Mortgage Arrears
 Figure 6.1 PDH Mortgage Accounts in Arrears
                                                                Latest developments:

                                                                    731,119 PDH mortgage accounts held in the Republic
                                                                     of Ireland at the end of September 2017.

                                                                    9.9% of mortgages were in arrears at the end of
                                                                     September 2017.

                                                                   The number of mortgages in arrears decreased by
                                                                    8.9% in the year to September 2017.

                                                                Source: Central Bank
                                                                Last update: January 2018 Next update: April 2018
 Figure 6.2 PDH Mortgage Accounts by Days in Arrears
                                                                Latest developments:

                                                                   The number of PDH accounts in arrears by less than
                                                                    90 days at the end of September 2017 was 21,801, a
                                                                    decrease of 10.5% compared to September 2016.

                                                                   The number of PDH in arrears over 720 days at the
                                                                    end of 2016 was 31,624, a decrease of 8% since
                                                                    September 2016.

                                                                Source: Central Bank
                                                                Last update: January 2018 Next update: April 2018
 Figure 6.3 Total Mortgage Restructures
                                                                Latest developments:

                                                                • Total outstanding PDH mortgage accounts classified as
                                                                restructured stood at 119,070 at end of September 2017.

                                                                • Arrears capitalisation is the most prominent type of
                                                                mortgage restructure, followed by split mortgage
                                                                agreements.

                                                                Source: Central Bank
                                                                Last updated: January 2018 Next update: April 2018
 Figure 6.4 BTL Mortgage Accounts in Arrears

Department of Finance | Housing and Property Sector Chartpack                                                   Page | 17
Latest Developments:

                                                                   The total number of BTL mortgages outstanding
                                                                    stood at 124,702 at the end of September 2017.

                                                                   As of September 2017, 18.6% of BTL mortgages were
                                                                    in arrears.

                                                                   The number of BTL mortgages in arrears has
                                                                    decreased by 11% since September 2016.

                                                                Source: Central Bank
                                                                Last update: January 2018 Next update: April 2018
 Figure 6.5 BTL Mortgage Accounts by Days in Arrears
                                                                Latest Developments:

                                                                   4,312 BTL mortgages were in arrears less than 90
                                                                    days in September 2017, an 11% decrease on the
                                                                    same period in 2016.

                                                                    143,591 BTL mortgage were in arrears more than
                                                                    720 days in September 2017, a 6.4% decrease over
                                                                    the same period in 2016.

                                                                Source: Central Bank
                                                                Last update: January 2018 Next update: April 2018
 Figure 6.6 Total BTL Mortgage Restructures
                                                                Latest Developments:

                                                                   As of September 2017, the total number of
                                                                    outstanding BTL mortgages classified as restructured
                                                                    was 23,034, an 11.9% decrease on the same period in
                                                                    2016.

                                                                   Reduced payment remain the most common form of
                                                                    restructuring, followed by arrears capitalisation.

                                                                Source: Central Bank
                                                                Last update: January 2018 Next update: April 2018

Department of Finance | Housing and Property Sector Chartpack                                                 Page | 18
You can also read