Housing and Property Sector Chartpack February 2020

Page created by Sam Mills
 
CONTINUE READING
Housing and Property Sector Chartpack February 2020
Housing and Property Sector
Chartpack
February 2020

Prepared by the Economics Division,
Department of Finance
www.gov.ie/finance
Housing and Property Sector Chartpack February 2020
Introduction
Given the important implications which developments in the property and construction sector can
have for the economy, the Department of Finance actively monitors developments in this sector on
an ongoing basis. The Housing and Property Sector Chartpack sets out some of the key indicators used
by the Department for this purpose. Each section of the Chartpack examines a different component
of the sector, including residential property prices and rents, affordability metrics, construction sector
activity, property market transactions, mortgage market activity and arrears levels. The publication
of the Chartpack is intended to provide a useful source of information on the sector and to make these
indicators accessible to a wider audience.

                                               Table of Contents
Introduction ............................................................................................................................................ 2
   Section 1: Residential Property Price and Rent Developments ........................................................ 3
   Section 2: Affordability Metrics ......................................................................................................... 7
   Section 3: Construction Sector Activity ............................................................................................. 9
   Section 4: Property Market Transactions ........................................................................................ 13
   Section 5: Mortgage Market Activity............................................................................................... 13
   Section 6: Mortgage Arrears ............................................................................................................ 17

Department of Finance                                                                                                                 Page | 2
Housing and Property Sector Chartpack February 2020
Section 1: Residential Property Price and Rent Developments
 Figure 1.1 CSO Residential Property Price Index (RPPI)
                                                                Latest developments:

                                                                     Between November and December 2019, the national
                                                                      residential property price index decreased by 0.6%.

                                                                     In Dublin prices decreased by 0.8% between November
                                                                      and December.

                                                                     Prices outside of Dublin decreased by 0.3% over the
                                                                      month.

                                                                Source: CSO
                                                                Last updated: February 2020 Next update: March 2020

 Figure 1.2 CSO RPPI Year-on-Year Change
                                                                Latest developments:

                                                                     In the year to December 2019 residential property
                                                                      prices increased by 0.9%.

                                                                     In the year to December 2019, the residential property
                                                                      price index in Dublin decreased by 0.9% compared with
                                                                      a growth rate of 3.8% over the same period in 2018.

                                                                     Prices in the rest of Ireland excluding Dublin were up
                                                                      2.8%, compared to 8.8% in the year to December 2018.

                                                                Source: CSO
                                                                Last updated: February 2020 Next update: March 2020
 Figure 1.3 CSO RPPI by Housing Type
                                                                Source: CSO
                                                                Latest developments:
                                                                Last updated: January 2019 Next update: February 2019
                                                                    Between November and December house prices
                                                                     decreased by 0.4%.

                                                                    Apartment prices fell by 0.7% between
                                                                     November and December 2019. In Dublin apartment
                                                                     prices fell by 0.9% over the month.

                                                                    Nationally excluding Dublin, house prices have increased
                                                                     2.8% over the year. Dublin house prices are down by
                                                                     0.6% over the year, while Dublin apartment prices
                                                                     decreased by 1.8% over the year.

                                                                Note: The latest two months of RPPI data are provisional
                                                                and subject to revisions.
                                                                Source: CSO. Last updated: February 2020 Next update:
                                                                March 2020

Department of Finance | Housing and Property Sector Chartpack                                                Page | 3
                                                                Source: CSO
                                                                Last updated: March 2019 Next update: April 2019
Housing and Property Sector Chartpack February 2020
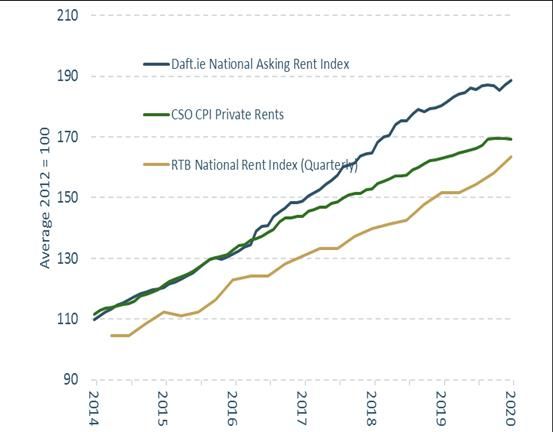
Figure 1.4 Comparison of Property Price Indices
                                                                Latest developments:
                                                                  The latest CSO data shows there has been a 0.9% increase
                                                                     in property prices in the year to December 2019.

                                                                    In comparison according to the Daft House Price Report
                                                                     Q4 2019, the annual rate of increase in asking prices,
                                                                     nationally fell by 0.8% from December 2018 to December
                                                                     2019

                                                                    The MyHome.ie Q4 2019 property report shows there has
                                                                     been a 3% increase in asking prices between Q4 2018 and
                                                                     Q4 2019.
                                                                Note: The MyHome index has been recalculated to make 2012
                                                                the base year and is reported on a quarterly basis compared
                                                                to the other indices which are monthly.
                                                                Source: CSO, Daft.ie, MyHome.ie
                                                                Last updated: February 2020 Next update: March 2020
 Figure 1.5 Rolling 12 month Median Sales Price
                                                                Latest developments:
                                                                 The 12 month rolling median market transaction price was
                                                                    €260,000 nationally in December 2019.

                                                                   The 12 month rolling median price of a new dwelling was
                                                                    €350,000 in December 2019.

                                                                   The 12 month rolling median price of a second hand
                                                                    dwelling was €232,500 in December 2019.

                                                                Note: The estimated median price is not quality adjusted and
                                                                cannot account for the location or the physical characteristics,
                                                                including size of the properties.

                                                                Source: CSO
                                                                Last updated: February 2020 Next update: March 2020
 Figure 1.6 Dublin House Prices Year-on-Year Change
                                                                Latest developments:

                                                                   Across the Dublin regions Fingal house prices experienced
                                                                    the largest annual increase in the 12 months to December
                                                                    2019, increasing by 2.9%.

                                                                   The lowest rate of annual growth across the Dublin regions
                                                                    was in Dún Laoghaire-Rathdown. In the 12 months to
                                                                    December 2019 house prices decreased by 6%.

                                                                Note: The regional indices only reflect changes in house prices
                                                                and do not take into account apartment prices.

                                                                Source: CSO
                                                                Last updated: February 2020 Next update: March 2020

Department of Finance | Housing and Property Sector Chartpack                                                  Page | 4
Housing and Property Sector Chartpack February 2020
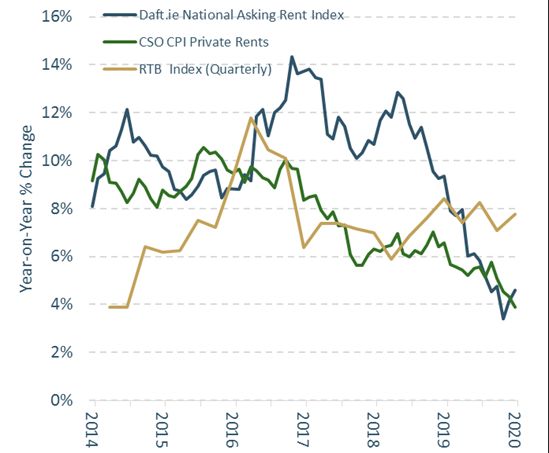
Figure 1.7 Change in Regional House prices since trough
                                                                Latest Developments:

                                                                   House prices have increased by 93.5% in Dublin and by
                                                                    85.3% in the South-West Region from the trough in the
                                                                    market.

                                                                   The Border region has seen the slowest growth in house
                                                                    prices, increasing 69.3% from the bottom of the market.

                                                                Note: The regional indices reflect changes in house prices
                                                                only and do not take into account apartment prices.

                                                                Source: CSO
                                                                Last updated: February 2020 Next update: March 2020
 Figure 1.8 12 Month Rolling Median Transaction Price by
 Region.
                                                                Latest developments:

                                                                    Significant variation in transaction prices across the
                                                                     country.

                                                                    Highest 12 month rolling median transaction price in
                                                                     December 2019 was in Dublin, at €370,000

                                                                    The lowest 12 month rolling median transaction price in
                                                                     December 2019 was in the Border region at €135,000.

                                                                Note: The estimated median price is not quality adjusted
                                                                and cannot account for the location or the physical
                                                                characteristics of the properties.

                                                                Source: CSO
                                                                Last updated: February 2020 Next update: March 2020
 Figure 1.9 Rent Indices
                                                                Latest developments:
                                                                 The RTB rent index is the most comprehensive source of
                                                                    rent prices in Ireland.

                                                                   Nationally, average rents rose by 3.3% between Q2 2019
                                                                    and Q3 2019 according to the RTB index. The national
                                                                    standardised average rent in Q3 2019 was €1,243 per
                                                                    month.

                                                                   Nationally the average asking rent was €1,402 in Q4
                                                                    2019 according to the Daft.ie Q4 2019 Irish Rental
                                                                    Report.
                                                                Note: The observation for January 2016 in the Daft Rental
                                                                Index is an outlier and has been excluded from Figure 1.9.

                                                                Source: CSO, Daft, RTB
                                                                Last updated: February 2020 Next update: March 2020

Department of Finance | Housing and Property Sector Chartpack                                                    Page | 5
Figure 1.10 Rent Indices Year-on-Year % Change
 Figure 1.10 Rent Indices Year-on-Year % Change                 Latest developments:

                                                                   According to the RTB index, rents increased by 8.2% on
                                                                    an annual basis in Q3 2019.

                                                                   CSO CPI Private Rent inflation was approximately 3.9% in
                                                                    the 12 months to January 2020.

                                                                   Asking rents were 4.1% higher on an annual basis in
                                                                    January 2020, according to the Daft Rental Report.

                                                                Source: CSO, Daft, RTB
                                                                Last updated: February 2020 Next update: March 2020
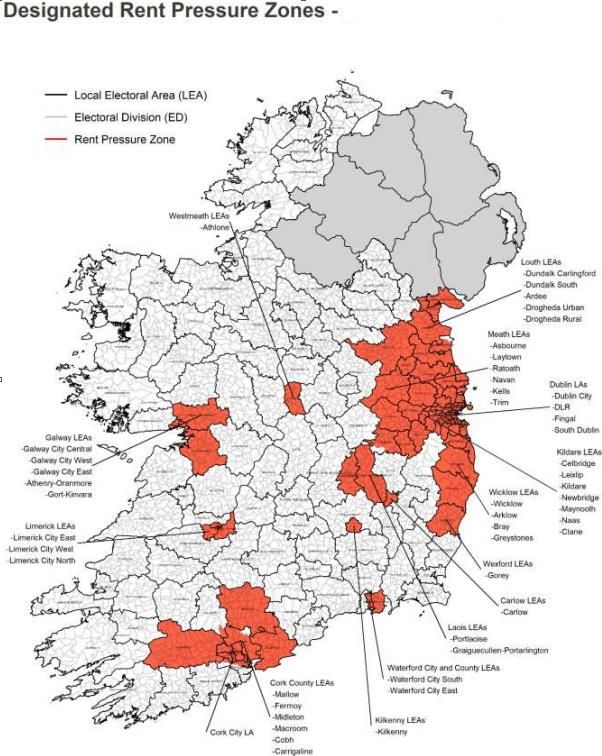
 Figure 1.11 Rent Pressure Zones
                                                                Latest developments:

                                                                   4 new Local Electoral Areas have been designated Rent
                                                                    Pressure Zones, Cobh in Co. Cork, Baltinglass in Co.
                                                                    Wicklow, Piltown in Co. Kilkenny and Sligo-Strandhill in
                                                                    Co. Sligo.

                                                                   National standardised average rent in Q3 2019 increased
                                                                    annually by 8.2%, to €1,243 per month.

                                                                   In Dublin rents increased 6.6% on an annual basis in Q3
                                                                    2019, to €1,762.

                                                                   Outside of the Greater Dublin Area (GDA) rents
                                                                    increased by 9.2% on an annual basis in Q3 2019.
                                                                Note:
                                                                The two criteria required to be classified as an RPZ are:
                                                                (1) The annual rate of rental growth in an area must have
                                                                    exceeded 7% in 4 of the last 6 quarters.
                                                                (2) The average rent in an area must exceed the relevant
                                                                    national standardized average in that quarter.

                                                                From June 2019 there are now three different standardized
                                                                average rents to be used when assessing an area:
                                                                 (1) Dublin areas will remain compared to the national
                                                                s standardized average rent.
                                                                 (2) The GDA excluding Dublin will be compared to the n
                                                                national standardized average rent excluding Dublin
                                                                 (3) The rest of the country outside the GDA and Dublin
                                                                w will be compared to an outside GDA standardised
                                                                a average rent.

                                                                Source: RTB
                                                                Last updated: December 2019 Next update: March 2020

Department of Finance | Housing and Property Sector Chartpack                                                  Page | 6
Section 2: Affordability Metrics
 Figure 2.1 House Price/ Disposable Income per capita
                                                                Latest developments:

                                                                    Average house prices were 12.48 times average
                                                                     disposable income per capita in Q3 2019.

                                                                    This is below the long term average of 12.80.

                                                                Notes: House Price series is based on CSO average house
                                                                price in Q2 2017, which is then indexed to the CSO House
                                                                Price Index and the PRTB/ESRI Index. The long term average
                                                                is for the period 1999Q4-2019Q3.

                                                                Source: CSO, ESRI/PRTB – pre 2017
                                                                Last updated: December 2019 Next update: March 2020
 Figure 2.2 House Price/Disposable Income per household
                                                                Latest developments:
                                                                  Average house prices were 4.5 times average disposable
                                                                     household income in Q3 2019.

                                                                    The ratio is equal to the long term average of 4.5.

                                                                Definition: House Price/ Disposable Income per household

                                                                Notes: House Price series is based on CSO average house
                                                                price in Q4 2017, which is then indexed to CSO House Price
                                                                Index and the PRTB/ESRI Index. The long term average is for
                                                                the period 1999Q4-2019Q3.

                                                                Source: CSO, ESRI/PRTB – pre 2017
                                                                Last updated: December 2019 Next update: March 2020

 Figure 2.3 Average National Rent/Disposable Income per
 Household
                                                                Latest developments:

                                                                   Rents accounted for approximately 23% of household
                                                                    disposable income in 2019 Q3.

                                                                   The Rent to Income ratio is at its highest level since 2002
                                                                    Q4.

                                                                Note: Long term average estimated for period 2002Q1-
                                                                2019Q3.

                                                                Source: CSO, RTB.
                                                                Last updated: December 2019 Next update: March 2020

Department of Finance | Housing and Property Sector Chartpack                                                   Page | 7
Figure 2.4 House Price/Rent Ratio
                                                                Latest developments:

                                                                   House prices are approximately 19.6 times average
                                                                    annual rents in Q3 2019.

                                                                   The house price/rent ratio is at its lowest level since Q1
                                                                    2014.

                                                                Note: Long term average is for period 2002Q1-2019Q3.
                                                                Source: CSO, RTB.
                                                                Last updated: December 2019 Next update: March 2020

Department of Finance | Housing and Property Sector Chartpack                                                    Page | 8
Section 3: Construction Sector Activity
 Figure 3.1 Completions and Registrations
                                                                Latest developments:

                                                                    In 2019 there were 21,241 new home completions.
                                                                     This represents an 18.3% increase on 2018.

                                                                   New house guarantee registrations in the year to Q3
                                                                    2019 (10,224) are up 6.6% on at the same point in Q3
                                                                    2018.

                                                                Source: CSO, DHPLG
                                                                Note: New house guarantee registrations normally issue
                                                                one month before work commences on site.
                                                                Last updated: February 2020 Next update: May 2020
 Figure 3.2 Completions by Region
                                                                Latest developments:

                                                                    Completions in 2019: Dublin 6,991, Kildare, Meath and
                                                                     Wicklow 4,655, ROC 9,595.

                                                                    Home completions in Dublin in 2019 (6,991) increased
                                                                     by 1.8% compared to 2018.

                                                                    In Kildare, Meath and Wicklow completions (4,655)
                                                                     increased by 40.1% in 2019, while the rest of the
                                                                     country (9,595) saw a 23.6% increase in completions.

                                                                Source: CSO
                                                                Last updated: February 2020 Next update: May 2020
 Figure 3.3 Housing Completions by type
                                                                Latest developments:
                                                                  In Dublin, over 50% of housing units completed
                                                                     between 2005 and 2010 were apartments. In 2019,
                                                                     apartments accounted for 38% of total completions in
                                                                     Dublin.
                                                                 In 2019, 57.7% (4,036) of residential units built in Dublin
                                                                    were scheme houses.
                                                                 Outside the Dublin region 43.1% (4,136) of residential
                                                                    units completed in 2019 were individual houses
                                                                    compared with 31% in 2005.
                                                                Definition: "Single House" is where connection is provided to
                                                                separate detached house. "Scheme House" is where connection is
                                                                provided to two or more houses. "Apartments" is where all
                                                                customer metering for the block is centrally located.

                                                                Source: CSO
                                                                Last updated: February 2020 Next update: May 2020

Department of Finance | Housing and Property Sector Chartpack                                                    Page | 9
Figure 3.4 House Commencements, Quarterly
                                                                                                Latest developments:

                                                                                                   26,106 units were commenced in the 12 months to
                                                                                                    September 2019, a 27.6% increase over the year to
                                                                                                    September 2018.

                                                                                                   There is a break in series in February 2014 due to
                                                                                                    change to data collection methodology.

                                                                                                Source: DHPLG
                                                                                                Last updated: November 2019 Next update: February 2020

 Figure 3.5 House commencements by region, Quarterly
                                                                                                Latest developments:

                                                                                                   In Q3 2019, 59.7% of all commencement notices were
                                                                                                    in Dublin and the surrounding commuter counties.

                                                                                                   In the 12 months to September 2019, commencement
                                                                                                    notices in Dublin increased by 22.6% compared to the
                                                                                                    same period in 2018.

                                                                                                   Commencement activity outside of the Greater Dublin
                                                                                                    Region has remained resilient, with activity increasing
                                                                                                    by 32.7% in the 12 months to September 2019
                                                                                                    compared to the same period in 2018.

                                                                                                Source: DHPLG
                                                                                                Last updated: November 2019 Next update: February 2020
 Figure 3.6 Construction Sector Employment
                                        Construction Employment (LHS)                           Latest developments:
                                        Growth Rate (RHS)
             160                                                               25%
                                                                                                   The seasonally adjusted number of people in
             140                                                               20%                  employment in the construction sector in Q4 2019 was
                                                                                                    148,300.
             120
                                                                               15%
             100                                                                                   Construction sector employment in Q4 2019 is 2.2%
 Thousands

                                                                                      y-o-y %

                                                                               10%                  higher than the same period in 2018.
             80
                                                                               5%                   Construction sector employment now accounts for
             60
                                                                                                     6.2% of total employment.
                                                                               0%
             40                                                                                 Note: There have been significant revisions to the
                                                                                                construction sector employment estimates as part of the
             20                                                                -5%
                                                                                                Labour Force Survey replacing the Quarterly National
              0                                                                -10%             Household Survey.
                                                                                                Source: CSO, LFS
                   2012

                          2013

                                 2014

                                           2015

                                                  2016

                                                         2017

                                                                2018

                                                                        2019

                                                                                                Last updated: February 2020 Next update: May 2020

Department of Finance | Housing and Property Sector Chartpack                                                                                  Page | 10
Figure 3.7 Construction Wages Year-on-Year Change
                                                                Latest developments:

                                                                    Wages in the construction sector have increased by
                                                                     4.9% between 2017 and 2018.

                                                                    In comparison wages across all sectors have increased
                                                                     by 2.9% over the same period.

                                                                Source: CSO – Earning Analysis using Administrative Data
                                                                Sources
                                                                Last updated: November 2019 Next update: Q4 2020

 Figure 3.8 Investment
                                                                Latest developments:

                                                                    Investment in the construction of new dwellings stood
                                                                     at €1,346 million in Q3 2019, 27.2% higher than in Q3
                                                                     2018.

                                                                    Investment in new dwellings made up approximately
                                                                     12% of investment in Q3 2019.

                                                                Note: Investment equates to ‘Modified’ Gross Domestic
                                                                Fixed Capital Investment as it removes the distortionary
                                                                impact of R&D-related intellectual property imports and
                                                                aircraft leasing and better captures domestic investment
                                                                activity.

                                                                Source: Quarterly National Accounts, CSO
                                                                Last updated: December 2019 Next update: March 2020
 Figure 3.9 Ulster Bank Purchasing Managers Index (PMI) for the Construction sector
                                                                Latest developments:
                                                                  Construction activity expanded in January with a PMI
                                                                     reading of 50.9.
                                                                  The construction sector began to show an expansion in
                                                                     December after three consecutive months of
                                                                     contraction.
                                                                  Housing activity contracted with a figure of 48 in
                                                                     January, in contrast with an expansion reading of 51.8 in
                                                                     December.

                                                               Methodology:
                                                                This PMI surveys selected companies which provide an
                                                                advance indication of what is happening in the construction
                                                                sector by tracking variables such as output, new orders,
                                                                employment and prices across the construction sector. A
                                                                reading of >50(
Figure 3.10 Planning permissions (new units) by region
                                                                Latest developments:
                                                                  10,590 units were granted planning permission in Q3
                                                                     2019, a 32.1% increase compared with Q3 2018 (8,018).

                                                                   In Q3 2019, 54.7% of the units granted planning
                                                                    permission (5,793) were in Dublin and the Greater
                                                                    Dublin Area (Kildare, Meath and Wicklow).

                                                                   In the Rest of the Country the number of units granted
                                                                    planning permission (4,797) increased by 62.3%
                                                                    compared to Q3 2018.

                                                                Note: Planning permissions based on data for new build units
                                                                only. Figures for extensions and renovations have been
                                                                excluded.

                                                                Source: CSO
                                                                Last updated: December 2019 Next update: March 2020

Department of Finance | Housing and Property Sector Chartpack                                                 Page | 12
Section 4: Property Market Transactions
 Figure 4.1 Quarterly Market Transactions
                                                                Latest developments:
                                                                  Transactions in Q4 2019 were 14,562, a decrease of
                                                                     15.2 per cent nationally compared to Q4 2018.

                                                                   Transactions in Q4 in Dublin were 5,218, a decrease of
                                                                    12.9%. Transactions in Kildare, Meath and Wicklow
                                                                    were 2,092, a decrease of 8.1%, while in the rest of the
                                                                    country transactions were 7,252, a decrease of 18.5%
                                                                    over the same time period.

                                                                Source: CSO RPPI
                                                                Last updated: February 2020 Next update: March 2020
 Figure 4.2 Four Quarter Residential Property Trans.
                                                                Latest developments:

                                                                   At 54,219, transactions increased by 0.4% in the year
                                                                    to Q4 2019.
                                                                   Transactions increased by 1.3% in Dublin, by 7.2% in
                                                                    Kildare, Meath and Wicklow and decreased by 1.9% in
                                                                    the rest of the country.
                                                                   Annual transactions are approximately 2.7% of total
                                                                    housing stock. (3.6% in Dublin, 3.6% KMW and 2.2%
                                                                    ROC).

                                                                Source: CSO RPPI
                                                                Last updated: February 2020 Next update: March 2020
 Figure 4.3 Regional Breakdown of Transactions
                                                                Latest developments:

                                                                   In 2010 Dublin accounted for approximately 35% of all
                                                                    transactions. In Q4 2019, Dublin accounted for 35.8%
                                                                    of all transactions.

                                                                   The chart shows that the regional breakdown of
                                                                    transactions has been relatively steady across all
                                                                    regions of the country since 2010.

                                                                Source: CSO RPPI
                                                                Last updated: February 2020 Next update: March 2020

Department of Finance | Housing and Property Sector Chartpack                                                  Page | 13
Figure 4.4 Proportion of Residential Market Buyers
                                                                Latest Developments:

                                                                     Former owner occupiers represent the largest share
                                                                      of the market, accounting for 39.5% of all
                                                                      transactions in Q4 2019.

                                                                     The share of first-time buyers (FTB) has fallen from
                                                                      over 50% in 2010 to 25.4% in Q4 2019.

                                                                     Non-Household purchasers (e.g. private firms and
                                                                      public sector institutions) accounted for 24.9% of
                                                                      market transactions in Q4 2019.

                                                                Source: CSO RPPI
                                                                Last updated: February 2020 Next update: March 2020
 Figure 4.5 Non-Mortgage Purchasers
                                                                Latest developments:

                                                                    The volume of non-mortgage transactions decreased
                                                                     by approximately 0.5% in the year to Q4 2019
                                                                     compared to the year to Q4 2018.

                                                                    By contrast, the number of mortgage drawdowns for
                                                                     house purchases increased by approximately 7.6% in
                                                                     the year to Q4 2019.

                                                                Source: BPFI, CSO
                                                                Last updated: February 2020 Next update: March 2020

 Figure 4.6 Share of Non-Mortgage Purchasers in Total
 Market Transactions
                                                                Latest developments:

                                                                    Share of non-mortgage purchasers has declined as the
                                                                     number of mortgage drawdowns has gradually
                                                                     increased.

                                                                    Non-mortgage purchasers accounted for
                                                                     approximately 37% of all market transactions in Q4
                                                                     2019 and 39% in all of 2019.

                                                                Source: BPFI, CSO
                                                                Last updated: February 2020 Next update: March 2020

Department of Finance | Housing and Property Sector Chartpack                                                   Page | 14
Section 5: Mortgage Market Activity
 Figure 5.1 No. of Mortgages Drawn Down
                                                                Latest developments:

                                                                   The number of mortgage drawdowns for home
                                                                    purchase in Q4 2019 (9,941) was up by 3.4% over the
                                                                    same period in 2018.

                                                                   Composition of mortgage drawdowns in Q4 2019: FTB
                                                                    52.1%, Movers 26%, Investment 3%, Re-mortgage 12%
                                                                    and Top-up 6.9%.

                                                                   Approximately 64.2% of all mortgages drawn down for
                                                                    purchases were by first-time buyers in Q4 2019.

                                                                Source: BPFI – Data from BPFI member institutions
                                                                estimated to cover over 95% of the mortgage market.

                                                                Last updated: January 2020 Next update: April 2020
 Figure 5.2 Value of Loans Drawn down
                                                                Latest developments:

                                                                   The value of mortgage drawdowns for house purchases
                                                                    in Q4 2019 (€2,332m) increased by 3% compared to
                                                                    the same period in 2018.

                                                                   Composition of all mortgage drawdowns in Q4 2019:
                                                                    FTB 52.9%, Movers 29.4%, Investment 2%, Re-
                                                                    mortgage 12.9% and Top-up 2.9%.

                                                                   Approximately 62.8% of the value of all mortgages
                                                                    drawn down for purchases were by first-time buyers.

                                                                Source: BPFI – Data from BPFI member institutions
                                                                estimated to cover over 95% of the mortgage market.
                                                                Last updated: January 2020 Next update: April 2020

 Figure 5.3 Number of Mortgage Approvals
                                                                Latest developments:

                                                                   The volume of mortgage approvals (9,443) for house
                                                                    purchases in Q4 2019 increased by 5.7% compared to
                                                                    the same period in 2018.

                                                                   First time buyers accounted for 63.2% of mortgage
                                                                    approval for house purchases in Q4 2019.

                                                                Source: BPFI. Data from BPFI member institutions
                                                                estimated to cover over 95% of the mortgage market.
                                                                Last updated: January 2020 Next update: February 2020

Department of Finance | Housing and Property Sector Chartpack                                                Page | 15
Figure 5.4 Value of Mortgage Approvals
                                                                Latest developments:

                                                                   The value of mortgage approvals for house purchases
                                                                    in Q4 2019 (€2,271m) increased by 10.9% compared to
                                                                    the same period in 2018.

                                                                   First Time Buyers (€1,402m) accounted for 61.7% of
                                                                    mortgage approval value for house purchases in Q4
                                                                    2019.

                                                                Source: BPFI. Data from BPFI member institutions
                                                                estimated to cover over 95% of the mortgage market.
                                                                Last updated: January 2020 Next update: February 2020
 Figure 5.5 Mortgage Interest Rates
                                                                Latest developments:

                                                                   The average mortgage interest rate on the stock of
                                                                    outstanding housing loans with original maturity over 5
                                                                    years was approximately 2.5% in December 2019.

                                                                   This figure disguises compositional differences
                                                                    between those on standard variable rates and tracker
                                                                    mortgages.

                                                                Source: Central Bank of Ireland, CSO.
                                                                Last updated: February 2020 Next update: March 2020
 Figure 5.6 Interest Rate on New Housing loans
                                                                Latest developments:

                                                                   The average mortgage interest rate agreed on new
                                                                    housing loans is 2.8%.

                                                                   This is the lowest prevailing rate of interest on new
                                                                    housing loans since the beginning of the data set in
                                                                    2003

                                                                Source: Central Bank of Ireland
                                                                Last updated: February 2020 Next update: March 2020

Department of Finance | Housing and Property Sector Chartpack                                                   Page | 16
Section 6: Mortgage Arrears
Figure 6.1 PDH Mortgage Accounts in Arrears
                                                                Latest developments:

                                                                   742,526 PDH mortgage accounts were held in Ireland at
                                                                    the end of September 2019.

                                                                   8.3% of PDH mortgages were in arrears at the end of
                                                                    September 2019.

                                                                   The number of mortgages in arrears decreased by 4.2% in
                                                                    September 2019 compared to September 2018.

                                                                Source: Central Bank of Ireland
                                                                Last update: January 2020 Next update: May 2020

Figure 6.2 PDH Mortgage Accounts by Days in Arrears
                                                                Latest developments:

                                                                   The number of PDH mortgage accounts in arrears by less
                                                                    than 90 days in September 2019 was 18,284, a decrease of
                                                                    5.4% compared to September 2018.

                                                                   The number of PDH mortgage accounts in arrears over
                                                                    720 days in of September 2019 was 27,892, a decrease of
                                                                    0.4% since September 2018.

                                                                Source: Central Bank of Ireland
                                                                Last update: January 2020 Next update: May 2020
Figure 6.3 Total Mortgage Restructures
                                                                Latest developments:

                                                                • Total outstanding PDH mortgage accounts classified as
                                                                restructured stood at 88,587 at end of September 2019.

                                                                • Arrears capitalisation is the most prominent type of
                                                                mortgage restructure, followed by split mortgage agreements.

                                                                Source: Central Bank of Ireland
                                                                Last update: January 2020 Next update: May 2020

Department of Finance | Housing and Property Sector Chartpack                                                 Page | 17
Figure 6.4 BTL Mortgage Accounts in Arrears
                                                                Latest Developments:

                                                                   The total number of BTL mortgages outstanding stood at
                                                                    106,130 at the end of September 2019.

                                                                   As of September 2019, 16.4% of BTL mortgages were in
                                                                    arrears.

                                                                   The number of BTL mortgages in arrears has decreased by
                                                                    15.4% since September 2018.

                                                                Source: Central Bank of Ireland
                                                                Last update: January 2020 Next update: May 2020
Figure 6.5 BTL Mortgage Accounts by Days in Arrears
                                                                Latest Developments:

                                                                   2,669 BTL mortgages were in arrears less than 90 days in
                                                                    September 2019, a 24.8% decrease on the same period in
                                                                    2018.

                                                                   10,861 BTL mortgage were in arrears more than 720 days
                                                                    in September 2019, a 12.6% decrease over the same
                                                                    period in 2018.

                                                                Source: Central Bank of Ireland
                                                                Last update: January 2020 Next update: May 2020
Figure 6.6 Total BTL Mortgage Restructures
                                                                Latest Developments:

                                                                   As of September 2019, the total number of outstanding BTL
                                                                    mortgages classified as restructured was 14,324, a 24.6%
                                                                    decrease on the same period in 2018.

                                                                   Term extension is now the most common form of
                                                                    restructuring, having overtaken reduced payment since
                                                                    March 2019.

                                                                Source: Central Bank of Ireland
                                                                Last update: January 2020 Next update: May 2020

Department of Finance | Housing and Property Sector Chartpack                                                Page | 18
Tithe an Rialtas. Sráid Mhuirfean Uacht,
     Baile Átha Cliath 2, D02 R583, Éire
     Government Buildings, Upper Merrion Street,
     Dublin 2, D02 R583, Ireland

     T:+353 1 676 7571
     @IRLDeptFinance
     www.gov.ie/finance

Department of Finance | Housing and Property Sector Chartpack   Page | 19
You can also read