Census 2020: The Good, the Bad, the Ugly - ARDA April 16, 2021 @TexasDemography
←
→
Page content transcription
If your browser does not render page correctly, please read the page content below
Census 2020: The Good, the Bad, the
               Ugly

                ARDA
            April 16, 2021

             @TexasDemography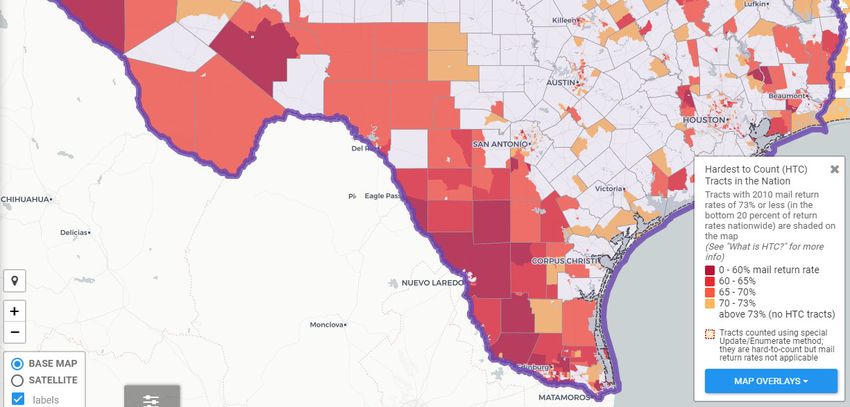
What is the Census?
                      • Every ten years, the country conducts a census to count every person in the
                        United States.
                      • April 1, 2020 is the official Census date.
                      • Census counts used to reapportion the U.S. House of Representatives,
                        determining how many seats each state gets.
                      • Census counts also used to determine the number of electoral college votes
                        a state gets.
                      • Census counts used by state and local officials to redraw congressional,
                        legislative, and local boundaries to account for population shifts.
                      • Businesses rely on Census data for market research, locations, and economic
                        development.
                      • Census derived data are used to allocate over $1.5 trillion in federal funds to
                        support healthcare, education, transportation, or other service programs.*
                      • Census data form the foundation for nearly all demographic and socio-
                        economic statistics, including population estimates & projections, for the next
                        10 years.                                                                   2
*Source: Reamer, Andrew; George Washington Institute of Public Policy, Counting for Dollars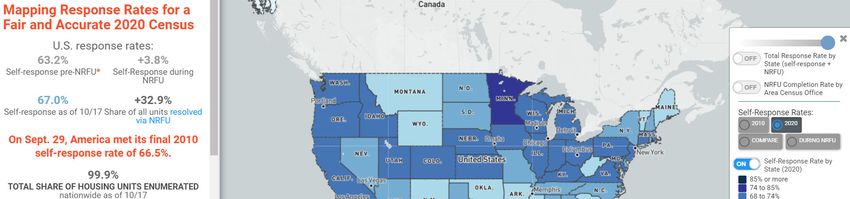
Census Derived Funding in Texas

         In FY 2017, Texas
         received $101 billion in
         federal funding for
         programs that use
         Census derived data.

         $50 billion for Medicare

         $21 billion for Medicaid

         $30 billion for other
         programs.

                                                                                             3
Source: Reamer, Andrew; George Washington Institute of Public Policy, Counting for Dollars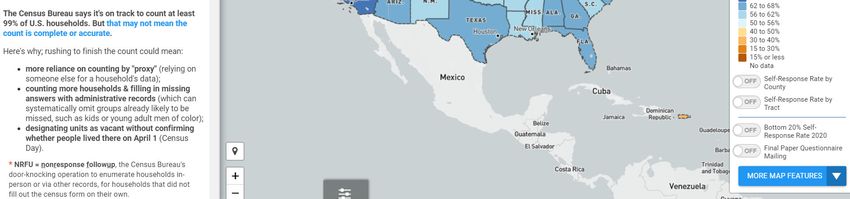
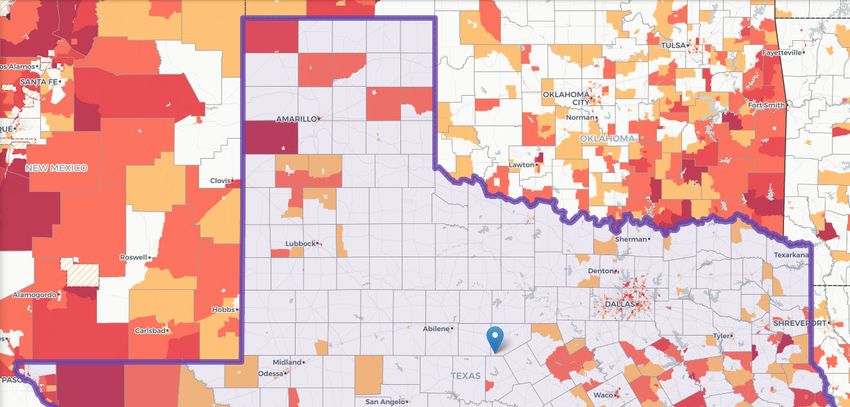
Texas Hard to Count Populations
                                                                                                                        An estimated 7 million, or nearly
                                                                                                                        25% of Texans live in HTC areas.

                                                                                                                        •     People of color
                                                                                                                        •     Children under 5 years
                                                                                                                        •     Populations in/near poverty
                                                                                                                        •     Single-parent households
                                                                                                                        •     Immigrants & those with limited
                                                                                                                              English proficiency
                                                                                                                        •     Complex households: renters,
                                                                                                                              multi-family, mixed status, multi-
                                                                                                                              generation, larger households
                                                                                                                                                             4
Source: Center for Urban Research of the City University of New York (CUNY) Graduate Center. https://www.censushardtocountmaps2020.us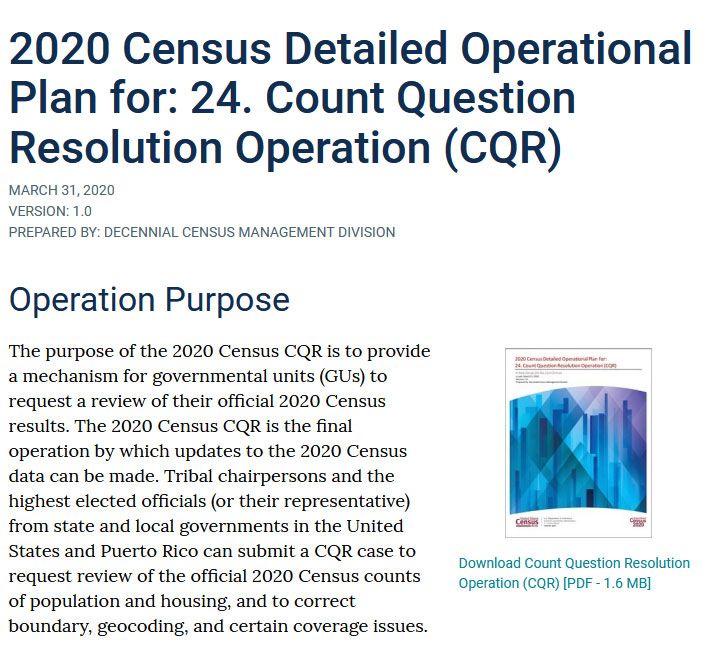
U.S. Response Rates to the 2020 Census

                                                                                                                                         Total Response Rate
                                                                                                                                                   =
                                                                                                                                          Self-Response Rate
                                                                                                                                                   +
                                                                                                                                        NRFU Enumerated Rate

                                                                                                                                                    5
Source: Center for Urban Research of the City University of New York (CUNY) Graduate Center. https://www.censushardtocountmaps2020.us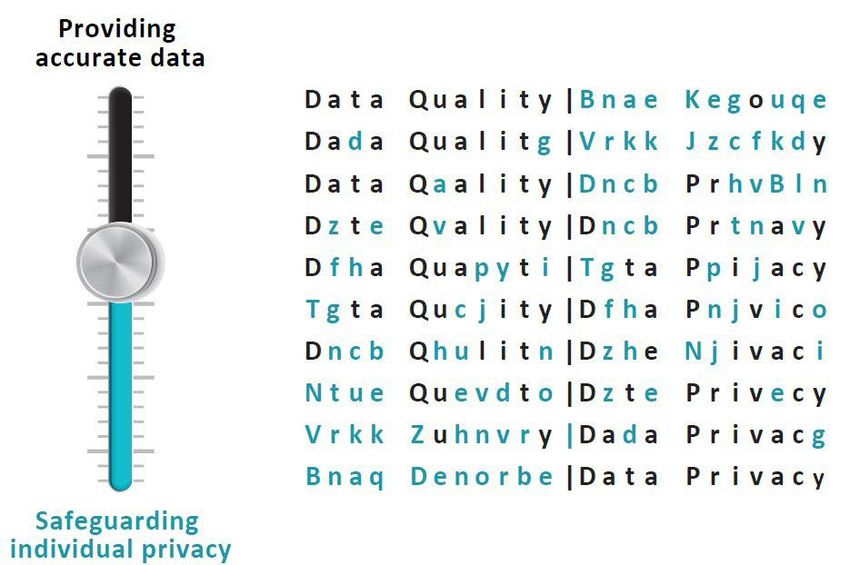
U.S. Response Rates to the 2020 Census

• 99.98% of all housing units and addresses nationwide were
  enumerated.
• 2020 Self-Response Rate of 67.0% surpassed 2010 Self-Response
  Rate of 66.5%.
• 32.9% housing units enumerated through Non-Response Follow-
  Up (NRFU).
• 24.1% of NRFU workload enumerated through proxy (landlord,
  neighbor, etc.).
• 5.6% of address nationwide (13.9% of NRFU workload) resolved
  using administrative records

                                                             6
2020 Census Total Response in Texas

 Total Response Rate
           =
  Self-Response Rate
           +
NRFU Enumerated Rate

Texas Response Rate:

99.9% = 62.8% + 37.1%

                                        7
TDC Analysis of Daily Self-Response Rates (SRR) as of 10/12/20
                                                  Total increase in SRR
                                                  pre-NRFU (July 1st to
                                                  August 8th) = 1.6

                                                  Total increase in SRR
                                                  post-NRFU (August
                                                  9th to present) = 4.4

                                                  In last two weeks,
                                                  Total Response Rates
                                                  in Texas have come
                                                  to a standstill.

                                                  Zero change in SRR
                                                  in 7 of the last 10
                                                  days.

                                                                    8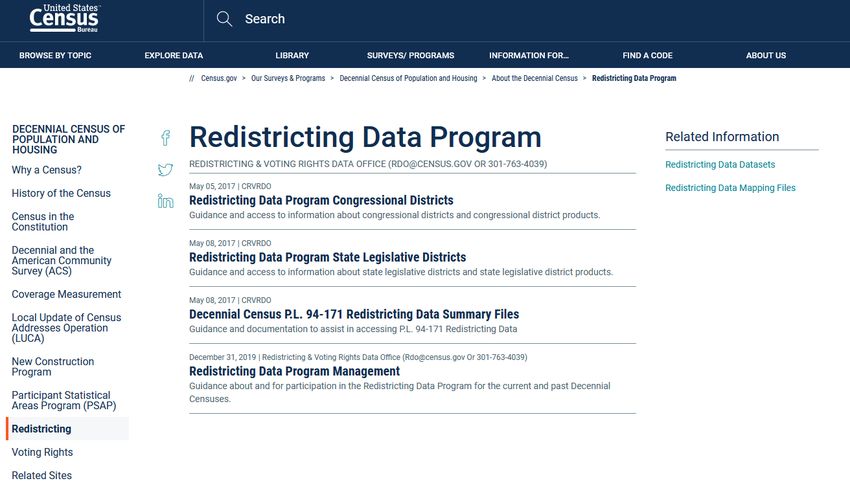
Not all rates are created equal.

Self response rates, total response rates, enumeration rate, NRFU
                         completion rates

What we do know:
• Texas self-response rate lags 2010 rate: 62.0% vs. 64.4%
• Self-response rates vary across the state.
• Enumeration does not mean count.
• Self-response yields the most accurate census data.

                                                               9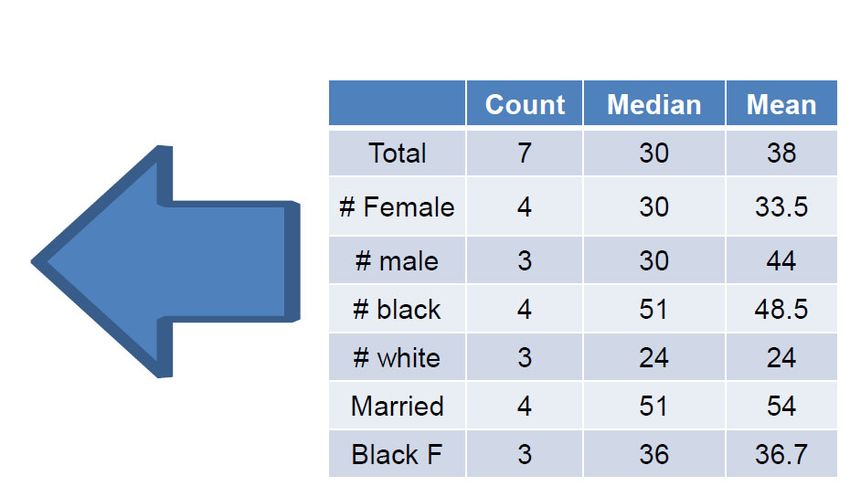
2020 Census Response Across Texas

Self-Response Rates among
Texas Counties ranged from
75.8% in Fort Bend County to
18.6% in Edwards County.

29/254 (11%) Counties met or
surpassed their 2010 SRR.

283/1221 (23%) Places/Cities
met or surpassed their 2010
SRR.

                                    10
TDC Analysis of Census Tracts with Self-Response Rates in Bottom
20% as of 9/28/20
• Texas has 1347 census tracts with self-response rates below 50% (bottom 20%
of self-response rates across all Texas census tracts)
• These lower responding CTs are distributed across the state, in 231 of 254
counties. However, there are more census tracts in the lower NRFU
completion ACOs, specifically Laredo, Fort Bend, Lubbock, and El Paso.
• 47.9% of these CTs have majority (>50%) Hispanic populations and 55.9%
have a greater share of Hispanics than their state share (>40%).
• 5% of these CTs have majority (>50%) African American populations and
35.3% have a greater share of Blacks than their state share (>12%).
• 77.1% of these CTs greater shares than the Texas share of Hispanic and/or
Black populations.
11Census Bureau Data Quality Measures
• Census Coverage Measures: provide undercount by demographic groups,
geography, and method
• Post-Enumeration Survey: interview a small sample of HHs who to check
accuracy of data collected on 2020 census forms (November 2021-February
2022)
• Demographic Analysis: produce population estimates using vital statistics,
estimates of international migration and administrative records (December
2020)
• For more info: https://www.census.gov/newsroom/press-releases/2020/2020-
census-metrics-data-quality-measures.html
• https://www.census.gov/programs-surveys/decennial-
census/about/coverage-measurement.html (2010 Census)
12Areas of Concern
• Communities of color
• Under-represented groups in administrative records
• Areas with low internet access
• Off-campus college students
• Public perception of the Census Bureau and its data
13The Privacy Challenge Every time you release any statistic calculated from a confidential data source you “leak” a small amount of private information. If you release too many statistics, too accurately, you will eventually reveal the entire underlying confidential data source. 1 2020CENSUS.GOV 4
The Census Bureau’s Privacy Protections
Over Time
Throughout its history, the Census Bureau has been at the forefront of the design and
implementation of statistical methods to safeguard respondent data.
Over the decades, as we have increased the number and detail of the data products we
release, so too have we improved the statistical techniques we use to protect those data.

              Stopped          Whole-table            Data                Formal
             publishing
           small area data     suppression          swapping              Privacy

              1930                1970                1990                2020

                                                                                            15
Privacy and Data
Usability
Every disclosure avoidance method reduces the accuracy and
usability of the data.
Traditional methods for protecting privacy (suppression,
coarsening, and perturbation) can have significant impacts on
the usability of the resulting data products, but data users are
often not aware of the magnitude of those effects.
16The Growing Privacy Threat
More Data and Faster Computers!
In today’s digital age, there has been a proliferation of databases that could
potentially be used to attempt to undermine the privacy protections of our
statistical data products.
Similarly, today’s computers are able to perform complex, large-scale
calculations with increasing ease.
These parallel trends represent new threats to our ability to safeguard
respondents’ data.
17Reconstruction
The recreation of individual-level data from tabular or
aggregate data.
If you release enough tables or statistics, eventually there
will be a unique solution for what the underlying individual-
level data were.
Computer algorithms can do this very easily.
18Reconstruction: An Example
Age Sex Race Relationship
66 Female Black Married
84 Male Black Married
30 Male White Married
36 Female Black Married
8 Female Black Single
18 Male White Single
24 Female White Single
This table can be expressed by 164 equations.
Solving those equations takes 0.2 seconds on
13 a 2013 MacBook Pro.Re‐identification
Linking public data to external data sources to re-identify
specific individuals within the data.
Dataset A External Dataset B
Joe Smith Jane Doe
A X
B Y
Person 1 Person 2 Joe Smith Jane Doe
C Z
A X C Z
B Y
C Z
2020CENSUS.GOV
20Differential Privacy
aka “Formal Privacy”
-quantifies the precise amount of privacy risk…
-for all calculations/tables/data products produced…
-no matter what external data is available…
-now, or at any point in the future!
20Assessing Privacy Risk Traditional Disclosure Avoidance Considers Formal Privacy is about Relative Privacy Risk Absolute Privacy Risk Can an individual be re-identified in the data, and can some sensitive Does not directly measure re-identification risk (which requires attribute about them be inferred? specification of an attacker model). Evaluates risk given a particular, defined mode of attack, asking: What Instead, it defines the maximum privacy “leakage” of each release of is the likelihood, at this precise moment in time, of re-identification and information compared to some counterfactual benchmark (e.g., inferential disclosure by a particular type of attacker with a defined set of compared to a world in which a respondent does not participate, or available external information? provides incorrect information). 21
Precise amounts of noise
Differential privacy allows us to inject a precisely calibrated
amount of noise into the data to control the privacy risk of any
calculation or statistic.

23
Privacy vs. Accuracy
Differential Privacy also allows policymakers to
precisely calibrate where on the
privacy/accuracy spectrum the resulting data
will be.

24
Redistricting Dates

• Apportionment File sent to POTUS on 12/31/2020- now by April
  30, 2021
• Redistricting Data File (Public Law 94-171 File) received by the
  Governor no later than April 1, 2021 - now by September 30,
  2021
• PL 94-171 released to states in groups of 8 states per week,
  with one week prior notice
• PL 94-171 File to include:
   • Race, Hispanic origin, 18 and older, occupancy status, and
     group quarters by type.
• Data available at WWW.CENSUS.GOV/RDO

                                                                     25
https://www.census.gov/programs‐surveys/decennial‐census/about/rdo.html 26
https://www.census.gov/newsroom/press‐releases/2020/2020‐census‐quality‐assessments.html 27
https://www.census.gov/programs‐surveys/decennial‐census/2020‐census/planning‐management/planning‐docs/CQR‐detailed‐op‐plan.html

Information on 2010 CQR process:
https://www.census.gov/programs‐surveys/decennial‐census/decade/2010/program‐management/cqr.html
                                                                                                                             28
Lloyd Potter
(210) 458‐6530
Lloyd.Potter@utsa.edu
demographics.texas.gov
@TexasDemography
29You can also read