Henley-on-Thames Community profile of Health and Wellbeing evidence February 2021 - Oxfordshire Insight
←
→
Page content transcription
If your browser does not render page correctly, please read the page content below
Henley-on-Thames
Community profile
of
Health and Wellbeing evidence
February 2021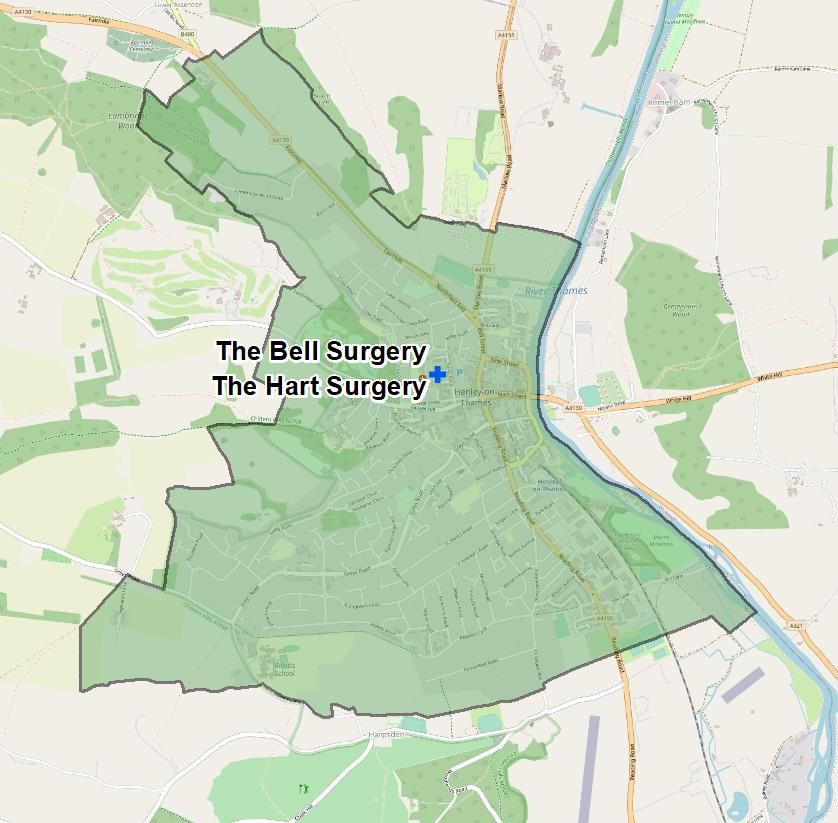
Henley Profile 2021

CONTENTS
1    Summary ............................................................................................................................. 3
2    Geographical boundaries .................................................................................................... 5
3    Population profile ................................................................................................................ 8
    3.1    Population by age ......................................................................................................... 8
    3.2    Ethnicity ........................................................................................................................ 9
    3.3    People living in Communal Establishments .................................................................10
4    Deprivation and Children in poverty ...................................................................................11
    4.1    Indices of Deprivation 2019 .........................................................................................11
    4.2    Child poverty................................................................................................................14
5    Health and wellbeing ..........................................................................................................15
    5.1    Health indicators ..........................................................................................................15
    5.2    Provision of care ..........................................................................................................16
    5.3    Health conditions .........................................................................................................17
    5.4    Physical Activity and Healthy weight ...........................................................................19
6    Other - house prices and commuting data .........................................................................22
ANNEX 1: Data sources for indicators used in ward health profiles .........................................24
ANNEX 2: Data sources used in this report ..............................................................................26

Document revised 9th March 2021 to correct error in the title of table 5 (section 6) showing
house price data

This report provides health and wellbeing evidence from the Oxfordshire Joint Strategic Needs
Assessment (JSNA) for Henley-on-Thames.
Reports and related information for the full Oxfordshire Joint Strategic Needs Assessment is
available on the Oxfordshire Insight website at http://insight.oxfordshire.gov.uk/cms/joint-
strategic-needs-assessment

    Page 2 February 2021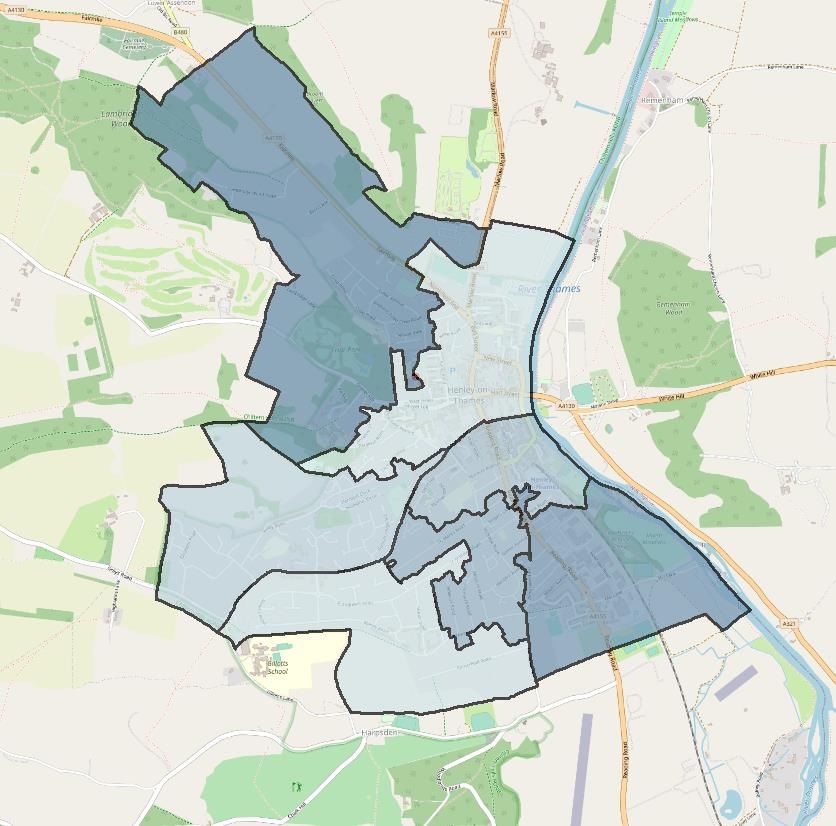
Henley Profile 2021

1 Summary

Population

  •   According to the ONS mid-year population estimates, the population of Henley-on-
      Thames increased from 11,318 in mid-2009 to 11,863 in mid-2019. This growth - over a
      ten-year period – was an apparent increase of 545 people or +5%.
  •   The town has an aging population.
         o Between 2009 and 2019, the population aged 25-44 declined by 17% while the
           number of people aged 70+ increased by 30%.
  •   At the time of the 2011 Census survey, Henley-on-Thames had a higher proportion of
      residents from an ethnic minority (non-white British) background (14%) compared with
      South Oxfordshire district (9%), however this was lower than the averages for
      Oxfordshire (16%) and England (20%).

Deprivation and children in poverty

  •   According to the latest Indices of Deprivation (2019), Henley-on-Thames was relatively
      un-deprived, ranking within the least deprived areas nationally.
  •   According to End Child Poverty estimates 2019, the (old ward) of Henley North had 21%
      of children in poverty after housing costs. The (old ward) of Henley South had 18% of
      children in poverty after housing costs.

Health and wellbeing

  •   Health indicators show Henley-on-Thames as relatively healthy compared with the
      national average.
  •   The town had an above-average proportion of older people living alone (Census 2011).
  •   As of October 2020, there were 7 care homes in Henley-on-Thames ward with 303
      beds.
  •   GP practice data shows:
         o The prevalence of diabetes mellitus recorded by both practices in Henley-on-
           Thames in 2019-20 was well below the national rate and similar to the
           Oxfordshire rate.
         o The prevalence of dementia recorded by both practices in Henley-on-Thames in
           2019-20 was well above the Oxfordshire and England rates.
         o The prevalence of depression was similar to or below (better than) the
           Oxfordshire CCG and England rates.
  •   Levels of adult physical activity were higher than average.
          o According to Sport England’s small area estimates, the proportion of people aged
            16+ in Henley-on-Thames (MSOA) who were physically active at least 150

  Page 3 February 2021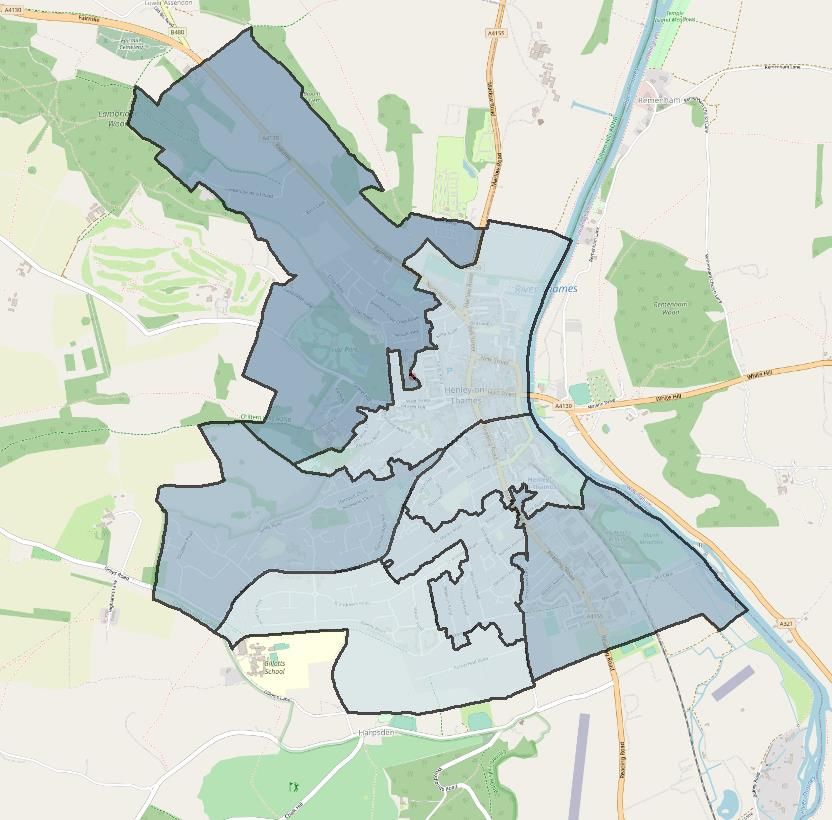
Henley Profile 2021

           minutes a week was just above the district and county rates and above the
           national rate.
 •   The rate of child obesity at the end of primary school was lower than average.
        o The latest data on child obesity from the National Child Measurement
          Programme shows that for reception children (aged 4-5 years), the Henley South
          MSOA was slightly above the district average and below national average with
          overlapping intervals. Data for the Henley North MSOA was not available for the
          latest year. For year 6 children (aged 10-11 years) both Henley North and Henley
          South MSOA were significantly below (better than) the national average.

House prices and commuting

 •   Over the past 5 years (year ending June 2015 to year ending June 2020), median prices
     for semi-detached housing in Henley-on-Thames ward increased at a higher rate than
     South Oxfordshire district and England.
 •   As of the 2011 Census, around 4,854 people living within in Henley-on-Thames ward
     travelled to get to work, of which 1,440 (30%) commuted to jobs elsewhere in Henley-
     on-Thames itself.
 •   The most common other destinations were London (547 commuters), Reading (166
     commuters), Shiplake and Binfield Heath MSOA (154 commuters) and Oxford (118
     commuters).
 •   The most common mode of travel (all destinations) was the car or van (53%), followed
     by walking (20%), train (8%), and passenger in a car/van (2%).

 Page 4 February 2021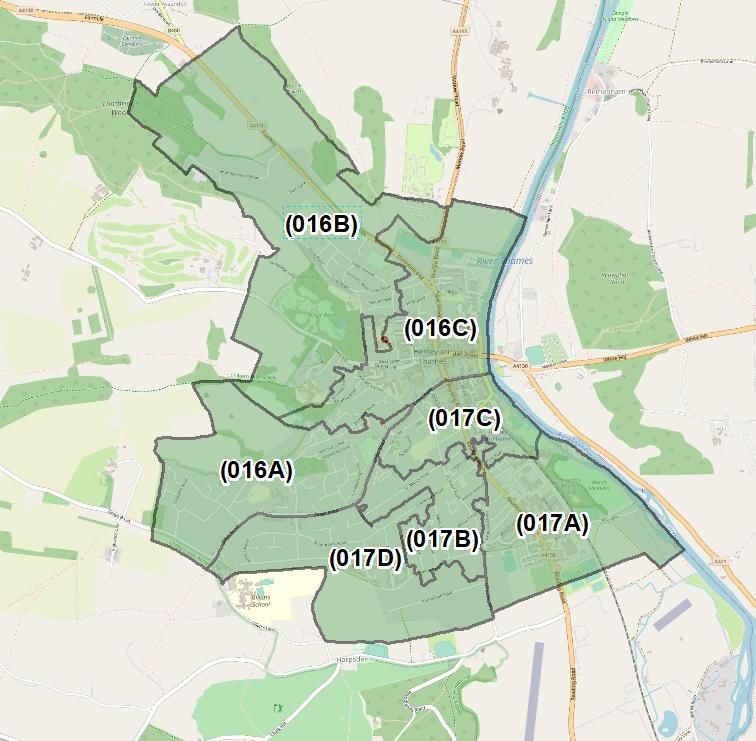
Henley Profile 2021
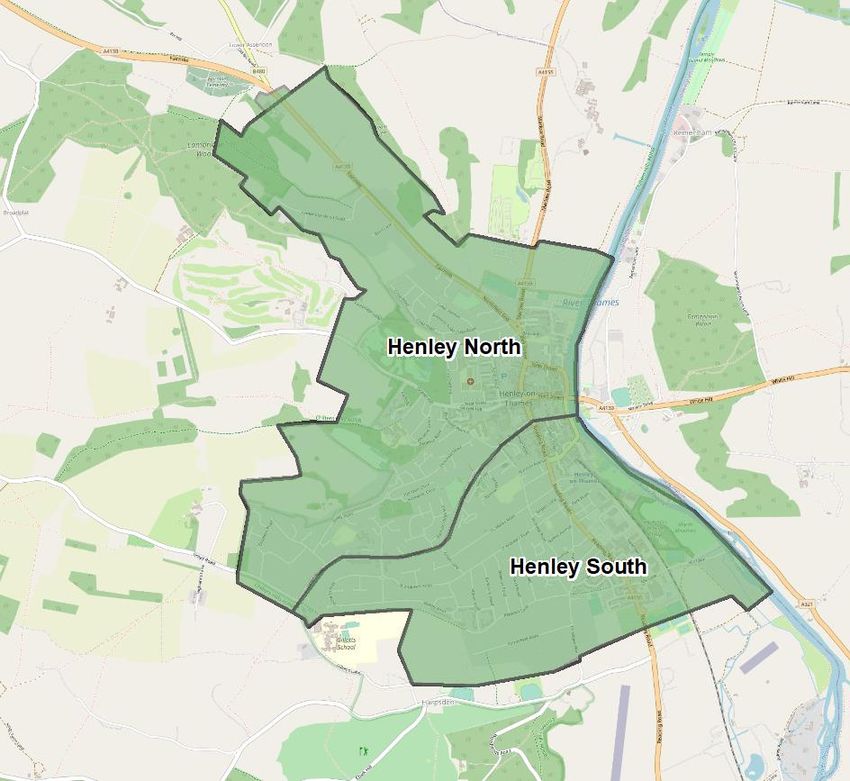
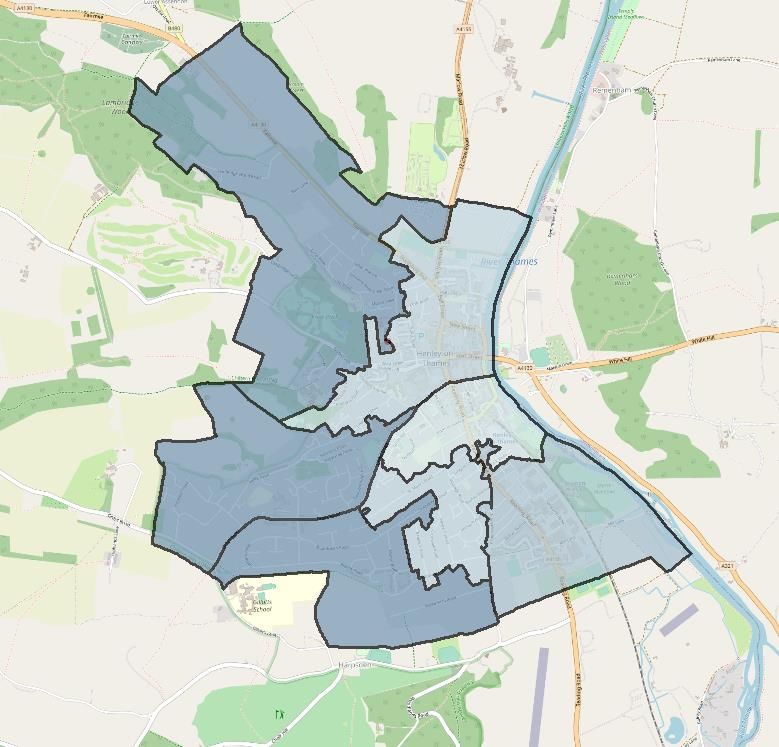
2 Geographical boundaries
Data in this profile is reported using several types of geographical boundaries – administrative
and statistical.
Henley-on-Thames parish
Henley-on-Thames 2013 wards Henley-on-Thames current ward
Maps by Oxfordshire County Council © Crown Copyright and database rights 2019 100023343
Page 5 February 2021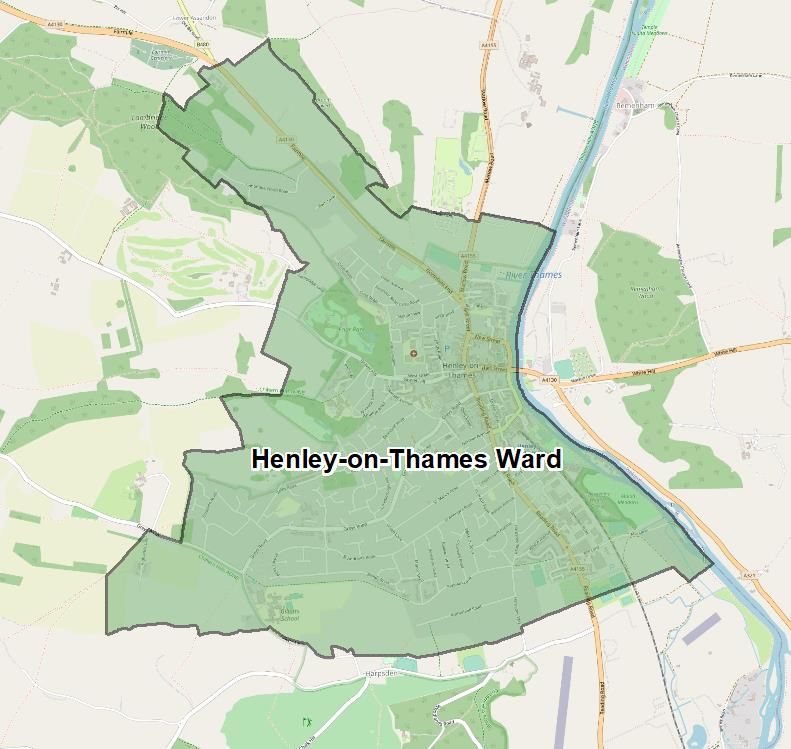
Henley Profile 2021

In addition to these administrative boundaries, National Statistics for small areas are reported
using the statistical hierarchy developed by the Office for National Statistics.
Middle Super Output Areas (MSOAs) are used by ONS to publish Census travel to work data
and an increasing range of other social and demographic statistics.
The MSOAs covering Henley-on-Thames is South Oxfordshire 016 and South Oxfordshire 017
                           MSOA boundaries

Lower Super Output Areas (LSOAs) are used as the geography for publishing the English
Indices of Multiple Deprivation (IMD). In Henley-on-Thames, there is a total of 7 LSOAs.
                           LSOA boundaries

Maps by Oxfordshire County Council © Crown Copyright and database rights 2019 10002334

    Page 6 February 2021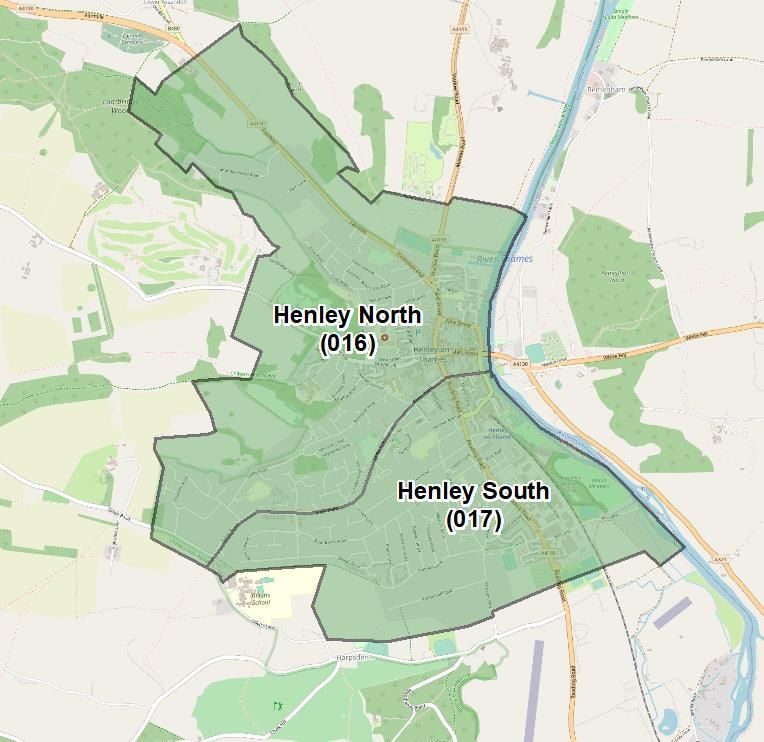
Henley Profile 2021

Each LSOA is made up of smaller Output Areas. The main dataset available at Output Area
level is the Census 2011 and Census 2001 surveys.
GP data
Data on prevalence of health conditions has been extracted from the Quality Outcomes
Framework for the Bell Surgery and The Hart Surgery in Henley-on-Thames.
  GP practice locations

Maps by Oxfordshire County Council © Crown Copyright and database rights 2019 100023343

    Page 7 February 2021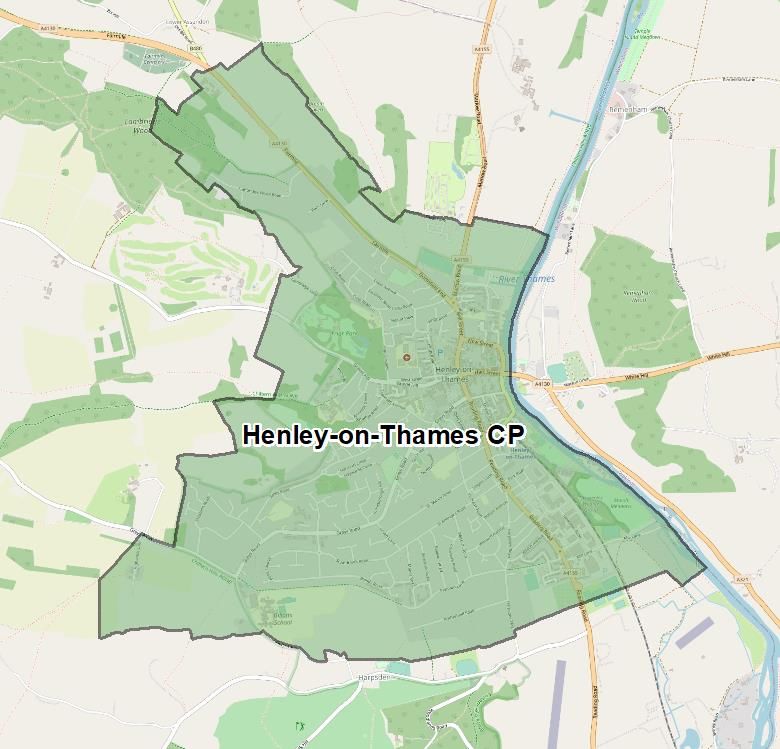
Henley Profile 2021

3 Population profile

3.1 Population by age
According to the ONS mid-year estimates, the population of Henley-on-Thames increased from
11,318 in mid-2009 to 11,863 in mid-2019. This growth - over a ten-year period – was an
apparent increase of 545 people or +5%.
Over this time period, 2009 and 2019, the population of Henley-on-Thames aged 25-44
declined by 17% while the number of people aged 70+ increased by 30%.

Figure 1 Population of Henley-on-Thames by 5-year age band 2009 and 2019

Source: ONS mid-year population estimates for parishes based on best fitting of output areas

   Page 8 February 2021
Henley Profile 2021

In mid-2019, compared with the district, county, regional and national averages, there was a
slightly smaller proportion of people in the younger age group (0-15) in Henley-on-Thames
parish and a higher proportion of older people aged 65+.

Figure 2 Proportion of residents aged 0-15 and 65+ (2019)

Source: ONS mid-year population estimates (Henley-on-Thames parish)

3.2 Ethnicity
At the time of the 2011 Census survey, Henley-on-Thames had a higher proportion of
residents from an ethnic minority (non-white British) background (14%) compared with South
Oxfordshire district (9%), however this was lower than the averages for Oxfordshire (16%) and
England (20%)1.
The largest ethnic minority group in Henley-on-Thames was “White Other” with 946 residents,
followed by “Asian/ Asian British” with 258 residents.
Census 2011 data on country of birth2 shows that the largest groups of non-UK born residents
in Henley-on-Thames were from:
      •   Poland (185 residents)
      •   South Africa (123 residents)
      •   Germany (101 residents)
      •   United States (99 residents)
      •   Australia (90 residents)

1   ONS Census 2011 table KS201; ethnic minority includes all groups other than white British
2   ONS Census 2011 table QS203

      Page 9 February 2021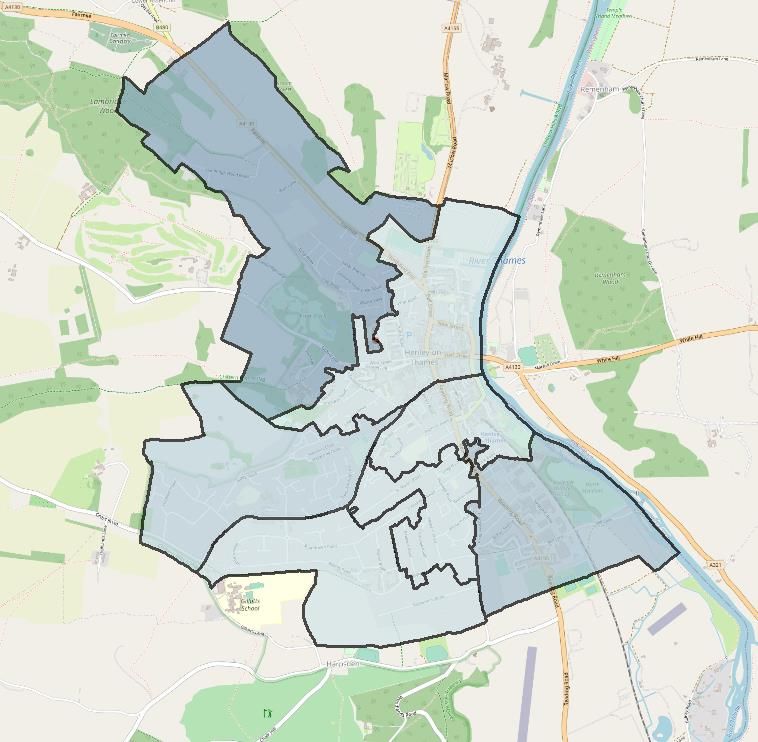
Henley Profile 2021

3.3 People living in Communal Establishments
The most recent data on people living in communal establishments (such as care homes,
boarding schools, halls of residence) is still the 2011 Census.
At the time of the Census 2011 survey, there were 100 people living in Henley-on-Thames
counted as living in a communal establishment out of a total of 11,863 residents (0.84%).
Of the total of 100 people living in Henley-on-Thames living in a communal establishment in
2011:
   •   51 were people in a Care home with nursing and 48 in a care home without nursing.

Table 1 Count of people living in Communal Establishments: Henley-on-Thames parish (2011)
                                              All categories of                   Care home
                                                 Communal         Care home        without
                                               establishment      with nursing     nursing       Other
 South Oxfordshire                                 2,774              880            327          101

 Henley-on-Thames parish                            100               51             48            0

 Henley-on-Thames as % of South Oxfordshire        3.6%              5.7%           14.7%         0%
Source: ONS Census 2011 table QS421UK

  Page 10 February 2021
Henley Profile 2021
4 Deprivation and Children in poverty
4.1 Indices of Deprivation 2019
Indices of Deprivation 2019
The 2019 Indices of Multiple Deprivation (IMD2019) combines measures across 7 domains
and includes supplementary indices of deprivation affecting children and older people.
According to this latest IMD, Henley-on-Thames was relatively un-deprived.
• Four areas of the town rank within the 10% least deprived nationally on the overall IMD
index.
• One area of the town (16B) ranked within the 40% most deprived areas nationally on the
Income, Education and Deprivation affecting Older People domains.
Figure 3 IMD deciles for areas covering Henley-on-Thames (1 is most deprived decile) sorted on
the overall IMD
Barriers to
Education, Housing Living
Employ- skills and and Environ-
LSOA area name IMD Income ment training Health Crime Services ment IDACI IDAOPI
Henley-on-Thames 16A 9 7 8 8 10 9 5 10 7 9
Henley-on-Thames 16B 6 4 5 4 7 9 5 9 5 4
Henley-on-Thames 16C 10 9 10 10 10 5 9 6 9 10
Henley-on-Thames 17A 8 7 6 7 7 9 8 6 7 5
Henley-on-Thames 17B 10 8 9 10 10 9 9 9 9 7
Henley-on-Thames 17C 10 9 10 10 10 9 10 6 9 8
Henley-on-Thames 17D 10 10 10 10 10 10 5 10 10 10
Source: MHCLG English Indices of Deprivation 2019
Numbers = deprivation decile (compared with all areas in England) where 1 = most deprived 10% nationally and
10= least deprived 10% nationally.
IDACI= Income Deprivation Affecting Children Index
IDAOPI= Income Deprivation Affecting Older People Index
Page 11 February 2021Henley Profile 2021
Figure 4 Henley-on-Thames showing deciles of IMD, Barriers to housing and services, IDACI
and IDAOPI (from IMD 2019)
IMD=Indices of Multiple Deprivation
IMD 2019 decile
Barriers to housing and
services decile
Page 12 February 2021Henley Profile 2021
IDACI= Income Deprivation Affecting Children Index
IDAOPI= Income Deprivation Affecting Older People Index
IDACI decile
IDAOPI decile
Maps by Oxfordshire County Council © Crown Copyright and database rights 2019 100023343
Source: MHCLG IMD 2019
To explore deprivation visit our interactive dashboard on Oxfordshire Insight
Page 13 February 2021Henley Profile 2021 4.2 Child poverty According to End Child Poverty estimates for 2019, the old ward of Henley North ward had 21% of children in poverty after housing costs. Henley South ward had 18% of children in poverty after housing costs. Figure 5 Child poverty estimates in South Oxfordshire (old) wards Labelled with % child poverty after housing costs Source: End Child Poverty estimates 2019 Page 14 February 2021
Henley Profile 2021

5 Health and wellbeing

5.1 Health indicators
Health indicators for Henley-on-Thames ward were similar to or better than the England
average with the exception of older people living alone (from Census 2011) where Henley-on-
Thames was significantly worse (i.e. more older people living alone) than the national average.

Figure 6 Health Profile for Henley-on-Thames ward

Source: Public Health England Local Health (downloaded 15 February 2021)

  Page 15 February 2021
Henley Profile 2021

5.2 Provision of care
Care home beds
As of October 2020, there were 7 care homes in Henley-on-Thames ward with 303 beds3.

People providing unpaid care
The most recent data on people providing unpaid care is still the 2011 Census.
At the time of the Census 2011 survey, there were 265 residents of Henley-on-Thames parish
providing a significant number of hours per week (20 or more) of unpaid care.
Overall, the proportion of people providing 20 or more hours per week of unpaid care in
Henley-on-Thames in 2011 was below the county and national averages.

Figure 7 People providing 20 hours or more per week of unpaid care by age as % of resident
population (2011)

Source: ONS Census 2011 table LC3304

3   Source: Care Quality Commission, 2020

     Page 16 February 2021
Henley Profile 2021
5.3 Health conditions
Diabetes
The prevalence of diabetes mellitus recorded by both practices in Henley-on-Thames in
2019-20 was well below the national rate and similar to the Oxfordshire rate.
Table 2 Change in prevalence (ages 17+) of Diabetes mellitus (Quality Outcomes Framework)
2018-19 to 2019-20
2018-19 2018-19 2019-20 2019-20
Count Rate Count Rate change
England 3,265,562 6.94 3,455,176 7.08 +0.14pp
Oxfordshire CCG
30,868 5.05 31,982 5.05Henley Profile 2021
The prevalence of depression recorded by The Bell surgery in Henley-on-Thames was similar
to the Oxfordshire CCG and England rates.
The rate recorded by The Hart Surgery was well below both Oxfordshire CCG and England
rates.
Table 4 Change in prevalence of Depression (Quality Outcomes Framework) 2018-19 to 2019-20
2018-19 2018-19 2019-20 2019-20
Count Rate Count Rate change
England 4,999,672 10.77 5,565,443 11.56 +0.79pp
Oxfordshire CCG
66,656 11.06 73,648 11.81 +0.74pp
The Bell Surgery 705 9.81 787 10.67 +0.85
The Hart Surgery
556 6.60 607 7.17 +0.57pp
Source: NHS Digital, Quality Outcomes Framework, 2019-20
2019-20 rates with a red asterisk indicate a significantly higher rate for a GP practice compared to the national
rate. Green asterisks indicate a significantly lower rate. Tested at a 95% confidence level.
Page 18 February 2021Henley Profile 2021
5.4 Physical Activity and Healthy weight
Physical activity
According to Sport England’s small area estimates4, the proportion of people aged 16+ in
Henley South and Henley North MSOAs who were physically active at least 150 minutes a
week was 77% and 71% respectively, both above the district (69%), county (70%) and national
rates (63%).
Figure 8 Estimated proportion of adults aged 16+ who are physically active at least 150 minutes
a week (November 2018-19), South Oxfordshire MSOAs
Middle Layer Super Output Areas (MSOAs) labelled with names to show the area covered
Source: Sport England Active Lives survey, November 2018-19; map showing MSOAs in Oxfordshire
Note: for Oxfordshire’s local authorities, including South Oxfordshire, the Active Lives survey is completed by a
minimum of 500 respondents, which is 20-30 people per MSOA. This is too few to derive precise direct estimates.
4 https://www.sportengland.org/know-your-audience/data/active-lives/active-lives-data-tables
Page 19 February 2021Henley Profile 2021
Child Obesity
The latest data on child obesity from the National Child Measurement Programme (NCMP, 2
years combined 2017/18 to 2019/20) shows that:
• for reception children (aged 4-5 years), the Henley South MSOA was slightly above the
district average and below national average with overlapping intervals. Data for the Henley
North MSOA was not available for the latest year.
• for year 6 children (aged 10-11 years) both Henley North and Henley South MSOA were
significantly below (better than) the national average.
Figure 9 Prevalence of obesity among children 2017/18 to 2019/20 (showing 95% confidence
intervals)
Reception (aged 4-5 years) Year 6 (aged 10-11 years)
Source: PHE - Fingertips
Page 20 February 2021Henley Profile 2021 Figure 10: Henley-on-Thames MSOAs Year 6 child obesity trend The 3-year average rate of year 6 child obesity in Henley North MSOA appears to have reduced from 10% in 2008/09-2010/11 to 8% in 2017/18-2019/20. The 3-year average rate of year 6 child obesity in Henley South MSOA appears to have reduced from 13% in 2008/09-2010/11 to 10% in 2017/18-2019/20. Source: PHE - Fingertips Page 21 February 2021
Henley Profile 2021

6 Other - house prices and commuting data
Median house prices are very dependent on the mix of housing sold (detached, semi-
detached, terraced, flats). Looking at individual housing types gives a more comparable trend.
Over the past 5 years (year ending June 2015 to year ending June 2020), median prices for
semi-detached housing in Henley-on-Thames ward increased at a higher rate than South
Oxfordshire district and England.

Figure 11 Median price paid for semi-detached dwellings to year ending December 2019 –
Henley-on-Thames ward

Source: ONS House price statistics for small areas to year ending June 2020; quarterly rolling year dataset 37

Table 5 Median price paid for semi-detached dwellings, Year ending June 2015 to year ending
June 2020 – Henley-on-Thames ward
                                  Year ending June 2015 Year ending June 2020                difference
 Henley-on-Thames                         480,000                  600,000             120,000          25%
 South Oxfordshire                        305,000                  354,000              49,000          16%
 England                                  180,000                  220,000              40,000          22%
Source: ONS House price statistics for small areas to year ending June 2020; quarterly rolling year dataset 37

  Page 22 February 2021
Henley Profile 2021 Travelling to work The most recent data on travelling to work is still the 2011 Census. As of the 2011 Census around 4,854 people living within in Henley-on-Thames ward travelled to get to work, of which 1,440 (30%) commuted to jobs elsewhere in Henley-on-Thames itself. The most common other destinations were London (547 commuters), Reading (166 commuters), Shiplake and Binfield Heath MSOA (154 commuters) and Oxford (118 commuters). The most common mode of travel (all destinations) was the car or van (53%), followed by walking (20%), train (8%), and passenger in a car/van (2%). Page 23 February 2021
Henley Profile 2021

ANNEX 1: Data sources for indicators used in ward health profiles
Table 2 Indicators used in ward profiles from Public Health England Local Health (section 5.1)
 Income deprivation - English Indices of Deprivation 2015 (%)                          IMD 2015
 Child Poverty - English Indices of Deprivation 2015 (%)
 Child Development at age 5 (%)                                                        DfE 2014
 GCSE Achievement (5A*-C inc. Eng & Maths) (%)                                         DfE 2013/14
 Unemployment (%)                                                                      ONS from nomis
                                                                                       (last updated 2019)
 Long Term Unemployment (Rate/1,000 working age population)
 Older people living alone (%)                                                         ONS Census 2011
 Older People in Deprivation - English Indices of Deprivation 2015 (%)                 IMD 2015
 Children with excess weight, Reception Year (%)                                       NCMP
 Obese Children, Reception Year (%)                                                    (last updated 2020)

 Children with excess weight, Year 6 (%)
 Obese Children, Year 6 (%)
 Emergency hospital admissions for all causes (SAR)                                    Hospital Episode
                                                                                       Statistics, NHS
 Emergency hospital admissions for CHD (SAR)
                                                                                       Digital
 Emergency hospital admissions for stroke (SAR)                                        (last updated 2019)
 Emergency hospital admissions for Myocardial Infarction (heart attack) (SAR)
 Emergency hospital admissions for Chronic Obstructive Pulmonary Disease (COPD)
 (SAR)
 Incidence of all cancer (SIR / per 100)                                               National Cancer
                                                                                       Registration and
 Incidence of breast cancer (SIR / per 100)
                                                                                       Analysis Services'
 Incidence of colorectal cancer (SIR / per 100)                                        Cancer Analysis
                                                                                       System (last
 Incidence of lung cancer (SIR / per 100)
                                                                                       updated 2019)
 Incidence of prostate cancer (SIR / per 100)
 Hospital stays for self-harm (SAR)                                                    Hospital Episode
                                                                                       Statistics, NHS
 Hospital stays for alcohol related harm (Narrow definition) (SAR)
                                                                                       Digital
 Hospital stays for alcohol related harm (Broad definition) (SAR)                      (last updated 2019)
 Emergency hospital admissions for hip fracture in 65+ (SAR)
 Limiting long-term illness or disability (%)                                          ONS Census 2011
 Back pain prevalence in people of all ages (%)                                        Musculoskeletal
                                                                                       (MSK) Calculator by
 Severe back pain prevalence in people of all ages (%)                                 Imperial College
                                                                                       London for Arthritis

  Page 24 February 2021
Henley Profile 2021
Research UK based
on data from the
Health Survey for
England (HSE)
(last updated 2019)
Life expectancy at birth for males, 2013-2017 (years) Public Health
England from ONS
Life expectancy at birth for females, 2013-2017 (years)
2013-2017
Deaths from all causes, all ages (SMR) (last updated 2019)
Deaths from all causes, under 75 years (SMR)
Deaths from all cancer, all ages (SMR)
Deaths from all cancer, under 75 years (SMR)
Deaths from circulatory disease, all ages (SMR)
Deaths from circulatory disease, under 75 years (SMR)
Deaths from coronary heart disease, all ages (SMR)
Deaths from stroke, all ages, all persons (SMR)
Deaths from respiratory diseases, all ages, all persons (SMR)
Deaths from causes considered preventable (SMR)
Source: Indicator dates available from the ‘Definitions’ section of the Local Health tool on the NHS fingertips
website.
Page 25 February 2021Henley Profile 2021
ANNEX 2: Data sources used in this report
Data sources used in this report
Data Source
Administrative https://geoportal.statistics.gov.uk/
boundaries
Locations of GP Oxfordshire County Council
practices
ONS mid-year https://www.nomisweb.co.uk/
population estimates
(‘Small area by single year of age’ query)
2011 Census: https://www.nomisweb.co.uk/
ethnicity
(Census 2011 ‘KS201EW’ query)
2011 Census: https://www.nomisweb.co.uk/
country of birth
(Census 2011 ‘QS203EW’ query)
2011 Census: https://www.nomisweb.co.uk/
people living in
(Census 2011 ‘QS421UK’ query)
communal
establishments
2019 Indices of https://www.gov.uk/government/statistics/english-indices-of-deprivation-2019
Multiple Deprivation -
(File 1: index of multiple deprivation)
scores
2019 Indices of https://data-communities.opendata.arcgis.com/
Multiple Deprivation -
(Indices of Multiple Deprivation (IMD) 2019 dataset)
maps
2017/18 Child http://www.endchildpoverty.org.uk/poverty-in-your-area-2019/
Poverty Estimates
(‘Local Data’)
2019 PHE Health https://www.localhealth.org.uk/
Indicators
(Indicators > Summary)
2020 numbers of https://www.cqc.org.uk/about-us/transparency/using-cqc-data
care homes and
(‘Care directory with filters)
beds
2011 Census: https://www.nomisweb.co.uk/
people providing
(Census 2011 ‘LC3304EW’ query)
unpaid care
2019/20 Prevalence https://digital.nhs.uk/data-and-information/publications/statistical/quality-and-
of diabetes outcomes-framework-achievement-prevalence-and-exceptions-data
(Prevalence, achievement and personalised care adjustments; High
dependency and other long-term conditions group; GP practice level)
Page 26 February 2021Henley Profile 2021
2019/20 Prevalence https://digital.nhs.uk/data-and-information/publications/statistical/quality-and-
of dementia and outcomes-framework-achievement-prevalence-and-exceptions-data
depression
(Prevalence, achievement and personalised care adjustments; mental health
and neurology group; GP practice level)
2018/19 Sport https://www.sportengland.org/know-your-audience/data/active-lives/active-
England physical lives-data-tables
activity estimates
(Small Area Estimates – Activity Levels Estimates for Middle Super Output
Areas)
Child obesity https://www.gov.uk/government/statistics/child-obesity-and-excess-weight-
small-area-level-data
(Small area NCMP data: MSOA)
House price https://www.ons.gov.uk/peoplepopulationandcommunity/housing/
statistics
bulletins/housepricestatisticsforsmallareas/yearendingdecember2019
(Median house prices by ward: HPSSA dataset 37)
2011 Census: https://www.nomisweb.co.uk/
Travelling to work (Census 2011 ‘QS701EW’ query)
For data and statistics on Oxfordshire and place profiles please visit Oxfordshire Insight
Page 27 February 2021You can also read