ICER Value Framework Overview of Conceptual Elements and Procedures Related to Value Assessment Reports and Appraisal Committee Voting at Public ...
←
→
Page content transcription
If your browser does not render page correctly, please read the page content below
ICER Value Framework
Overview of Conceptual Elements and Procedures
Related to Value Assessment Reports and Appraisal
Committee Voting at Public Meetings

January, 2018

Institute for Clinical and Economic Review
(ICER)
• Independent health technology assessment group

• Develop publicly available value assessment reports
  on medical tests, treatments, and delivery system
  innovations
   • www.icer-review.org

• Convene regional independent appraisal committees
  for public hearings on each report
Appraisal Committees Meet ~ 3x / Year
Guiding Principles

• Rigorous thinking about evidence can prevent
  the kind of waste that strains our ability to
  provide affordable care for all patients.

• Patients and the public should be more involved
  in assessments of value and discussions of how
  to apply evidence across the health system

• Evidence on added benefit, price, and insurance
  coverage
  • Alignment of these represents the grand bargain
    needed to foster innovation and create sustainable
    access to high-value care for all patients
The ICER Value Framework: Purpose • Intended to make transparent how “value” is conceived of and evaluated in ICER reports • Takes a “population” level perspective as opposed to trying to serve as a shared decision-making tool to be used by individual patients and their clinicians • Even with its population-level focus, the ICER value framework seeks to encompass and reflect the experiences and values of patients
What is the conceptualGoal: value framework
  underlying ICER Sustainable
                  reports?    Access
                  to High-Value Care
                                            for All Patients

                Long-Term
                 Value for                                     Short-Term
                  Money                                        Affordability

Comparative Clinical    Incremental cost-                      Potential Budget
  Effectiveness           effectiveness                            Impact

 Other Benefits or        Contextual
  Disadvantages          Considerations
Summary of Key Features of ICER Value Assessment Framework • Anchoring in long-term perspective on value • Foundation in evidence on comparative clinical effectiveness • Acceptance of multiple forms of evidence • Recognition that what matters to patients is not limited to measured “clinical” outcomes • Acknowledgment of the role of contextual considerations in value judgments • Inclusion of information on potential budget impact
ICER report development process: 8 months

• Topic selection
• Scoping phase with Open Input
• Report development x 4 months
• Early feedback of draft results to manufacturers
  and patient groups
• Draft Evidence Report for public comment
• Evidence Report distributed to CEPAC/CTAF
• Public Meeting
• Final Evidence Report with votes, discussion,
  policy roundtable recommendations
Typical 32-week report timeline
 Topic Announcement                      Draft Evidence Report

                                                          Evidence Report

     Draft Scope                                                      Public Meeting

                       Final Scope                                           Final Report

 0       3         7                             21              27     30     32

     = Touchpoints with Patient Groups
Comparative Clinical Effectiveness
• Systematic review of evidence
• Patient groups inform what outcomes are important,
differences across severity, time in disease course,
etc.
• Publicly available material and option for in-
confidence material from manufacturers
• Evidence sought from multiple sources, not just
randomized controlled trials (RCTs)
• Patient groups inform re: opportunities for using or
generating real-world evidence
• Indirect comparisons through network meta-analysis
• Examination of heterogeneity of treatment effect
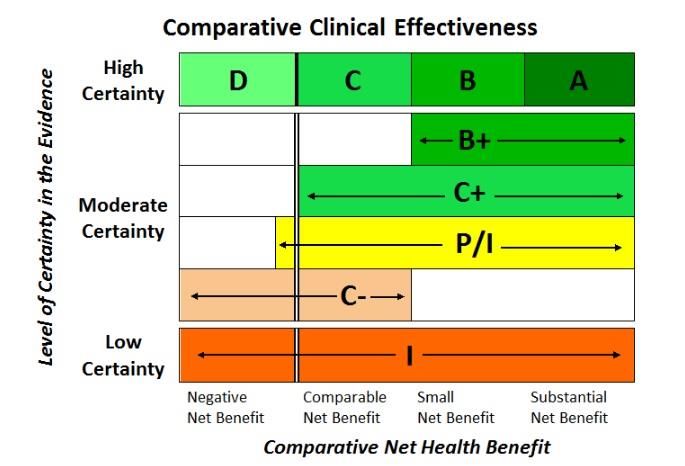
• ICER EBM rating matrix to present prelim judgmentsICER EBM Matrix
11Incremental Cost-effectiveness
• Computer modeling comparing long-term clinical
outcomes and costs for different treatment options
• Costs from health system perspective – all health care
costs
• Costs of drugs from estimates of discounted US prices
• “Societal” perspective analyses presented when feasible
• Standard measures of health outcomes
• Functional improvement, prevented negative outcomes
• Additional life-years gained
• Improvement in quality of life
• Summing these for comparison across treatments:
• Cost per quality-adjusted life year gained (QALY)
Copyright ICER 2016The core measure of health gain for patients: The Quality Adjusted Life Year (QALY) • The QALY is recommended by US and international bodies • A measure of improvement in patients’ lives by measuring years of life weighted by an index of quality of life • Numerical weights: • 1 = perfect health • 0 = dead • Quality of life estimates for different health “states” derived from studies of patients, caregivers, or community members • Sum of quality weight x duration = QALY
Incremental cost-effectiveness ratios

                                      High extra cost
                           Cost ($)   Low gain

   New treatment
   less effective, more costly
                                                Low extra cost
                                                High gain

                                                    Effectiveness
CE threshold

                                      New treatment
                                      more effective, less costly
Cost per QALY Thresholds • Societal “willingness to pay” • WHO and ACC 1-3x per capita GDP • Individual “willingness to pay” • ~2 times annual salary • “Opportunity cost” for the health system • ~1x per capita GDP in UK, Latin America • ICER: $50,000-$150,000 per QALY • Value-based price benchmark $100-$150K/QALY
Potential Other Benefits

• This intervention provides significant direct patient health benefits
  that are not adequately captured by the QALY.
• This intervention offers reduced complexity that will significantly
  improve patient outcomes.
• This intervention will reduce important health disparities across
  racial, ethnic, gender, socio-economic, or regional categories.
• This intervention will significantly reduce caregiver burden.
• This intervention offers a novel mechanism of action or approach
  that will allow successful treatment of many patients who have
  failed other available treatments.
• This intervention will have a significant impact on improving return
  to work and/or overall productivity.
• Other important benefits or disadvantages not otherwise described.

                                                                          16
Contextual Considerations
• This intervention is intended for the care of individuals with a condition of
particularly high severity in terms of impact on length of life and/or quality of
life.
• This intervention is intended for the care of individuals with a condition that
represents a particularly high lifetime burden of illness.
• This intervention is the first to offer any improvement for patients with this
condition.
• Compared to “the comparator,” there is significant uncertainty about the
long-term risk of serious side effects of this intervention.
• Compared to “the comparator,” there is significant uncertainty about the
magnitude or durability of the long-term benefits of this intervention.
• There are additional contextual considerations that should have an
important role in judgments of the value of this intervention.
17Goal:
Sustainable Access
to High-Value Care
for All Patients
Long-Term
Value for Short-Term
Money Affordability
Comparative Clinical Incremental cost- Potential Budget
Effectiveness effectiveness Impact
Other Benefits or Contextual
Disadvantages ConsiderationsPotential Budget Impact Threshold • The purpose is to signal to stakeholders and policy makers when the amount of added health care costs associated with a new service – even one with good long-term value -- may be difficult for the health system to absorb over the short term without displacing other needed services or contributing to rapid growth in health care insurance costs that threaten sustainable access to high-value care for all patients. • Example: Sovaldi for Hepatitis C • NOT A BUDGET CAP!
Potential Budget Impact threshold 2017-2018
NOTE: ICER’s Potential Budget Impact threshold has been updated for
2018-2019 and will be applied to all reviews for which a draft report has
not been published by May 2018. The new thresholds and calculations
are available on the following slide.

                                                2017-2018
   Item               Parameter                                             Source
                                                 Estimate
    1     Growth in US GDP, 2017 (est.) +1%       3.20%               World Bank, 2016
          Total personal medical health care
    2                                          $2.71 trillion          CMS NHE, 2016
          spending
          Contribution of drug spending to                              CMS NHE, 2016;
    3                                             17.7%
          total health care spending                                Altarum Institute, 2014
          Contribution of drug spending to
    4                                          $479 billion      Calculation (Row 2 x Row 3)
          total health care spending
          Annual threshold for net health
    5                                          $15.3 billion     Calculation (Row 1 x Row 4)
          care cost growth for ALL drugs
          Average annual number of new
    6                                              33.5                   FDA, 2016
          molecular entity approvals
          Annual threshold for average cost
                                                  $457.5
    7     growth per individual new                              Calculation (Row 5 ÷ Row 6)
                                                  million
          molecular entity
          Annual threshold for estimated
    8     potential budget impact for each     $915 million     Calculation (doubling of Row 7)
          individual new molecular entity
NEW: Potential Budget Impact threshold 2018-2019
Item Parameter Estimate Source
1 Growth in US GDP, 2018 (est.) +1% 3.5% World Bank, 2018
Total personal medical health care spending, 2017
2 $2.88 trillion CMS NHE, 2018
($)
CMS National
Health Expenditures
Contribution of drug spending to total health care
3 17.0% (NHE), 2018;
spending (%)
Altarum Institute,
2017
Contribution of drug spending to total health care
4 $481 billion Calculation
spending, 2016 ($) (Row 2 x Row 3)
Annual threshold for net health care cost growth for
5 $16.8 billion Calculation
ALL drugs (Row 1 x Row 4)
Average annual number of new molecular entity
6 34 FDA, 2018
approvals, 2016-2017
Annual threshold for average cost growth per
7 $495.3 million Calculation
individual new molecular entity (Row 5 ÷ Row 6)
Annual threshold for estimated potential budget
8 impact for each individual new molecular entity $991 million Calculation
(doubling of Row 7)POTENTIAL BUDGET IMPACT SCENARIOS
$100.00
$90.00
$80.00 Budget
impact
PRICE OF TREATMENT
$70.00 threshold
$60.00
$50.00
$40.00
$30.00
$20.00
$10.00
$0.00
1% 10% 25% 50%
PERCENT UPTAKE AMONG ELIGIBLE PATIENTS AT 5 YEARSPOTENTIAL BUDGET IMPACT SCENARIOS
$100.00
$90.00
$80.00 Budget
impact
PRICE OF TREATMENT
$70.00 threshold
$60.00
Affordability
$50.00 and access
alert
$40.00
$30.00
$20.00
$10.00
$0.00
1% 10% 25% 50%
PERCENT UPTAKE AMONG ELIGIBLE PATIENTS AT 5 YEARSICER value-based price benchmark
Goal:
Sustainable Access
to High-Value Care
for All Patients
?
Long-Term
Value for Short-Term
Money Affordability
ICER Value-
Based Price
BenchmarkICER Reports and Value-Based Pricing
Drug category Discount from Prices After Rebate to Meet
ICER Value-based Price Range
Psoriasis 5%
Multiple sclerosis 25%
Rheumatoid arthritis 15%
Atopic dermatitis 0%
Osteoporosis 50%-80%
TKIs for lung cancer 0%
PD-1s for lung cancer 50%
Abuse-deterrent opioids 40%
Ovarian cancer PARP drugs 50% for maintenance therapyModifications for “Treatments of Ultra-rare
Disorders (URDs)”
• Why any modification?
• Smaller populations and less well known natural
history often leads to more uncertainty in clinical
evidence
• Frequently conditions of children associated with
very high severity
• Questions of whether traditional cost-effectiveness
thresholds provide enough ROI
26Key modifications for treatments of URDs
• Eligible treatments
• Condition/label for less than approximately 10,000 individuals
(higher than EU definition)
• No ongoing or planned clinical trials for patient populations
greater than 10,000
• No explicit change to different “standard” of evidence for
judgments of comparative clinical effectiveness
• Instead, ICER will provide specific context regarding the
potential challenges of generating evidence for these
treatments
• Conducting RCTs
• Validating surrogate outcome measures
• Obtaining long-term data on safety and on the durability of
clinical benefit.
• Commonly used approach of evaluating treatments for
URDs against historical controls will be highlighted.
27Key modifications for treatments of URDs
• Cost-effectiveness thresholds included in the report
expanded from $50,000 per QALY to $500,000 per
QALY
• Value-based price benchmark remains $100-
$150K/QALY but specific language to be included
about decision-makers history of accepting higher
thresholds
• When impact of treatment on benefits and costs
outside the health system are substantial in relation
to health system costs, societal perspective
analyses will be presented in tandem with results
from the health system perspective.
28Key modifications for treatments of URDs
• Broader framework for other benefits and
contextual considerations to reflect potential for
impact on family, school, and community as well
as infrastructure for screening and care of
affected individuals
• Manufacturers invited to supply information on
costs of research and development if they
desire
29Summary
• Same standards for evidence review of clinical
effectiveness but more context provided
• Same approach to cost-effectiveness but
presentation of broader threshold ranges
• Same core list of other benefits and contextual
considerations with some amplification
• Same value-based price benchmark but added
context indicating information on research and
development costs and history of acceptance of
higher prices
30Appraisal Committee meeting process
• CEPAC receives Evidence Report following public
comment period on Draft Evidence Report
• Call with clinical experts 10-14 days before meeting
• Public meeting
• Evidence synopsis on effectiveness and cost-
effectiveness presented by lead reviewer
• Patient representatives and clinical experts available to
comment/respond to questions
• Manufacturer comment
• Patient and public comment
• Discussion and voting on comparative clinical
effectiveness, “other benefits and contextual
considerations”, and value
• Policy Roundtable discussion among key stakeholders
and concluding statements from CTAF/CEPACICER Final Report
• Final report and associated summaries include
• Results of appraisal committee voting with
commentary
• Synopsis of key themes of policy roundtable
discussion
• Policy perspectives and recommendations related to
application of evidence to patient education, clinical
care, insurance coverage, pricing, and future
research needsGoal:
Sustainable Access
to High-Value Care
for All Patients
Long-Term
Value for Short-Term
Money Affordability
Comparative Clinical Incremental cost- Potential Budget
Effectiveness effectiveness Impact
Other Benefits or Contextual
Disadvantages ConsiderationsThank you
You can also read