STATUS AND MANAGEMENT OF THE SOUTH AFRICAN HAKE 2019
←
→
Page content transcription
If your browser does not render page correctly, please read the page content below
STATUS AND MANAGEMENT OF THE SOUTH
AFRICAN HAKE – 2019
Oceana Sustainability Report 2019
Status and Management of South African hake
Stewart Norman and David Japp
Stock status and Catches
The Total Allowable Catch (TAC) in the South African hake fishery is split between four fishing sectors,
with deep-sea and inshore trawl sectors receiving 84% and 6.2% respectively and the longline sector
and handline sector receiving 6.5% and 3.3% respectively. Hake is also caught as bycatch in the
traditional linefish and horse mackerel midwater trawl fisheries.
The trend in the TAC since 2014 has been gradually downwards (Figure 1a) as the Operational
Management Plan (OMP) responded to the indices used to determine the state of the hake stocks.
The hake TAC in 2015 and 2016 was fixed at 147 500 t and implementation of OMP-2014 further
resulted in a decrease of the TAC to 133 119 t in 2017. Driving these changes were low survey and
commercial catch rates for shallow water hake (M. capensis) on the South coast which are being
carefully monitored. Catches of hake over recent decades have typically fluctuated about 150 000 t
per annum (Figure 1b), with most of the catch being landed by the deep-sea trawl sector, and
comprising mainly M. paradoxus.
300 000
(a) M. capensis
250 000 M. paradoxus
TAC
200 000
150 000
100 000
50 000
0
1941
2004
1917
1920
1923
1926
1929
1932
1935
1938
1944
1947
1950
1953
1956
1959
1962
1965
1968
1971
1974
1977
1980
1983
1986
1989
1992
1995
1998
2001
2007
2010
2013
2016
300 000
Handline
(b)
Longline
250 000 Inshore trawl
Deep-sea trawl
200 000
150 000
100 000
1972
1990
2008
1960
1962
1964
1966
1968
1970
1974
1976
1978
1980
1982
1984
1986
1988
1992
1994
1996
1998
2000
2002
2004
2006
2010
2012
2014
2016
2018
Figure 1: (a) Total catches (tons) of Cape hakes split by species over the period 1917 – 2017 and the TAC set each year since
the implementation of the OMP approach in 1991. (b) Catches of Cape hakes per fishing sector for the period 1960 – 2016.
Prior to 1960, all catches are attributed to the deep-sea trawl sector. Figure and caption adapted from Durholtz 2018.12 Merluccius paradoxus
10
GLM CPUE (kg min-1)
The most recent (May 2018) assessment of the hake stocks indicated that the deep-water Merluccius
8
paradoxus and the shallow-water M. capensis were however both above the biomass target reference
point i.e. BMSY. This suggested that OMP-2014, which was designed to return or maintain the stocks at
6
BMSY or greater, depending on the state of the respective stocks, was responding as intended. The
coast- and species-specific nature of the hake assessment model and OMP requires that the
4
commercial hake catches be split by coast and species. Included in the indices used in the OMP are
the catch rates for M. capensis (Figure 2a) and M. paradoxus (Figure 2b). These trends reflect a mostly
2
stable or positive hake stocks.
0
The OMP was revised after a 4-year period during 2018 (OMP-2018) and due to the positive outlook
1978 1983 1988 1993 1998 2003 2008 2013 2018
of the stock it has resulted in a more “aggressive” approach than OMP-14 higher TACs for the same
abundance. The TAC for 2018 and 2019Coast
West was subsequently setCoast
South at 146,431 tons.
10 Merluccius capensis
9
8
GLM CPUE (kg min-1)
7
6
5
4
3
2
1
0
1978 1983 1988 1993 1998 2003 2008 2013 2018
West Coast South Coast
Figure 2a: GLM-standardised deep-sea trawl CPUE (kg.min-1) indices of shallow-water hake abundance
split by west and south coast (Durholtz 2018).12 Merluccius paradoxus
10
GLM CPUE (kg min-1)
8
6
4
2
0
1978 1983 1988 1993 1998 2003 2008 2013 2018
West Coast South Coast
Figure 2b: GLM-standardised deep-sea trawl CPUE (kg.min-1) indices of deep-water hake abundance
10 Merluccius capensis
shown split by coast (Durholtz 2018).
9
8
GLM CPUE (kg min-1)
Management
7
6
In addition to catch limits (TAC or output control), the deep-sea trawl fishery is also controlled by
5
limiting fishing effort (input or TAE control). The “number of fishing days” permitted by trawler
4 is based on the current catch rates (as shown in Figures 2a and 2b) which, with the
operators
permitted
3 catch and vessel power, translates into a sea day (trawling day) allocation. This measure
therefore
2 ensures that in addition to catch limits, effort cannot be exceeded i.e. it mitigates the
potential for misreporting of catch.
1
In South0 Africa the OMP requires that monitoring and re-evaluation are in place to determine whether
1978strategy
the harvest 1983 1988 Essentially,
is working. 1993 the 1998
OMP is2003 2008rule used
the decision 2013 to establish
2018 the TAC,
and its objectives include reference
West points
Coast and management targets within pre-determined rules.
South Coast
Thus, the harvest strategy is responsive to the state of the stock and is designed to achieve stock
management objectives reflected in the (explicit or implicit) target and limit reference points.
Further the OMP-18 for “hake” sets provision for a maximum allowable annual increase in the hake
TAC of 10%, and the maximum allowable annual decrease at 5%. The OMP also has exceptional case
conditions, including responses that may be needed if the biomass estimates fall below designated
Limit Reference Points or LRPs. The OMP also now sets an upper cap on the TAC, so that it cannot
exceed 150 000 t.
The development and revision of recent OMPs takes certification of the SA hake trawl fishery by the
Marine Stewardship Council (MSC) into consideration. Elective effort control measures, which are
voluntarily applied by the industry, are encouraged and strongly supported by the MSC given the
potential weaknesses in the current monitoring systems of the hake fisheries. The fishery was first
certified in 2004, and re-certified on two occasions (2010 and 2015). The fishery will undergo
assessment towards a third re-certification under the new MSC Standard Version 2.1 at the end of
October 2019.Industry-funded research
In addition to the routine research undertaken by DAFF – now the Department of Environment,
Fisheries and Forestry (DEFF), the fishing industry has voluntarily initiated its own investigations in the
interest of better understanding the ecosystem and conservation aspects of the hake fishery.
The Fisheries Conservation Project (FCP) agreement was signed in April 2016 between WWF South
Africa and SADSTIA. This was a three-year project that culminated in positive outcomes for industry
and environmental stakeholders half way through 2019. Outcomes included:
• An improved understanding of the level and nature of discarding in the trawl fishery through
successful installation of cameras on select freezer vessels and analysis of camera footage
and comparison with scientific observer data;
• Updated stock assessments of non-target species retained by the fishery; and
• The development of initiatives for both ongoing monitoring and, where appropriate,
management of non-target species.
The primary aim of the project was to inform the understanding of the main non-target species in the
trawl fishery, specifically angelfish, cape dory, gurnard, horse mackerel, jacopever, kingklip, monk,
octopus, panga, ribbonfish, biscuit skate and snoek. Due to the success of the project the SADSTIA
Executive Committee, the Responsible fisheries Alliance and WWF are in negotiation to develop a
further 5-year FCP to ensure continuity of the progress made by the fishery.
The Benthic trawl experiment is a collaborative effort between DAFF, SAEON, SADSTIA, SANBI and UCT
and is led jointly by Dr Lara Atkinson (SAEON) and Associate Professor Colin Attwood (UCT). The
objective is to monitor the possible recovery of sea-life in fallow trawl lanes. After 5 years of surveys
the results of the experiment are being analysed and recovery trends of benthic communities, shifts
in fish assemblage and an understanding of the recovery rates of the deepsea benthic habitat on which
the fishery operates are being developed.
To ensure Vulnerable Marine Ecosystems (VMEs) are protected going forward SADSTIA developed a
procedure to ring-fence trawl operational areas. This has been implemented by the deepsea and
inshore trawl sectors since 2004 in order to ensure that the fishery only operates in historically trawled
areas, and this has been ingrained in the fishery permit conditions.
The two sectors have also co-operated with DEA and SANBI in the development of offshore MPAs, in
order to protect most of the important habitat types that occur on the continental shelf, without
impacting significantly on fishing operations. As for the VMEs, these requirements with areas’ co-
ordinates will also be implemented in the trawl fishery permit conditions in 2020.
The MSC Standard v2.1 further requires that the impact of trawling on VMEs outside of MPAs be
managed, in order to avoid significant adverse impacts from such activities.
DEFF and more recently SANBI and SADSTIA have been collecting information on the occurrence of
VME species (VME indicator organisms) in such areas within the trawl footprint and have developed
“heat-maps” that show where vessels are most likely to encounter them. We also have good field-
guides and have produced posters that will allow identification of the most common and ecologically
important species. SADSTIA has recently funded a comprehensive literature review on global best-
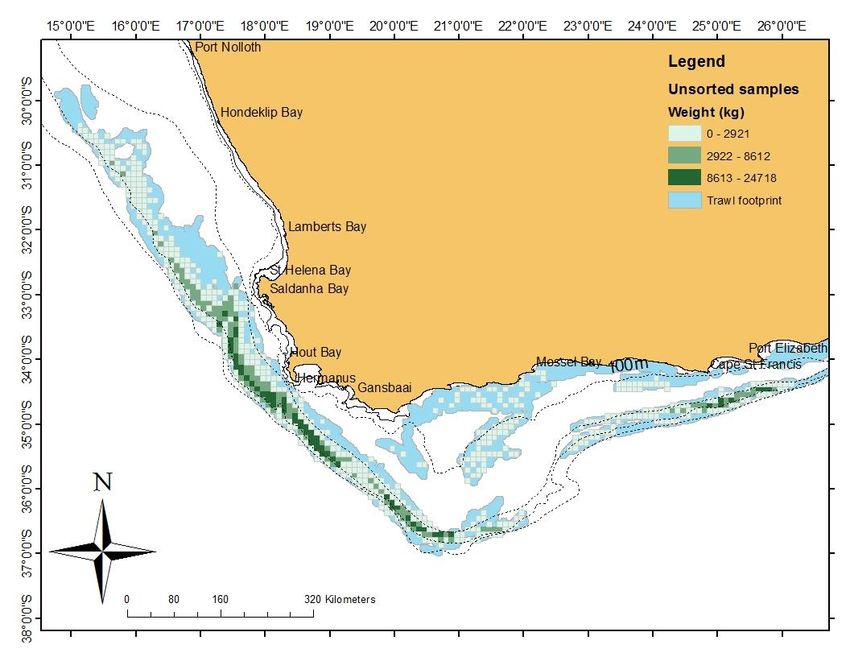
practice responses to VME encounters in order that it may adopt commonly accepted move-on rulesfor the South African bottom-trawl fishery and in so doing meet the MSC Fisheries Certification requirements. Figure 3: Spatial distribution of the observer samples showing total sample weight (kg) of unsorted samples summed per 5 min grid block. The trawl footprint has also been shown. In addition to the FCP project, the SADSTIA observer programme remains the stalwart of data gathering initiatives by collecting information on target species, bycatch and discards in the fishery. The SADSTIA-funded observer programme covers about 40% of trawl fishing grounds (Figure 3) and 10% of the trawl fishing effort. This routine programme was recently revised with the addition of collecting more data on discard species and incorporating into the observer’s mandate, VME data collection procedures. The observers are instructed to sample the length and weight of the unsorted catch, the discarded catch and to record the retained catch information per trawl in order to estimate bycatch rates, absolute bycatch volumes, discard rates and absolute discard volumes for all species of fish caught by the hake trawlers. Observers also monitor interactions with seabirds and marine mammals. Results from this research are included in annual observer programme reports submitted to SADSTIA. References Durholtz, M.D. 2018. An overview of the SA hake fishery. MARAM/IWS/2018/HAKE/BG3. Rademeyer, R.A., Butterworth, D.S., Ross-Gillespie, A. Specifications of the South African Hake 2018 Reference Case Assessment. SADSTIA Announcement Comment Draft Report. Lloyd’s Register. https://fisheries.msc.org/en/fisheries/south- africa-hake-trawl/@@assessments
You can also read