Forecasting severe weather events, more than 24 hours ahead at Météo-France: A plea for a human expertise
←
→
Page content transcription
If your browser does not render page correctly, please read the page content below
Forecasting severe weather events,
more than 24 hours ahead
at Météo-France:
A plea for a human expertise
Introduction
For the short range, typically 24 hours ahead, severe weather forecast procedures have been in effect
for a long time. The French “vigilance” watch map, operational since 2001, puts in concrete form the
primary role of METEO FRANCE in the domain of protection of persons and goods, and has proved
generally successful. Improvements in numerical weather prediction during recent years, now enable a
focus on forecasting dangerous weather phenomena at longer ranges (e.g. within the Medium Range
between D+2 and D+4 – see Figures 1, 2) and beyond the requirements for triggering a “Vigilance”
warning. However, this can’t be just a simple extension of the validity of the vigilance watch map,
because uncertainty generally quickly increases with
the forecast range and makes a deterministic
approach difficult. At present, no specific products are
available for governmental services, media, or general
public for this type of forecast. This article deals with
an experiment that has been conducted at the national
forecast service of METEO FRANCE for 3 years.
There has been much research on forecasting severe or
hazardous weather events, mostly based on the ensem-
ble prediction system (EPS) - see “References”. In
general, the idea is to provide indices or probabilities
according to different severe or abnormal weather
thresholds using sophisticated methods of calibration
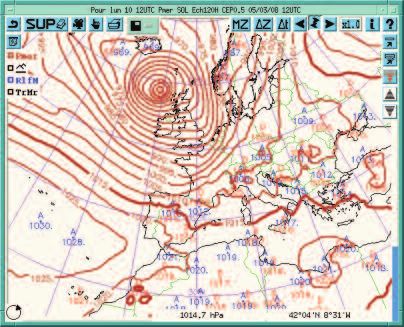
Figure 1: An example of a D+4 forecast by in time and space. The outputs can be displayed in two
the ECMWF model, the storm Johanna on forms: On the one hand, for a given location with the
2008-03-10. time evolution of the distribution of parameters above
severe weather thresholds, and on the other hand, for a
given time or a time-window, with the probabilities
associated with these thresholds on a geographical
area. Accuracy and skill of these forecasts have been
shown but interpretation of these outputs is not often
simple for users who lack any meteorological back-
ground. It’s not easy to provide these users directly
with these kinds of products in a way that can be easily
understood by non-professional meteorologists.
Figure 2: The vigilance watch map,
issued by METEO FRANCE for this day at 6 o’clock
in the morning. Some formalised information could
have been indicated four days ahead…
18 The European Forecaster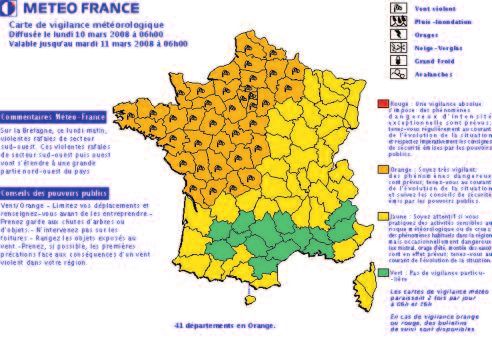
Figure 3: The “web” form filled in by the forecasters each morning.
The example of the D+4 forecast for the cyclone Johanna on 2008-03-10.
Method
In our experiment, the approach used in the vigilance procedure is
retained. For a given geographical area, an estimation of the risk of
dangerous phenomenon occurrence has to be provided for ranges
beyond the period covered by the vigilance watch map, for each given
day, from D+2 to D+4. As it is impractical to work at the scale of the
administrative units (Departments), France is divided into four parts, which are on a spatial scale more
relevant for these forecast ranges. This zoning is as close as possible to the METEO FRANCE regional ser-
vice zoning. Within each zone, a risk index is selected from: no risk (0), unlikely (1), likely (2), certain (3).
The phenomena considered are violent winds, heavy rain, violent thunderstorms and snow/ice. Each morning
since 2005, forecasters have assessed the risk index based on their study of the deterministic models, EPS
products, EFI and so on, and filled in the “web” form (figure 3). It is important to mention that forecasters
are familiar with this system, which has been in use for rare and uncertain events for a long time.
Use and limits
Two aspects must be investigated:
1 - From the forecaster’s point of view, the most important question is this: for each risk index level,
what was the outcome? What percentage of forecasts for each index actually correspond to severe
weather events?
2 - From the user’s point of view, the key issue is this: for the observed conditions, what was the fore-
cast? Is the forecast able to discriminate between events and non-events?
The answers to these questions will lead to the forecast formulation, to put the forecast in a significant
concrete form (the final product) for the decision maker, and to estimate the potential usefulness for him.
The first step was to choose reference or “truth” data about severe weather events. In this study, it is
the colour of the vigilance watch map at the scale of the defined quarters of France. A dangerous
phenomenon depending on the parameter is considered to happen when at least, one department
received an orange or red level within the quarter and day examined.
The best way to investigate the first point is to plot the frequency of occurrence of an event against the fore-
cast risk index, leading to reliability and sharpness diagrams. These are very informative. Some results are
presented in figures 4 and 5. Of course the
season is taken into account depending on
the parameters (eg. snow will never be fore-
cast in the summer!).
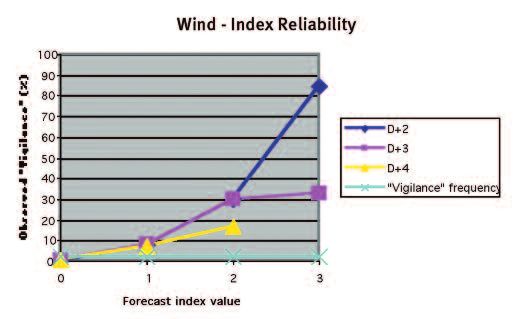
Figure 4:”Reliability” diagram
and “Sharpness” table for the Wind
over all four quarters of France.
For each index level, the rate of observed
“Vigilance” is calculated.
The table gives the number of cases.
The European Forecaster 19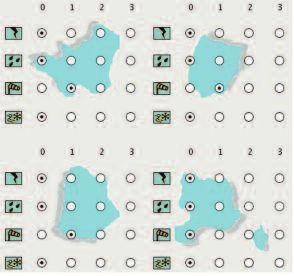
Figure 5: ”Reliability” diagram
                                                                             and “Sharpness” table for Snow-Ice - total
                                                                             of all four quarters of France.

                                                                             The first conclusions which could be
                                                                             drawn are as follows:

                                                                  Sharpness is generally important.
                                                                  Forecasters take risks by choosing high-
                                                                  level index, especially at D+2. At this
                                                                  range, reliability can be considered as
                                                                  excellent with discrimination between the
                                                                  four levels of the index, and a significant
difference from the “climatological” frequency of vigilance. In particular for index 0, the misses (severe
weather events observed but not forecast) are very low, and for index 1, significantly above the average
frequency of severe weather events. Beyond D+2, the discrimination between index 2 and 3 becomes
quickly weak, whereas the discrimination remains much the same for index 0 and 1. We notice as well that
the behaviour of the forecast (slope of curves) varies with the parameter being considered which surprises
forecasters. This is also an opportunity to give them feedback about their own forecast process.

The second point can be synthesized by drawing ROC curves (figure 6, 7, 8), less well known among
the forecasters community than Reliability diagrams but equally useful. Consider the following contin-
gency table:

                                                                        ROC curves plot Hit Rate (HR=Hits/(Hits+
                Forecast
                                                                        Misses), representing the fraction of observed
   Observed

                      Yes            No                  Total          “yes” events correctly forecast) against False
              Yes     Hits           Misses              Observed yes
                                                                        Alarm Rate (FAR= (False alarms+Correct nega-
              No      False alarms   Correct negatives   Observed no
                                                                        tives), representing the fraction of observed
              Total   Forecast yes   Forecast no         TOTAL
                                                                        “No” events incorrectly forecast as “Yes”) for a
                                                                        range of index thresholds (values 1,2,3 together,
                                                                        then 2 and 3 together, and lastly 3 alone).

                                                                         Figure 6: ROC curves for Snow-Ice - total
                                                                        of the four quarters of France.

                                                                           Figure 7: ROC curves for the Wind for the
                                                                                        northwest quarter of France.

                                                                         Figure 8: ROC curves for the Wind for the
                                                                        northeast quarter of France.

 20 The European Forecaster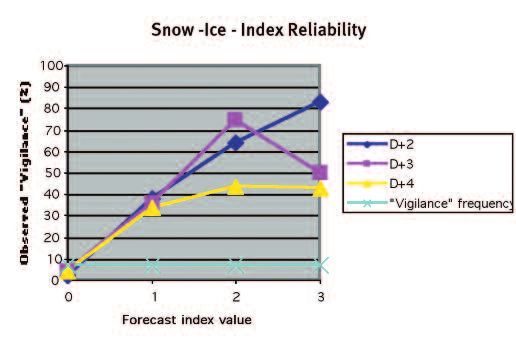
The graphs show clear evidence of skill, in particular for violent wind within the northwest region of
France (points are near the upper-left part of the graph where HR=1, FAR=0). The results are less good
within the northeast region with no discriminating power at D+3 and D+4 (curves near the straight line
HR=FAR), showing large differences at regional scale! In that case, explanation can be found in the
continental character or the smaller scale of phenomena leading to violent winds on the northeast of
France, making the forecast trickier in this area than on the northwest part. This is another chance to
make forecasters aware of these difficulties!
Final product
The idea is simply to provide, in real time, the probabilities corresponding to the reliability of the
chosen index for each parameter (figures 9, 10, 11), taking into account:
- The sample representativeness. Reliability is calculated at the regional scale if the sample size is suffi-
cient, or at scale of France as a whole if the sample size is small.
- The discrimination between indexes. Reliability is calculated for each index if the discrimination is
sufficient, or for a combination of indexes if the discrimination is not sufficient. For example at D+3,
three relevant indexes have to be considered: 0, 1 and, 2 and 3 taken together (Wind and Snow-Ice).
Of Course, these probabilities will be refined as the sample sizes increase. The evolution of the risk
level day after day could be also examined.
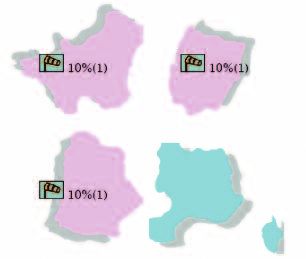
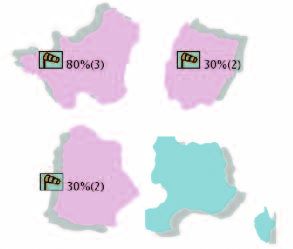
Figures 9, 10, 11: The final product: the production issued for the situation on 2008-03-10, from D+4
(left) to D+2 (right) forecast. These charts daily are available on an internal webpage.
Conclusion
The first results make the forecasters very confident in their capacity to produce relevant information
about severe weather events more than 24 hours ahead, and to draw a decision maker’s attention to the
threat. Despite small sample sizes, the forecast reliability is established and will obviously improve day
by day. Forecasters are now used to systematically discussing the risk index after looking at the nume-
rous EPS products and deterministic models. This experiment gives the opportunity to communicate in
terms of probabilities, the most appropriate way in this case but not the most common at METEO
FRANCE. A trial is due to be held this autumn with a few governmental services in order to evaluate the
potential usefulness of this type of forecast. But some questions from users already show that the pro-
perties of probabilities must be explained. In fact, one still thinks that a probability of 50% corresponds
to the toss of a coin, whereas it’s significantly high when the climatological frequency of the phenome-
non is low. Finally, the most important criticism, which already emerges, concerns the zoning of France
The European Forecaster 21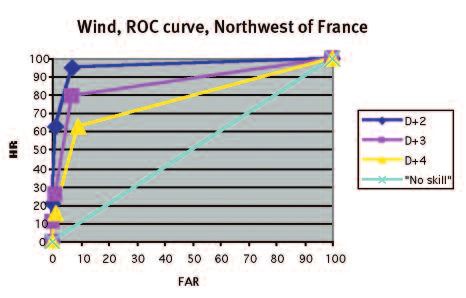
into four parts. We believe that the method remains valid because a decision maker will always be
responsible for a given geographical area and would like quickly to know what might occur within this
area. The zoning has to be then well defined. An example of this principle could be applied with
METEOALARM chart at the scale of European countries.

References
EURORISK Preview Project, 2007, website: http://www.preview-risk.com/

Lalaurette, F., 2002, Early Detection of Abnormal Weather Using a probabilistic Extreme Forecast
Index. ECMWF Technical Memorandum, 373.

T.P. Legg and K.R. Mylne, 2004, Early Warnings of Severe Weather from Ensemble Forecast Information,
Weather and Forecasting.

T.N. Palmer, J. Barkmeijer, R Buizza, E. Klinker and D. Richardson, 2000, The future of ensemble predic-
tion, ECMWF Newsletter, n°88.

Thanks to Bob Owens, recently retired from the Met Office, for reading the paper.

                                                                       Bruno GILLET-CHAULET
                                                                 bruno.gillet-chaulet@meteo.fr

 22 The European Forecaster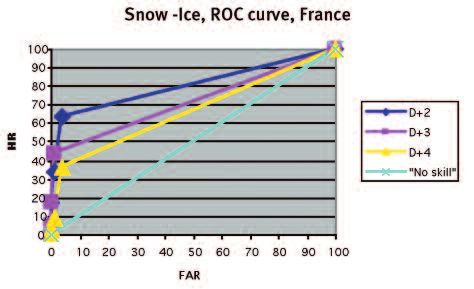
You can also read