Real Money: Option Strategies to Meet Institutional Liabilities - CBOE RMC Europe 2016
←
→
Page content transcription
If your browser does not render page correctly, please read the page content below
Real Money:

Option Strategies to Meet Institutional Liabilities

                 CBOE RMC Europe 2016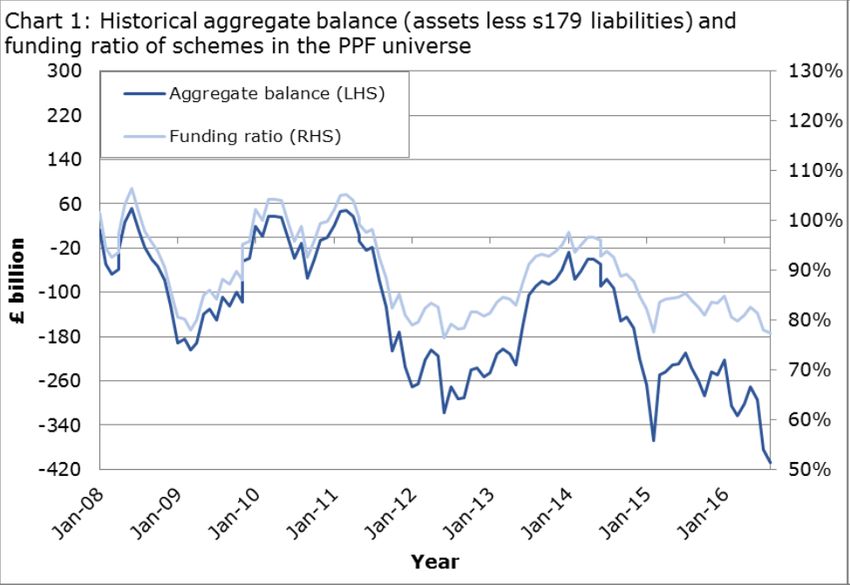
Disclosure
PLEASE READ THE FOLLOWING IN CONNECTION WITH YOUR REVIEW OF THIS PRESENTATION

In general, this disclaimer applies to this document and the verbal or written comments of any person presenting it (collectively the “Presentation”). DGV Solutions LP, taken together
with its affiliates, is referred to herein as “DGV” or “DGV Solutions.” This Presentation is being provided to you at your specific request for informational purposes only and does not
constitute an offer to sell or a solicitation of an offer to buy any security and may not be relied upon in connection with the purchase or sale of any security. Any such offer would be
made only by means of formal offering documents (i.e., the offering memorandum, organizational document and/or agreement and subscription document related to the securities of
the specific investment fund or other vehicle being offered), the terms of which shall govern in all respects. You may not rely on this Presentation as a basis to make an investment
decision.

This Presentation represents the views, opinions and judgments of DGV Solutions as of the date of this Presentation. DGV is not soliciting any action based on this Presentation. This
Presentation should not be viewed as research, nor does this Presentation constitute a personal or other recommendation or take into account your particular investment objective or
financial situation or needs. The economic and market assumptions and forecasts presented herein are DGV estimates and do not guarantee, and are not necessarily indicative of, future
results. DGV’s market and other views, opinions and judgments expressed in this Presentation may change, including in substantial and/or material ways, and DGV is not obligated to
update this Presentation or otherwise notify you of any such changes. Nor is DGV Solutions obligated to provide any update to this Presentation if it is later shown to be inaccurate.

DGV Solutions has not independently confirmed the accuracy of certain information contained in this Presentation, and such information, although believed reliable, is not guaranteed.
This Presentation is being provided in summary fashion and does not purport to be complete. This Presentation is not (and you shall not construe it as) legal, tax, regulatory, investment,
financial or accounting advice. You acknowledge that you are knowledgeable and experienced with respect to the financial, tax and business aspects discussed in this Presentation.

The S&P 500 Index is a well-known, broad based index that is thought be representative of the U.S. stock market as a whole. The CBOE Put-Write Index measures the performance of a
hypothetical portfolio that sells S&P 500 Index put options against collateralized cash reserves held in a money market account. Annualized volatility is the measure of the degree to
which an individual value in a probability distribution tends to vary from the mean of the distribution. Past performance is not indicative of future results.

No chart, graph, or other figure provided should be used to determine which securities to buy or sell, or which investment program to employ. All figures are estimated and unaudited.
Calculations of return and volatility data may vary based on varying time periods and may not be consistent across all presentations. Inaccuracies may exist.

Any “Projections” (projected returns, opinion, predictions or expectation about any future event, calculation of portfolio breakdown) contained in the Presentation are based on a variety
of estimates and assumptions by DGV Solutions. These estimates and assumptions are inherently uncertain and are subject to numerous scenarios that are outside of DGV Solution’s
control. There can be no assurance that the estimates and assumptions made in connection with the Projections will prove accurate, and actual results may differ materially. The
inclusion of the Projections herein should not be regarded as an indication that DGV Solutions considers the Projections to be a reliable prediction of future events, and the Projections
should not be relied upon as such.

DGV’s President, Chief Investment Officer and primary owner serves an a strategic advisor to Jeffrey Slocum & Associates, Inc., an institutional investment consulting firm. This affiliation
creates a potential conflict of interest that prospective clients and/or investors considering DGV or its services or investment funds should understand and evaluate in connection with
any potential investment or engagement.

The Presentation is provided on a confidential basis solely for the information of those persons to whom it is transmitted and is not to be reproduced or used for any other purpose. The
Information contained in this Presentation is strictly confidential. Any reproduction, dissemination or onward transmission of this Presentation, or the information contained herein, is
strictly prohibited.

                                                                                                                                                                                            2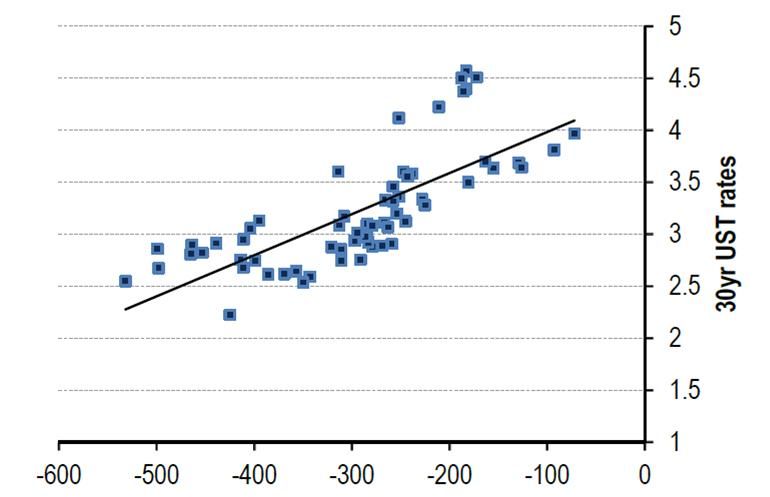
Institutional Liabilities
Pension plans face the tyranny of funded status ratios that
are doubly geared to economic variables
Endowments require high returns to meet spending
objectives but new gifts are highly correlated to risk assets
It is critical to maintain allocations to equities and their high
return expectations to have any chance of meeting liabilities
Option strategies that reduce downside exposure – even at
the expense of upside participation – without reducing
return expectations, better align assets with the overall
enterprise risk/liabilities of the institution
3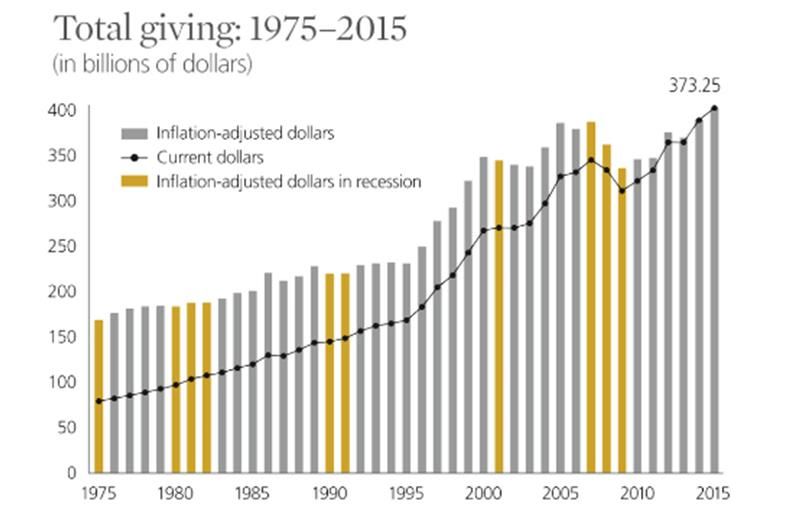
Institutional Liabilities

     Funding Gaps of Top 100 U.S. Corporate Defined Benefit Pension Plans

                                                      Source: BofAML Global Research, Milliman

                                                                                                 4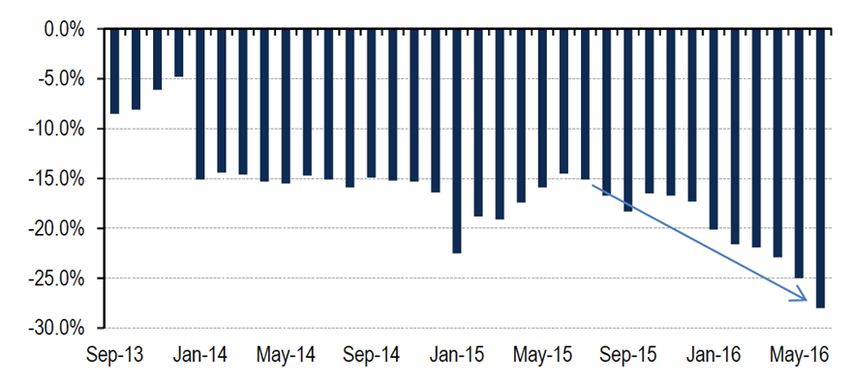
Institutional Liabilities

     Funding Gaps of Top 100 U.S. Corporate Defined Benefit Pension Plans

                                     You are here

                            Funding gaps ($ billions)
                                               Source: BofAML Global Research, Milliman

                                                                                          5
Institutional Liabilities
Pension Plans Covered by the UK Pension Protection Fund
Source: UK Pension Protection Fund
85% of Britain’s 6,000 pension funds covered by the PPF are in deficit.
The total deficit was £408 Billion ($530 Billion) at the end of July.
That represents an increase of £113 Billion since May.
6Sample Pension Distributions
Expected Distribution of Pension Payments ($ millions)
Total Future Payments
(2016 and beyond) = $1,015 million
Payments from the hypothetical plan will change over time as current employees retire,
terminated employees become eligible for payments, and current retirees pass away
The distribution pattern can be estimated as above based on actuarial assumptions (mortality
rates, expected retirement rates, etc.)
7Sample Pension Distributions
Expected Distribution of Pension Payments ($ millions)
Present Value of the future obligations = $534 million
Average Duration of payments = 13 years
Total Future Payments
(2016 and beyond) = $1,015 million
Payments from the hypothetical plan will change over time as current employees retire,
terminated employees become eligible for payments, and current retirees pass away
The distribution pattern can be estimated as above based on actuarial assumptions (mortality
rates, expected retirement rates, etc.)
8Sample Pension Assets
Current Assets Present Value of Liabilities
($400 million) ($543 million)
Funding
Gap 25%
Growth Assets 60% MSCI
ACWI Liability
(Return Seeking)
40%
Barclay’s
Defensive Assets U.S.
(Portfolio Balance) Aggregate
(Liability Hedge) Bond Index
We assume a very simple portfolio of Global Equities and U.S. Investment Grade Bonds
proxied by the MSCI ACWI and the Barclay’s U.S. Aggregate Bond Index
9Sample Pension Funded Status Matrix
Funded Status Ratio
Interest Rate Movements
Return on MSCI ACWI -150bps -100bps -50bps 3.80% +50bps +100bps +150bps
+30% 76% 82% 87% 93% 99% 104% 109%
+20% 70% 76% 80% 87% 93% 98% 103%
+10% 64% 70% 75% 81% 87% 92% 97%
0% 58% 64% 69% 75% 81% 86% 91%
-10% 52% 58% 63% 69% 75% 80% 85%
-20% 46% 52% 57% 63% 69% 74% 79%
-30% 40% 46% 51% 57% 63% 68% 73%
Source: DGV Estimates
The Funded Status of this hypothetical plan currently stands at 75%
Market movements for the growth assets (MSCI ACWI) will positively or negatively affect the
Funded status
Interest rate rises (or declines) will hurt (help) bond exposures in the portfolio (Barclay’s U.S.
Aggregate Bond Index), which have a duration of ~5.5 years
Interest rate rises (or declines) will help (hurt) liability exposures, which have a duration of
~13 years
10Sample Pension Funded Status Matrix
Source: DGV Estimates
Funded Status ratios are sensitive to movements in Global
Equity markets. With no change in interest rates, a +/- 30%
move in equity markets will swing the Funded Status +/- 18%
The Funded Status of this hypothetical plan currently stands at 75%
Market movements for the growth assets (MSCI ACWI) will positively or negatively affect the
Funded status
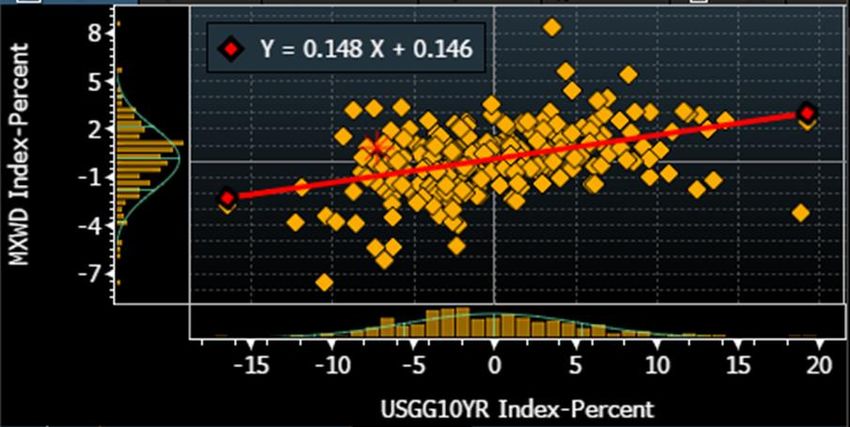
11Equities and Yields
MSCI ACWI versus U.S. 10-Year Treasury Yields
(weekly return regression - 5 years through 8/2/16)
Source: Bloomberg
Global Equities and Bond Yields tend to be positively correlated
A 30% rise in Global Equities would likely correspond to a 100 - 150bp rise in interest rates
12Sample Pension Funded Status Matrix
Source: DGV Estimates
In reality, given the positive correlation between Global
Equities and interest rates, the Funded Status tends to be
extremely volatile. A +/- 30% move in Global Equities may
swing the Funded Status by 69%. A beta greater than 1!
Funded Status ratios can be extremely volatile due to the positive correlation between interest
rates and Global Equities
Investment strategies that provide downside protection in exchange for upside performance
better match institutional liability profiles
13CBOE Put-Write Index
CBOE Put-Write
Annual Returns Index S&P 500 Index
1989 24.57% 31.69%
1990 8.88% -3.10%
1991 21.32% 30.47%
CBOE Put-Write Index 1992 13.80% 7.62%
1993 14.14% 10.08%
1994 7.09% 1.32%
• The Put-Write Index
• Sells 1-month at-the- 1995
1996
16.88%
16.41%
37.58%
22.96%
has produced the
best relative returns
money put options and 1997
1998
27.68%
18.54%
33.36%
28.58% in low return (CBOE Put-Write Index
• In calendar years when the S&P 500 has returned less than +10%
(including negative return years) the CBOE Put-Write Index has
outperformed by an average of 7.8% annually.
S&P 500 Calendar Year Return Regime
(1989-2015)
10%
S&P 500 Index (Observations) -16.64% (5/27) 2.43% (4/27) 6.56% (2/27) 23.42% (16/27)
CBOE Put-Write Index -4.81% 6.60% 11.65% 17.14%
Over/Under Performance 11.83% 4.16% 5.09% -6.28%
Source: Bloomberg; DGV
Past performance relates to the referenced index(es), not any DGV fund or strategy, and does not guarantee, and is not necessarily indicative of, future results.
15New Asset Allocation
Current Assets Present Value of Liabilities
($400 million) ($543 million)
Funding
Gap 25%
Replace Long-Only
60% MSCI ACWI
Growth Assets Equity exposure with Liability
(Return Seeking) Put-Write Equity Put-Write
Strategy
40%
Barclay’s
Defensive Assets U.S.
(Portfolio Balance) Aggregate
(Liability Hedge) Bond Index
Replace Global Equities in the portfolio with an Equity Put-Write strategy.
16Institutional Liabilities
U.S. Charitable Giving
Source: Giving USA Foundation
It is not just pensions that face return challenges and “Enterprise Beta” that is greater than
the market beta of their assets. Charitable giving also declines in periods of recession and
market declines.
17Conclusion
Funded Status ratios are geared to interest rates and growth
assets – factors that tend to be positively correlated
Non-Profits face high return hurdles to meet spending goals
combined with new gifts that are correlated with risk assets
It is critical to maintain equity allocations to have any chance
of meeting liabilities
Option strategies that reduce downside exposure – even at
the expense of upside participation – without reducing
return expectations, better align assets with the overall
enterprise risk/liabilities of the institution
18You can also read