Investor Presentation - July 2018 - Euroz Limited

Page created by Beverly Harmon
 
CONTINUE READING
Investor Presentation - July 2018 - Euroz Limited
Investor Presentation
July 2018
Investor Presentation - July 2018 - Euroz Limited
Company Snapshot

Euroz is a growing and diversified financial services company

                                             Market                               Dividends 11 cps
 Group FUM                                   capitalisation

 $1.46b1                                     $201m1                               52
                                                                                  increase on FY17

   $211m                                                         Cash & investments
                                                                 increasing
   fully franked
   dividends in 18 years                                         $139.4m1
                                A strong platform for future diversification and growth

Note 1: As at 30 June 2018

Investor Presentation – July 2018                                                                    2
Investor Presentation - July 2018 - Euroz Limited
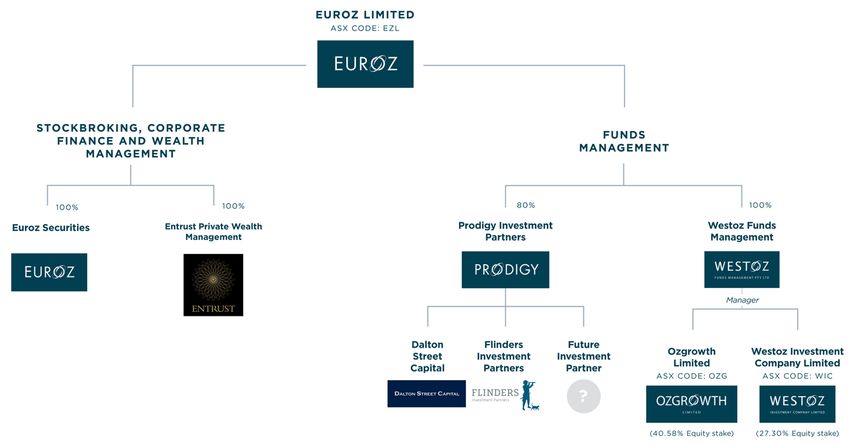
Group Structure

Investor Presentation – July 2018   3
Euroz Limited Ownership

Increasingly diversified share register

                                        Ice Cold
                                      Investments
                                           6%

                                                               Staff ownership of 39%

                     Retail
                                              Institutions     Increasing institutional ownership
                                                  16%

                     39%                                       Improving liquidity

                                                               Performance Rights Plan = ongoing capital
                                             Directors          management
                                               26%
                              Staff
                              13%

                         As at 30 June 2018

                               High staff ownership = strong alignment with shareholders

Investor Presentation – July 2018                                                                           4
Historical Share Price/NTA

Solid NTA growth
     A$
 $3.00
                                                                                Strong balance sheet/zero debt

                                                                                Defensive in difficult markets
 $2.50

                                                                                Historical leverage in good markets

 $2.00                                                                          Western Australia economy and
                                                                                 commodity prices continue to
                                                                                 improve
 $1.50

 $1.00

 $0.50

 $0.00
      2006     2007       2008      2009   2010   2011       2012      2013   2014    2015    2016    2017        2018

                                                     EZL Share Price    NTA

                           Strong balance sheet /increasingly diversified revenue streams

Investor Presentation – July 2018                                                                                        5
Unaudited Full Year Result Highlights

Profitability driven by increases in WIC and OZG share prices, performance fee
income, equity capital markets activity and growth in group FUM

      WIC investment                30.7%               Total performance
      performance                                       fee revenue
                                    OZG investment
       39.1%                        performance         $10.2m

     Euroz Securities               Group FUM up        Net profit after tax
     equity raisings                $1.46b              $31.3m1
     $837m                          21.3%

Note 1: Attributable to members

Investor Presentation – July 2018                                                6
Historical Profitability

Resource markets rebound

  Strong past correlation to resource markets (Small Resources Index)

  Strategy is to generate diverse revenue steams whilst maintaining traditional upside leverage to resource
   markets

                                                                                                                                            XSR

                   $50                                                                                                                      7000

                                                                                                                                                   Small Resources - Index
                                                 $41.9
                   $40
                                                                                                                                            6000

                                                                                                                                $31.3
                                                                                                                                            5000
                   $30
                                                                 $26.3   $26.6                   $26.6
    NPAT (A$m) 1

                                         $22.2                                                                                              4000
                                                                                                                        $19.4
                   $20           $16.8

                                                                                 $11.8
                                                                                                                                            3000
                                                                                         $11.1
                          $9.2                           $10.3
                   $10
                                                                                                                                            2000
                                                                                                                 $3.6

                    $0
                          2005   2006    2007    2008    2009    2010    2011    2012    2013     2014   2015    2016   2017    2018
                                                                                                                                        *   1000

                   -$10                                                                                  -$7.0                              0

                                   Maintain traditional strengths while building new revenue streams

*Unaudited
Note 1: Attributable to members

Investor Presentation – July 2018                                                                                                                                            7
Dividend History

Euroz has paid $211 million fully franked dividends over 18 years

   A$m                       Annual Dividend Paid      Cumulative Dividend paid
220

200

180                                                                                               Past:
160                                                                                                Paid $211m dividends over
                                                                                                    36 consecutive half year
140
                                                                                                    periods
120                                                                                                High payout ratio
100
                                                                                                  Future:
 80
                                                                                                   Aim to increase the base
 60                                                                                                 level of dividends through
                                                                                                    generating recurring
 40                                                                                                 revenue streams
 20

  0
      2001 2002 2003 2004 2005 2006 2007 2008 2009 2010 2011 2012 2013 2014 2015 2016 2017 2018

              Strong dividend history reflects strong cash flow and minimal capital expenditure

Investor Presentation – July 2018                                                                                           8
Stockbroking & Corporate Finance

Euroz Securities - 18 year history of partnering and supporting clients through
research, dealing and corporate finance services
oz Securities
                                     Quality equities research is the foundation of our business
          Research
                                     Highly rated research from our team of six analysts

                                     Institutional advisory and equities dealing services
  Institutional Sales                Team of nine institutional dealers have significant long-term relationships with
                                      major institutional investors

                                     Predominantly high net worth client base
      Private Client
                                     Significant capacity to support new issues/construct first class share registers
         Dealing
                                     Expanded wealth management capabilities

                                     Dominant market position in WA Equity Capital Markets (ECM)
  Corporate Finance
                                     Specialised mergers and acquisitions (M&A) corporate advisory services

    Long term strategy: Leverage deal flow in WA related companies through high quality research,
                               dealing and corporate finance services

Investor Presentation – July 2018                                                                                        9
Wealth Management

Entrust Private Wealth Management - 15 year track record

 Combines its deep knowledge of managed discretionary advice, financial planning and portfolio management with its
  portfolio administration service to create a comprehensive wealth management solution for each individual client

 Euroz acquired Entrust Private Wealth Management (Entrust) in July 2015

 The strategy behind acquiring Entrust was to leverage an established wealth management business with long term
  ongoing revenues as a platform for further acquisitions and organic growth

 Entrust has a significant high net worth client base with Funds Under Management (FUM) of $801m

                                                   Entrust FUM
                                                                                                     $801
           $800                                                                      $777
           $750
                                                                     $713
           $700
                                                     $662
     A$m

           $650

           $600         $575           $581

           $550

           $500
                     31/12/2015     30/06/2016    31/12/2016      30/06/2017      31/12/2017      30/06/2018

   Long term strategy: Grow FUM through organic growth and attracting external wealth advisors to
                                    join our wealth platform

Investor Presentation – July 2018                                                                                  10
Funds Management

Westoz Funds Management – “Finding the Best in the West”

 Westoz Funds Management (WFM) is a 100%-owned subsidiary of Euroz Limited established in 2005
 WFM manages portfolios of Australian equities on behalf of two listed investment companies, Westoz Investment
  Company Limited (WIC) and Ozgrowth Limited (OZG)
 WIC and OZG have contributed $36m in dividend income to Euroz Limited since inception
 WIC and OZG have paid $147m in fully franked dividends to shareholders since inception
 Euroz owns 27.30% of WIC and 40.58% of OZG
 WIC Gross Investment performance of 39.1% for the financial year to 30 June 2018
 OZG Gross Investment performance of 30.7% for the financial year to 30 June 2018

            Westoz Investment Company Limited (ASX:WIC)                                                            Ozgrowth Limited (ASX:OZG)
                           $0.11
           $0.12   $0.10
                                                                                                                        $0.017
                                                                                                      $0.018                              $0.015 $0.015 $0.015
                                           $0.09 $0.09 $0.09
           $0.10                                                                                      $0.016   $0.014
                                                                                                      $0.014
           $0.08
DPS (A$)

                                                                $0.06 $0.06           H2              $0.012                     $0.010

                                                                                           DPS (A$)
                                                                              $0.06
                                                                                                                                                                                        H2
           $0.06                                                                                      $0.010
                                   $0.04                                              H1
                                                                                                      $0.008                                                                            H1
           $0.04                                                                                                                                                 $0.005 $0.005 $0.005
                                                                                                      $0.006
           $0.02                                                                                      $0.004
                                                                                                      $0.002
           $0.00
                                                                                                      $0.000
                   2010    2011    2012    2013   2014   2015   2016   2017   2018
                                                                                                               2010     2011     2012     2013   2014   2015     2016   2017   2018

             Long term strategy: provide a steady base of ongoing management fee
                       revenues with potential performance fee upside

Investor Presentation – July 2018                                                                                                                                                       11
Funds Management

Prodigy Investment Partners – boutique funds management joint venture

 Prodigy Investment Partners (Prodigy) is an 80% owned joint venture between Euroz Limited and former MLC CEO
  Steve Tucker
 The first of these new boutique fund management partnerships was announced in July 2015 with Flinders
  Investment Partners (Flinders) and subsequently Dalton Street Capital (DSC) launched in May 2016
 We continue to search for new investment partners

  Flinders is a specialist small companies investment manager       DSC’s strategy is aimed at giving investors access to strong
   that brings together two of Australia’s most experienced small     uncorrelated absolute returns through different market cycles
   and emerging company investors Andrew Mouchacca (ex -             The strategy has a 12-year track record of producing positive
   Contango Asset Management) and Richard Macdougall (ex -            investment returns over various market cycles
   Perennial Growth)                                                 DSC is headed by Alan Sheen. Before joining Prodigy, Alan
  Flinders has achieved “Investment Grade” rating from Lonsec        worked at Credit Suisse where he was Head of Proprietary
   and an “Approved” rating from Zenith.                              Trading.
  Strong financial year investment performance of 34.2%             DSC has achieved “Superior” fund rating from SQM Research
                                                                      and “Approved” from Zenith.
                                                                     Solid financial year investment performance of 18.3%

       Long term strategy: provide a steady base of diverse ongoing management fee revenues with
                                    potential performance fee upside

Investor Presentation – July 2018                                                                                                     12
Euroz Strategy

Dividend drivers

 The major driver of past dividends have been corporate finance fees (ECM and M&A) and funds management
  performance fees (WIC and OZG)
 ECM and performance fees have typically occurred together in strong resource markets (2007, 2008, 2010, 2011 and
  2018)
DPS (A $)

  $0.30
                                $0.2700

  $0.25

  $0.20               $0.1750                                 $0.1800

   $0.15
            $0.1225                                 $0.1200
                                                                                            $0.1075                                 $0.1100

  $0.10                                                                 $0.0800
                                          $0.0750                                                                         $0.0725
                                                                                  $0.0650
                                                                                                      $0.0500
  $0.05                                                                                                         $0.0400

  $0.00
            2006      2007      2008      2009      2010      2011       2012      2013     2014       2015      2016      2017     2018

  Strategy: Grow the base level of dividends by building more diverse recurring revenue streams while
     maintaining exposure to an increased range of high impact performance and transactional fees

 Investor Presentation – July 2018                                                                                                            13
Euroz Balance Sheet

Improving balance sheet

 Strong balance sheet/zero debt
 Deploying modest capital into Prodigy
 Market Valuation: $54- $62m enterprise value.

                                              Cost    Market    Look through value1
 Westoz                                     $39.0m    $41.4m          $43.6m
 Ozgrowth                                   $27.7m    $26.1m          $31.8m
 Flinders Investment Partners                $7.2m     $8.8m          $8.8m
 Dalton Street Capital                       $5.0m     $5.1m          $5.1m
 Other Investments                           $11.2m   $13.5m          $13.5m
 Cash 2                                     $44.4m    $44.4m          $44.4m
 Total                                     $134.5m    $139.3m        $147.3m
 NTA                                                   $0.77           $0.82

 Market Capitalisation ($1.25/share)3                  $201m          $201m

 Enterprise Value                                      $62m           $54m
Note 1: WIC and OZG valued at NTA
Note 2: Pre dividend
Note3: As at 30 June 2018

Investor Presentation – July 2018                                                     14
Funds Under Management

Strong organic FUM growth from a diverse range of businesses

$1,500                                                                  $1,460m
                                                            $1,403m                                                        WIC ($171m)
                                                                                      Funds Management
$1,250                                          $1,205m                               $359m
                                    $1,143m                                                                                OZG ($81m)

$1,000                  $962m
              $923m                                                                                                        Flinders ($18m)

                                                                                      Entrust Wealth
  $750
                                                                                      Management                           Dalton Street ($89m)

                                                                                      $801m
  $500                                                                                                                     Entrust ($801m)

                                                                                                                           Euroz ($301m)
  $250                                                                               Euroz Securities
                                                                                     Wealth Management
        $-
                                                                                     $301m
             31/12/15   30/06/16    31/12/16    30/06/17    31/12/17    30/06/18

                                                      Group FUM of $1.46 billion

Note:              Precision Funds Management removed from 01/07/2017 as no longer a corporate authorised representative

Investor Presentation – July 2018                                                                                                            15
Group Segment Results
Highlights
  An improved second half (2H) driven by strong ECM activity
  Wealth Management FUM now over $1.1 billion
  Solid Dalton Street Capital FUM growth

                                    Euroz Securities
                                     Positive resource sentiment continues
                                     Strong 2H ECM activity ($837m total raisings)
                                     FUM $301m

                                    Entrust Private Wealth Management
                                     Profitability improving with increased scale
                                     Acquisitions continue to be evaluated
                                     FUM $801m

                                    Westoz Funds Management
                                     Excellent investor returns
                                     WIC 39.1% gross investment performance for FY’18 /FUM $171m
                                     OZG 30.7% gross investment performance for FY’18 /FUM $81m

As at 30 June 2018

Investor Presentation – July 2018                                                                   16
Group Segment Results (cont’d)

                                    Prodigy Investment Partners
                                     Sales team making good inroads into retail platform market
                                     Excellent Dalton Street Capital progress / strong investor engagement
                                     Building good relationships with consultants and platforms
                                     Searching for new investment partners

                                    Flinders Investment Partners
                                     Strong gross investment performance (FY 34.2%)
                                     $18m FUM
                                     Approaching 3 year track record
                                     Zenith and Lonsec research ratings

                                    Dalton Street Capital
                                       Positive consultant & investor engagement
                                       Solid gross investment performance (FY 18.3%)
                                       Zenith and SQM research ratings
                                       Consistent FUM growth to $89m

As at 30 June 2018

Investor Presentation – July 2018                                                                             17
Summary

Euroz is a growing and diversified financial services company

Excellent full                      WA economy &
                                                        Group FUM up
year result and                     commodity           $1.46b
dividend                            prices
                                    improving            21.3%

A robust &                                              Established track
growing balance                     Diversification     record provides
sheet                               strategy            solid platform
                                                        for growth

Investor Presentation – July 2018                                       18
Disclosure

Disclaimer & Disclosure
Euroz Limited (EZL) and its related entities and each of their respective directors, officers and agents (together the Disclosers) have prepared
the information contained in these materials in good faith. However, no warranty (express or implied) is made as to the accuracy, completeness
or reliability of any statements, estimates or opinions or other information contained in these materials (any of which may change without
notice) and to the maximum extent permitted by law, the Disclosers disclaim all liability and responsibility (including, without limitation, any
liability arising from fault or negligence on the part of any or all of the Disclosers) for any direct or indirect loss or damage which may be
suffered by any recipient through relying on anything contained in or omitted from these materials. This information has been prepared and
provided by Euroz Limited. To the extent that it includes any financial product advice, the advice is of a general nature only and does not take
into account any individual’s objectives, financial situation or particular needs. Before making an investment decision an individual should
assess whether it meets their own needs and consult a financial advisor. Past performance is not an indication of future performance.
Note, all figures are expressed in Australian dollars unless otherwise stated.

Investor Presentation – July 2018                                                                                                             19
Thank you

Euroz Limited
Level 18 Alluvion
58 Mounts Bay Rd
Perth Western Australia 6000

euroz.com
You can also read