2021 Economic Outlook: Cadillac/Wexford County - A presentation to Cadillac Area Chamber of Commerce

 
CONTINUE READING
2021 Economic Outlook: Cadillac/Wexford County - A presentation to Cadillac Area Chamber of Commerce
2021 Economic Outlook:
Cadillac/Wexford County

A presentation to
Cadillac Area Chamber of Commerce

Jim Robey, PhD
W.E. Upjohn Institute for Employment Research

February 16, 2021
2021 Economic Outlook: Cadillac/Wexford County - A presentation to Cadillac Area Chamber of Commerce
W.E. Upjohn Institute for Employment Research

The Institute is an activity of the W.E. Upjohn Unemployment Trustee Corporation,
which was established in 1932 to administer a fund set aside by Dr. W.E. Upjohn,
founder of the Upjohn Company.

MISSION:
The W.E. Upjohn Institute for Employment Research is a private, nonprofit,
nonpartisan, independent research organization devoted to investigating the
causes and effects of unemployment, to identifying feasible methods of insuring
against unemployment, and to devising ways and means of alleviating the distress
and hardship caused by unemployment.

 2/19/2021                     Source: REMI, RSQE, and Upjohn Institute       2
2021 Economic Outlook: Cadillac/Wexford County - A presentation to Cadillac Area Chamber of Commerce
REMI Forecasts

National Economy
2021 Economic Outlook: Cadillac/Wexford County - A presentation to Cadillac Area Chamber of Commerce
The COVID-19 pandemic has hit the economy similarly to
the Spanish Flu of 1918              4

                                                                     Manufacturing Employment in Selected States in 2020
                                                        105                        (not seasonally adjusted)
    Manufacturing
  Employment during                                     100
     Spanish Flu
      Pandemic                       Index (February 2020)
                                                             95                                WI: -7%
   Wisconsin: - 7%
   Ohio:      -11%
                                                             90
   New York: -15%
                                                                                               OH: -13%
                                                             85
Velde, F. R. (2020). What happened
to the US economy during the 1918                                                               NY: -18%
influenza pandemic? A view through
high-frequency data.                                         80
                                                                  February   March     April      May      June      July      August   September October November December

                                                                             United States              New York            Wisconsin         Ohio

                                                                     Source: Bureau of Labor Statistics & Upjohn Institute –
  2/19/2021                                                                      Current as of December 2020
2021 Economic Outlook: Cadillac/Wexford County - A presentation to Cadillac Area Chamber of Commerce
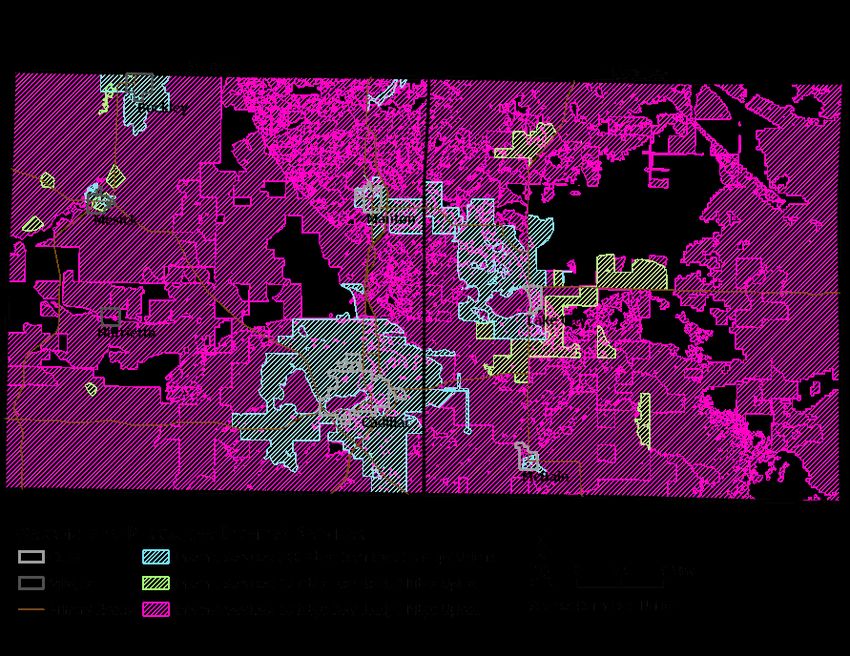
Employment is higher than December 2007, but not fully
recovered
                                                               Nonfarm Employment Index
                         115

                         110
Index (Dec 2007 = 100)

                         105

                         100

                          95

                          90

                          85
                            2007   2008   2009   2010    2011       2012       2013 2014              2015        2016   2017   2019   2020   2021
                                                                             United States

                                                        Source: Bureau of Labor Statistics Current Employment
                                                                                                                                          5
                                                        Survey & Upjohn Institute – Current as of February 2021
2021 Economic Outlook: Cadillac/Wexford County - A presentation to Cadillac Area Chamber of Commerce
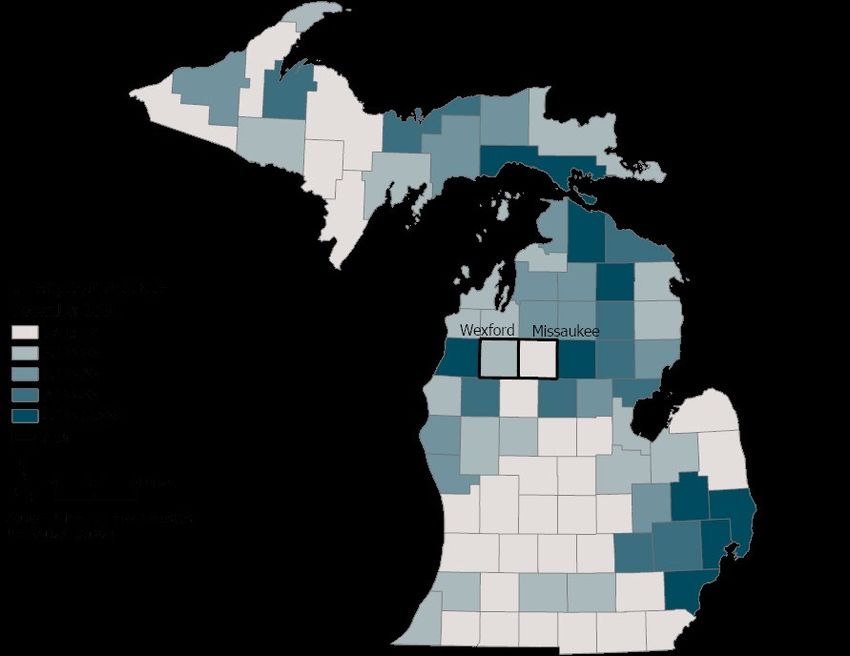
GDP growth is projected to remain solid, although
employment growth is forecast to be slowing
                                                                                                                                 Forecast
                     40
                                           Gross Domestic Product and Employment Change                                                     20,000

                                                                                                                                                      Employment Change (000s)
                     30                                                                                                                     15,000
GDP Change (% chg)

                     20                                                                                                                     10,000
                     10                                                                                                                     5,000
                      0                                                                                                                     0
               -10                                                                                                                          -5,000
               -20                                                                                                                          -10,000
               -30                                                                                                                          -15,000
               -40                                                                                                                          -20,000
                          2011   2012   2013   2014       2015         2016        2017        2018        2019          2020   2021
                                         GDP Change (L)           GDP Annual Avg. (L)                Employment Change (R)

                                               Source: Bureau of Labor Statistics Current Employment Survey, Bureau of
        2/19/2021                               Economic Analysis, & Federal Reserve Bank of Philadelphia – Survey of                           6
                                                       Professional Forecasters – Current as of February 2020
Moody’s predictions of a recession are trending downward:
28% in December
                                             Likelihood of Being in a Recession in the Next Six Months
                               100
                                90
 Likelihood of Recession (%)

                                80
                                70
                                60
                                50
                                40
                                30
                                20
                                10
                                 0
                                  2006 2007 2008 2009 2010 2011 2012 2013 2014 2015 2016 2017 2018 2019 2020

                                                        Source: Moody’s Analytics – Current as of February 2020   7
National PMI stood at 58.7 in February, indicating that the
manufacturing sector is expanding
                  Purchasing Managers Index - National
        70
        65
        60
        55
Index

        50
        45                                                         Readings below
                                                                   50 indicate sector
                                                                   is contracting
        40
        35
        30

                       Source: Institute for Supply Management –
  2/19/2021                  Current as of February 2021
                                                                                        8
The stock market has reacted to various events this year,
and the recent ride has been surprisingly good
                                                Dow Jones Industrial Average*
                                                                                                                     11/09/2020
33,000                    3/13                                                                                       Pfizer Covid-
                          COVID-19                                        7/29                                       19 vaccine                     17.0
31,000                                                                    Covid-19                                   announced

                                                                                                                                                           Unemployment Rate %
                          declared
                          national                                        deaths
29,000                    health                                          surpass                                                                   15.0
                                                                                                                                     1/20/2021
                          emergency                                       150,000
                                                                                                                                     Joe Biden
27,000      01/29
            USMCA                                                                                                                    inaugurated    13.0
                                                                                                       9/22/2020   11/07/2020        as President
            signed into
25,000      law
                                                                                                       Covid-19    AP calls          of the U.S.    11.0
                                                       5/27                                            deaths      winner of
23,000                                                 Covid-19                                        surpass     Presidential
                                                       deaths                                          200,000     election                         9.0
21,000                                3/27             surpass
                                      CARES Act        100,000                                                                                      7.0
19,000                                signed into
                                      law
17,000                                                                                                                                              5.0
15,000                                                                                                                                              3.0
         January 2020                                                                                                          February 2021

                                              Source: Yahoo Finance and Bureau of Labor Statistics –
                                                Source: Yahoo Finance & Bureau of Labor Statistics                                            9
                                                           Current as of February 2021
Consumer confidence and sentiment are bouncing around
               after falling precipitously between February and April
                                                                      Consumer Confidence
                              140                                                                                          140

                              120                                                                                          120
Index of Consumer Sentiment

                                                                                                                                 Index of Consumer Confidence
                              100                                                                                          100
      Index: 1966 = 100

                                                                                                                                          Index: 1985 = 100
                               80                                                                                          80

                               60                                                                                          60

                               40                                                                                          40

                               20                                                                                          20

                                0                                                                                          0
                                 2006 2007 2008 2009 2010 2011 2012 2013 2014 2015 2016 2017 2018 2019 2020 2021
                                         Recessions    Index of Consumer Confidence (CB) Index of Consumer Sentiment (U of M)

                                                              Source: Conference Board and University of Michigan –
                              2/19/2021                                    Current as of January 2021
                                                                                                                           10
University of Michigan/RSQE November* national forecast:
Note that these estimates are annualized
                                  2020                        2 0 21         2022
                      2 01 9
                               ( For ecast)                ( For ecast)   ( For ecast)

GDP                   2.2%        -3.6%                         4.2%         3.0%

Employment            1.3%        -5.7%                         2.7%         2.6%
Light Vehicle Sales
                       17.0       14.5                          16.3         16.7
(Millions)
Unemployment
                      3.7%        8.1%                          5.9%         5.3%
Rate
Housing Starts
                      1.30        1.34                          1.39         1.42
(Millions)

CPI/Inflation         1.8%        1.2%                          2.0%         2.1%

 2/19/2021                         - *Current as of November 2020                    11
The number of UI filings have stabilized
                     Weekly Initial Claim Filings for Unemployment Insurance are Slowing but Remain
                                                  at Historically High Levels
Number      8
of Claims
in millions 7
(seasonally
adjusted)     6

              5

              4

              3

              2

              1

              0
                  Jan-20 Feb-20 Feb-20 Mar-20 Apr-20 May-20 Jun-20 Jul-20 Aug-20 Sep-20 Oct-20 Nov-20 Dec-20 Jan-21 Feb-21

                                        Source: Unemployment Insurance Weekly Claims Data, U.S. Department of
                                                                                                                    12
                                                Labor and Upjohn Institute – Current as of February 2021
The number of traditional continuing claims are trending
downward
                                       Weekly continuing claims for unemployment insurance

Number 30
of Claims
in millions 25
(seasonally
adjusted)
              20

              15

              10

               5

               0
                   Jan-20 Feb-20 Feb-20 Mar-20 Apr-20 May-20 Jun-20 Jul-20 Aug-20 Sep-20 Oct-20 Nov-20 Dec-20 Jan-21 Feb-21

                                             Source: Unemployment Insurance Weekly Claims Data, U.S.
                                          Department of Labor and Upjohn Institute – Current as of February           13
                                                                      2021
REMI Forecasts

National Economic Forecast
Methodology

 • Upjohn uses a REMI model (www.REMI.com)
    • To estimate economic impacts from projects and events
    • Forecast national and regional changes in trends
 • As new forecasts were produced the latest REMI model was updated
    • National forecast is updated
    • Regional forecasts are updated
    • Forecasts come from:
        • Research Seminar in Quantitative Economics at U of M
        • Congressional Budget Office (CBO)

                                                                      15
National forecast for total employment
                   230,000

                   220,000
Total Employment

                   210,000
  (in thousands)

                   200,000

                   190,000

                   180,000

                   170,000
                             2019       2021     2023    2025                 2027            2029     2031    2033      2035
                              Pre-COVID-19         March                     May                August        November

                                               Source: REMI & Upjohn Institute – Current as of November
                                                                                                                           16
                                                                        2020
Industry recovery forecast
                      Projected Recovery of Industry Sectors Nationally by 2025
                       Health Care and Social Assistance
                                      Educational Services
                                    Finance and Insurance
                     Arts, Entertainment, and Recreation
                                                                                                                                          Fully recovered or
          Professional, Scientific, and Technical Services                                                                                more
                                               Information
Administrative and Support and Waste Management and…
                     Real Estate and Rental and Leasing                                                                                   Not fully
                      Accommodation and Food Services
                         Transportation and Warehousing
                                                                                                                                          recovered
                                                    Utilities
             Management of Companies and Enterprises
                                             Manufacturing
                Agriculture, Forestry, Fishing and Hunting
                                          Wholesale Trade
                                              Construction
                                     Public Administration
                                               Retail Trade                                                         Full Recovery
           Mining, Quarrying, and Oil and Gas Extraction
                                             Other Services

                                                           80          85          90           95         100         105          110

                                                         Source: REMI & Upjohn Institute – Current as of November
                                                                                                                                           17
                                                                                  2020
National forecast for goods producing employment
                   28,000

                   27,000
Total Employment
  (in thousands)

                   26,000

                   25,000

                   24,000

                   23,000
                            2019      2021   2023     2025                 2027           2029      2031   2033      2035
                              Pre-COVID-19       March                     May                August        November

                                             Source: REMI & Upjohn Institute – Current as of November
                                                                                                                        18
                                                                      2020
National forecast for business service sector*
employment
                   78,000

                   75,000
Total Employment
  (in thousands)

                   72,000

                   69,000

                   66,000

                   63,000

                   60,000
                            2019             2021            2023             2025             2027             2029             2031             2033             2035
                                Pre-COVID-19                         March                      May                    August                      November
                            *Includes: Wholesale Trade; Transportation & Warehousing; Information, Finance, & Real Estate; Professional, Scientific, & Business Services;
                            Management of Companies & Enterprises; Administrative, Support, Waste Management & Remediation Services

                                                             Source: REMI & Upjohn Institute – Current as of November
                                                                                                                                                                            19
                                                                                      2020
National forecast for personal service sector*
employment
                   90,000

                   85,000
Total Employment
  (in thousands)

                   80,000

                   75,000

                   70,000

                   65,000
                              2019      2021                    2023     2025                      2027             2029       2031                    2033     2035
                                Pre-COVID-19                        March                          May                  August                         November
                            *Includes: Retail Trade, Education & Health Services, Leisure & Hospitality, Other Services (excluding Public Administration).

                                                                Source: REMI & Upjohn Institute – Current as of November
                                                                                                                                                                   20
                                                                                         2020
National forecast for total output
                                70,000

                                65,000
(billions of current dollars)

                                60,000
        Total Output

                                55,000

                                50,000

                                45,000

                                40,000

                                35,000
                                         2019      2021   2023      2025                2027           2029      2031   2033     2035
                                           Pre-COVID-19       March                     May               August        November

                                                          Source: REMI & Upjohn Institute – Current as of November
                                                                                                                                    21
                                                                                   2020
Michigan Economy
University of Michigan RSQE current* state forecast

                                                  2020                2021
                        2019
                                                (Forecast)          (Forecast)
Employment Change
                     36.7 (+.08%)              -352.1 (-7.4%)      176.6 (+4.0%)
(thousands)
Manufacturing
Employment Change    -2.1 (-.03%)             -64.4 (-10.3%)        31.5 (+5.6)
(thousands)

Unemployment Rate       4.1%                        10.1%              7.1%

Labor Force
                        61.8%                       61.0%             61.2%
Participation Rate

 2/19/2021                          *Current as of November 2020                  23
Light vehicle sales are doing relatively well, but will supply
chain issues and affordability affect supply and demand?
                                                     Annualized Rate of U.S. Light Vehicle Sales (In Millions)
                                     24
Annual Rate of Sales (in 000,000s)

                                     22
                                     20
                                     18
                                     16
                                     14   16.8 (2000 to 2007 Average)                                                      16.7 (2013 to 2019 Average)
                                     12
                                     10
                                      8
                                      6
                                      4
                                      2
                                      0

                  2/19/2021                                      Source: Moody’s Analytics – Current as of February 2021                                 24
Class 8 Truck Orders reach highest level since 2019

                                                  Class 8 Truck Orders
                                 60
Annual Rate of Sales (in 000s)

                                 50

                                 40

                                 30

                                 20

                                 10

                                  0

                                              Monthly Sales            Annual Average

                 2/19/2021            Source: Moody’s ACT Research – Current as of January 2021   25
Michigan unemployment rate

• In December 2020, Michigan’s
  unemployment rate was at 7.5%
  and the United States was at 6.7%.

                          Source: Moody’s ACT Research – Current as of February
 2/19/2021                                       2021
                                                                                  26
Cadillac area unemployment rate

• In December 2020, Wexford
  County’s unemployment rate was at
  5.4% and Michigan was at 7.5%.

                         Source: Moody’s ACT Research – Current as of February
 2/19/2021                                      2021
                                                                                 27
Michigan labor force participation rate

• In December 2020, Michigan’s
  labor force participation rate was at
  59.9% and the United States was at
  61.5%.

                            Source: Moody’s ACT Research – Current as of February
 2/19/2021                                         2021
                                                                                    28
Cadillac area labor force participation rate

• In December 2020, Wexford
  County’s labor force participation
  rate was at 54.7% and Michigan’s
  was 59.9%.

                           Source: Moody’s ACT Research – Current as of February
 2/19/2021                                        2021
                                                                                   29
Cadillac area internet coverage

• Internet Services in Wexford and
  Missaukee Counties max out at 100
  Mbps Download; 10 Mbps Upload.
• While 1 Gbps Download speeds are
  sparse across Michigan, Wexford
  and Missaukee Counties lack any
  such services.
• All cities and villages in Wexford and
  Missaukee Counties have at least
  partial 100 Mbps Download speeds,
  except for the Village of Harrietta.

                             Source: Moody’s ACT Research – Current as of February
 2/19/2021                                          2021
                                                                                     30
Current Conditions

Cadillac/Wexford County
Economy
Based on the latest data, the current unemployment
rate for Wexford County was 5.4% in December
                                    Unemployment Rate for Wexford County
                               35
                               30
  Percent of Labor Force (%)

                               25
                               20
                               15
                               10
                                5
                                0

                                     Source: Quarterly Census of Employment and Wages, Bureau
                                                                                                32
                                          of Labor Statistics – Current as of February 2021
Wexford County has started to recover jobs that were
         displaced in the COVID-19 Recession
                                                                             Total Employment Index
                                      120

                                      110
             Index (Dec 2007 = 100)

                                      100

                                       90

                                       80

                                       70

                                       60
                                         2007   2008   2009   2010    2011     2012      2013      2014      2015      2016    2017     2018   2019
Note: Latest data are from June 2020                     Recessions        Wexford County            Michigan           United States

                                                                 Source: Quarterly Census of Employment and Wages, Bureau
                                                                                                                                                      33
                                                                      of Labor Statistics – Current as of February 2021
Manufacturing employment took a large hit during the
         lockdowns but has rebounded faster than the nation or
         state
                                                                      Manufacturing Employment Index

                                      120
                                      110
             Index (Dec 2007 = 100)

                                      100
                                       90
                                       80
                                       70
                                       60
                                       50
                                       40
                                         2007   2008   2009   2010    2011     2012      2013      2014      2015      2016    2017     2018   2019
Note: Latest data are from June 2020                     Recessions        Wexford County            Michigan           United States

                                                                 Source: Quarterly Census of Employment and Wages, Bureau
                                                                                                                                                      34
                                                                      of Labor Statistics – Current as of February 2021
The service sector employment rebound is slightly faster
         than the state
                                                                      Service Providing Employment Index
                                      120

                                      110
             Index (Dec 2007 = 100)

                                      100

                                       90

                                       80

                                       70

                                       60
                                         2007   2008   2009   2010     2011    2012      2013      2014      2015      2016    2017     2018   2019
Note: Latest data are from June 2020                     Recessions        Calhoun County            Michigan           United States

                                                                 Source: Quarterly Census of Employment and Wages, Bureau
                                                                                                                                                      35
                                                                      of Labor Statistics – Current as of February 2021
Employment recovery
      Percent of Jobs Regained* by December 2020 Following Employment
      Declines Beginning in March in West Michigan by Major Sector
                                Finance and Insurance                                                       175%
           Transportation, Warehousing, and Utilities                                                   157%
                   Mining, Logging, and Construction                                          123%
                                          Retail Trade                             93%
                  Health Care and Social Assistance                              84%
      Professional, Scientific, and Technical Services                          79%
                                        Other Services                         77%
                                        Total Nonfarm                       64%
                                        Manufacturing                      61%
                                  Leisure & Hospitality                  51%                Full Recovery
                                      Wholesale Trade                   50%
                                  Educational Services               36%
                                          Government         8%
                                           Information     0%
                                                          0%   25%   50%    75%    100% 125% 150% 175% 200% 225%
                                                                           Percent of jobs regained by December 2020
                                                                                                *Data not seasonally adjusted

                                        Source: Bureau of Labor Statistics – Current as of December
                                                                                                                                36
                                                                  2020
Job Postings

Cadillac/Wexford County
Job Postings
Job postings in West Michigan in December 2020 were
about where they were in December of 2019
                                Job Postings in West Michigan Change in Trend from a Year Earlier
                        50%

                        40%

                        30%
                                                   Restrictions eased,
    Percentage Change

                                                   reopening begins
                        20%                                                                       Seasonal holiday
                                                                                                  hiring
                        10%
                                                 Lockdown begins

                         0%

                        -10%

                        -20%

                        -30%
                               Jan-20 Feb-20 Mar-20 Apr-20 May-20 Jun-20 Jul-20 Aug-20 Sep-20 Oct-20 Nov-20 Dec-20 Jan-21

                                                    Source: Burning Glass & Upjohn Institute – Current as of
                                                                                                                            38
                                                                        January 2021
Total job postings in Wexford County

                       350
                       300
                       250
  Total Job Postings

                       200
                       150
                       100
                        50
                         0

                                    Job Postings            12-month average

 2/19/2021                   Source: Burning Glass - Current as of February 2021   39
Total job postings for health care and social assistance in
Wexford County

                       80
                       70
                       60
  Total Job Postings

                       50
                       40
                       30
                       20
                       10
                        0

                                   Job Postings            12-month average

 2/19/2021                  Source: Burning Glass - Current as of February 2021   40
Total job postings for manufacturing in Wexford County

                       40
                       35
                       30
  Total Job Postings

                       25
                       20
                       15
                       10
                        5
                        0

                                   Job Postings            12-month average

 2/19/2021                  Source: Burning Glass - Current as of February 2021   41
Total job postings for retail trade in Wexford County

                       60
                       50
  Total Job Postings

                       40
                       30
                       20
                       10
                        0

                                   Job Postings            12-month average

 2/19/2021                  Source: Burning Glass - Current as of February 2021   42
Total job postings for accommodation and food services
in Wexford County

                       30
  Total Job Postings

                       20

                       10

                        0

                                   Job Postings            12-month average

 2/19/2021                  Source: Burning Glass - Current as of February 2021   43
Total job postings for transportation and warehousing in
Wexford County

                       40
                       35
                       30
  Total Job Postings

                       25
                       20
                       15
                       10
                        5
                        0

                                   Job Postings            12-month average

 2/19/2021                  Source: Burning Glass - Current as of February 2021   44
REMI Forecasts

Northwest Michigan Works!
Forecast
Forecast for total employment for Northwest Michigan
Works!
                    945

                    925

                    905
 Total Employment
   (in thousands)

                    885

                    865

                    845

                    825

                    805

                    785
                          2019       2021   2023     2025                 2027           2029      2031   2033     2035
                            Pre-COVID-19       March                      May               August        November

                                            Source: REMI & Upjohn Institute – Current as of November
                                                                                                                      46
                                                                     2020
Industry recovery forecast
                 Projected Recovery of Industry Sectors in NW Michigan by 2025
                                              Construction
           Mining, Quarrying, and Oil and Gas Extraction
                                             Manufacturing
          Professional, Scientific, and Technical Services
                                                                                                                                     Fully recovered or
                                      Educational Services                                                                           more
             Management of Companies and Enterprises
                                    Finance and Insurance
                     Real Estate and Rental and Leasing                                                                              Not fully
                                                    Utilities
Administrative and Support and Waste Management and…
                                                                                                                                     recovered
                      Accommodation and Food Services
                         Transportation and Warehousing
                                               Information
                Agriculture, Forestry, Fishing and Hunting
                                          Wholesale Trade
                       Health Care and Social Assistance
                     Arts, Entertainment, and Recreation
                                             Other Services
                                                                                                              Full Recovery
                                     Public Administration
                                               Retail Trade

                                                           92         94        96         98        100        102      104   106

                                                          Source: REMI & Upjohn Institute - Current as of November
                                                                                                                                      47
                                                                                  2020
Forecast for goods producing employment for Northwest
Michigan Works!
                  215
                  210
                  205
                  200
 (in thousands)

                  195
       Jobs

                  190
                  185
                  180
                  175
                  170
                        2019      2021   2023      2025                2027           2029      2031   2033     2035
                          Pre-COVID-19       March                     May               August        November

                                         Source: REMI & Upjohn Institute – Current as of November
                                                                                                                   48
                                                                  2020
Forecast for business services* employment for
Northwest Michigan Works!
                  310
                  305
                  300
                  295
                  290
 (in thousands)

                  285
       Jobs

                  280
                  275
                  270
                  265
                  260
                  255
                  250
                        2019      2021                    2023      2025                   2027             2029      2031                    2033     2035
                          Pre-COVID-19                        March                        May                 August                         November
                        *Includes: Wholesale Trade; Transportation & Warehousing; Information, Finance, & Real Estate; Professional, Scientific, & Business Services;
                        Management of Companies & Enterprises; Administrative, Support, Waste Management & Remediation Services

                                                         Source: REMI & Upjohn Institute – Current as of November
                                                                                                                                                                        49
                                                                                  2020
Forecast for personal services employment for Northwest
Michigan Works!
                  360

                  350

                  340
 (in thousands)

                  330
       Jobs

                  320

                  310

                  300

                  290

                  280
                          2019      2021                    2023      2025                     2027             2029      2031                     2033     2035
                            Pre-COVID-19                        March                          May                 August                          November
                        *Includes: Retail Trade, Education & Health Services, Leisure & Hospitality, Other Services (excluding Public Administration).

                                                            Source: REMI & Upjohn Institute – Current as of November
                                                                                                                                                               50
                                                                                     2020
Forecast for total output for Northwest Michigan Works!
                                    285

                                    265
 (in billions of current dollars)

                                    245
           Total Output

                                    225

                                    205

                                    185

                                    165

                                    145
                                          2019      2021   2023     2025                 2027           2029      2031   2033      2035
                                            Pre-COVID-19       March                     May                August        November

                                                           Source: REMI & Upjohn Institute – Current as of November
                                                                                                                                      51
                                                                                    2020
Moving Forward
Considerations for the Future of the Economy: Macro
 • The shape of the recovery curve?
 • Will temporary closures become permanent?
 • Supply versus demand?
    • SME’s
 • What will be the impact of:
    • The new strain?
    • Vaccines?
 • What will be the impact from the new administration?
    • Tax policy
    • Trade policy
    • Stimulus policy

                                                          53
Considerations for the Future of the Economy
 • Is reshoring real?
     • Supply chain issues
     • Available buildings and sites
 • How will technology impact employment?
 • When and will people go back to work?
     • What will the new Administration do about UI benefits?
     • Fear of contracting COVID-19?
     • Barriers, notably childcare and school openings, in returning?
 • Other state and regional administrative decisions
     • Openings/closings
     • Vaccine availability and distribution

                                                                        54
Questions?
 • Jim Robey, PhD
    • Director, Regional and Economic Planning Services
    • Email: jrobey@upjohn.org
    • Phone: 269-343-5541
    • Twitter: @JimRobey
    • Keep up to date with Regional by signing up for our Regional email list.
      Send an email to boyle@upjohn.org to register.

                                                                                 55
You can also read