GLOBAL REAL ESTATE SECURITIES - Market Commentary 1H 2018 - CBRE Clarion ...
←
→
Page content transcription
If your browser does not render page correctly, please read the page content below
GLOBAL REAL ESTATE SECURITIES
Market Commentary 1H 2018
MARKET PERFORMANCE REVIEW
Real estate stocks were modestly positive during the first half of 2018, outperforming bonds
and trailing equities. Performance varied during the six months as a weak first quarter was
offset by a rebounding second quarter. We believe that real estate stocks continue to discount
or “price in” further increases in short-term interest rates by the Federal Reserve Bank, as well
as elevated geo-political concerns surrounding U.S. tariffs and trade policy. The U.S. Federal
Reserve Bank raised policy rates for the seventh time this cycle in June; central banks elsewhere
generally remain on hold in a global capital markets environment which is seeing higher
short-term rates and flatter yield curves. Global macro-economic releases suggest continued
gradual economic growth, improving employment and still moderate levels of inflation. The
U.S. 10-year Treasury bond yielded 2.85% at June 30th versus 2.41% at the beginning of the
year.
North American property companies modestly outperformed European and Asia-Pacific
companies for the six months, but still trail non-U.S. companies over the past year. (Exhibit
1) Within the U.S., sectors with earnings growth that is more sensitive to economic growth
led performance, including the self-storage, lodging and industrial property types. The retail
sectors of malls and shopping centers plus technology companies trailed. European property
companies were modestly negative despite improving economic conditions and real estate
fundamentals. Asia-Pacific returns were positive in Japan, where property fundamentals are
good, offset by negative performance elsewhere, including Singapore, which under-performed
in the second quarter as the result of tightening measures in the residential market.

EXHIBIT 1: GLOBAL REAL ESTATE SECURITIES PERFORMANCE AS OF JUNE 30, 2018
     10%       9.4%

      8%

      6%
                                                                            5.1%

      4%

      2%
                      0.9%
                                                       0.4%                         0.4%
                                                                0.1%
      0%
                                   -0.3%
                                           -1.2%
     -2%
                 Americas             Europe             Asia Pacific          World

                                           Q2 2018    YTD

Source: FTSE EPRA/NAREIT Developed Index in USD (Net of Withholding Tax) as of 06/30/2018. An index is unmanaged and not
available for direct investment. Past performance is no guarantee of future results.
MARKET OUTLOOK
Solid economic growth and modestly increasing inflation will benefit real estate stocks in
the second half of 2018. The economic outlook is solid and this will have a positive impact
on commercial real estate and listed real estate companies. Economic growth has momentum
in an economic expansion which continues to have durability at this point of an extended cycle.
Monetary policy will tighten in the U.S. but remain relatively more accommodative
elsewhere. Total return among property companies will be generated by 5% earnings growth
and 4% dividend yield with stable multiples. With real estate companies trading at a 9%
discount to our estimate of inherent real estate value of net asset value (NAV) (Exhibit 2), and
an implied capitalization rate of 6% globally, we believe real estate stocks remain attractively
priced relative to private real estate and competing asset classes.

EXHIBIT 2: NAV PREMIUM/DISCOUNT BY REGION
                                                                                                   10 Year Average
                   5%                                                                              Current NAV Premium / Discount    5%

                   0%                                                                                                                0%

                                                                                                                                             10 Year Average NAV P/D
                  -5%     -3%                                                                                                        -5%
                                    -3%
                                                   -…        -6%
Current NAV P/D

                  -10%                                                   -8%                                                         -10%
                                                                                   -9%      -9%        -10%
                  -15%                                                                                                               -15%

                  -20%                                                                                                               -20%

                  -25%                                                                                           -23%                -25%

                  -30%                                                                                                               -30%

                  -35%                                                                                                               -35%

                  -40%                                                                                                     -39%      -40%

                  -45%                                                                                                               -45%
                         Canada       U.S.      Australia    Cont.       U.S.      Global   U.K.     Singapore   Japan   Hong Kong
                                  All Sectors               Europe      "Core"    Average
                                                                        Sectors

Information is the opinion of CBRE Clarion as of 06/30/2018, is subject to change and is not intended to be a
forecast of future events, or a guarantee of future results, or investment advice. Forecasts and any factors discussed
are not indicative of future investment performance.

Real estate company earnings are forecast to grow in the 5% range in 2018. (Exhibit 3)
Earnings growth will be generated by a combination of “internal” growth, which is derived
from improving rate and occupancy among the existing tenant base, including the ability to
“mark to market” expiring leases, plus “external” growth from accretive acquisition activity and
the associated prudent recycling of capital. New supply is generally in check globally and the
cost of capital remains attractively priced with a lower yield curve than previous cycles despite
upward pressure on short-term interest rates.

EXHIBIT 3: REGIONAL EARNINGS GROWTH

                                                                                                                                           2018f
                                                                                                                                           2019f
12%

10%

       8%

       6%

       4%

       2%

       0%
                    Hong Kong     Singapore          U.K.          Cont Euro      Japan       U.S.         Australia     Canada        Global
                                                                                                                                      Average

Source: CBRE Clarion as of 06/30/2018.
Forecasts are the opinion of CBRE Clarion, which is subject to change and is not intended to be a guarantee of future
results or investment advice. Forecasts are not indicative of future investment performance.

                                                                                                                 CBRE CLARION GLOBAL REAL ESTATE MARKET COMMENTARY | 2
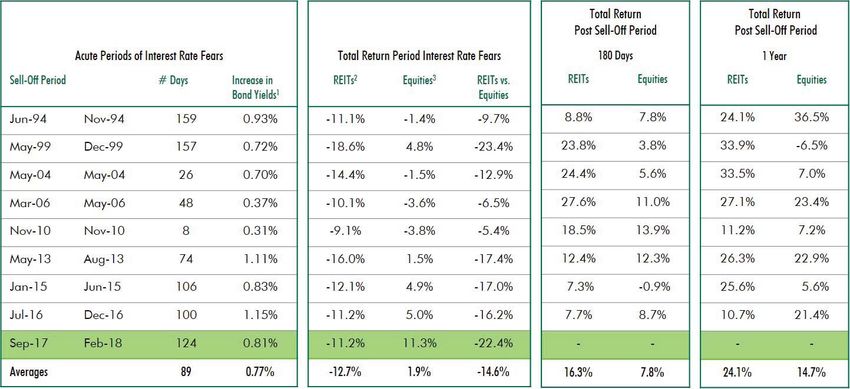
M&A activity is also picking up as a material disconnect                                Real estate companies can perform well in the face of
persists between the implied value of real estate in the                                rising interest rates. A short-term upward move in interest
listed sector versus estimated private market values. This                              rates typically can cause short-term dislocation among yield-
increasingly active bid should provide support at these levels                          sensitive asset classes, including the listed property company
for real estate stocks. There is significant real estate private                        sector. But history suggests that property company shares
equity “dry powder” globally. Given the history of private                              ultimately benefit from the underlying forces that cause rates
capital acquiring listed property companies which trade at                              to move higher, namely positive economic growth.
discounts to inherent private market value, M&A activity is                             When examined more closely globally, evidence points
validating attractive values in the listed sector.                                      to property shares generally performing well in a capital
Real estate dividend yield remains attractive and will grow                             markets environment with higher bond yields. Exhibit 5
again in 2018. (Exhibit 4) Current income generated by                                  shows 180-day and 12-month performance of U.S. REITs
listed property’s dividend yield remains a defining investment                          versus the S&P 500 during periods in which U.S. interest rates
characteristic of the sector. Listed property companies’                                materially rise (10-year Treasury). The positive returns during
dividend yield currently averages nearly 4% globally. We                                periods of rising interest rates may buck conventional wisdom
project average dividend growth to exceed earnings growth                               for some, but the favorable performance is not surprising
in 2018, driven by a combination of improving company                                   given that improving economic conditions also tend to lead
cash flows as well as an expansion of dividend payout                                   to improvement of the revenue line for owners/operators of
policies which remain conservative. Increasing dividends are                            commercial property and that this over time typically more
emblematic of healthy companies in improving markets.                                   than offsets any increase in debt expenses.

EXHIBIT 4: DIVIDEND YIELD REMAINS ATTRACTIVE
    6%
           5.2%          5.1%
                                        4.8%
                                                       4.2%
                                                                      4.1%                                                      4.0%
    4%                                                                              3.8%
                                                                                                   3.6%

                                                                                                                  2.8%

    2%

    0%
          Canada        Australia     Singapore     Cont Euro         U.S.           U.K.       Hong Kong        Japan          Global
                                                                                                                               Average
Source: CBRE Clarion as of 06/30/2018. Not all countries included. Dividend yields fluctuate and are not necessarily indicative of present or future investment performance.
Information is subject to change and should not be construed as investment advice. Past performance is no guarantee of future results.

EXHIBIT 5: U.S. REIT RETURNS DURING AND AFTER PERIODS OF RISING INTEREST RATES

1
  10-Year Treasury
2
  FTSE Nareit Equity REIT Index
3
  S&P 500 Index
Source: FactSet and CBRE Clarion as of February 28, 2018. An index is unmanaged and not available for direct investment. Past performance is no guarantee of future results.
                                                                                   CBRE CLARION GLOBAL REAL ESTATE MARKET COMMENTARY | 3
IMPORTANT DISCLOSURES
The views expressed represent the opinion of CBRE Clarion Securities which are subject to change and are not intended as a forecast or
guarantee of future results. This material is for informational purposes only. It does not constitute investment advice and is not intended as
an endorsement of any specific investment. Stated information is derived from proprietary and non-proprietary sources which have not been
independently verified for accuracy or completeness. While CBRE Clarion Securities believes the information to be accurate and reliable,
we do not claim or have responsibility for its completeness, accuracy, or reliability. Statements of future expectations, estimate, projections,
and other forward-looking statements are based on available information and management’s view as of the time of these statements.
Accordingly, such statements are inherently speculative as they are based on assumptions which may involve known and unknown risks and
uncertainties. The securities discussed herein should not be perceived as a recommendation to purchase or sell any particular security. It
should not be assumed that investments in any of the securities discussed were or will be profitable. Actual results, performance or events
may differ materially from those expressed or implied in such statements. Investing in real estate securities involves risks including the
potential loss of principal. Real estate equities are subject to risks similar to those associated with the direct ownership of real estate. Portfolios
concentrated in real estate securities may experience price volatility and other risks associated with non-diversification. While equities may
offer the potential for greater long-term growth than most debt securities, they generally have higher volatility. International investments may
involve risk of capital loss from unfavorable fluctuation in currency values, from differences in generally accepted accounting principles, or
from economic or political instability in other nations. Past performance is no guarantee of future results.
The FTSE EPRA/ NAREIT Developed Index is an unmanaged market-weighted index consisting of real estate companies from developed
markets, where greater than 75% of their EBITDA (earnings before interest, taxes, depreciation, and amortization) is derived from relevant
real estate activities. Investors cannot invest directly in an index. PA07302018
CBRECLARION.COM
CBRE CLARION GLOBAL REAL ESTATE MARKET COMMENTARY | 4You can also read