Photomask Industry Photronics, Inc. Global Leader in the Merchant - Q3 2019 Investor Presentation - Investor ...
←
→
Page content transcription
If your browser does not render page correctly, please read the page content below

Photronics, Inc.
         Global Leader in the Merchant
             Photomask Industry
Investor Presentation
Q3 2019
Safe Harbor Statement

    This presentation and some of our comments may contain projections or other forward-looking statements
    regarding future events, our future financial performance, and/or the future performance of the industry. These
    statements are predictions, and contain risks and uncertainties. Actual events or results may differ materially from
    those presented. These statements include words like “anticipate”, “believe”, “estimate”, “expect”, “forecast”, “may”,
    “plan”, “project” or the negative thereto. We cannot guarantee the accuracy of any forecasts or estimates, and we
    are not obligated to update any forward-looking statements if our expectations change. If you would like more
    information on the risks involved in forward-looking statements, please see the documents we file from time to time
    with the Securities and Exchange Commission.

    Non-GAAP Financial Measures
    This presentation and some of our comments may reference non-GAAP financial measures. These non-GAAP
    financial measures exclude certain income or expense items, and are consistent with another way management
    internally analyzes our results of operations. Non-GAAP information should be considered to be a supplement to,
    and not a substitute for, financial statements prepared in accordance with GAAP. Please see the “Reconciliation of
    GAAP to Non-GAAP Financial Information” in this presentation.

2
A Compelling Investment Thesis
► Global leader in merchant photomask industry
Delivering growth by leveraging core competencies: Operational Excellence, Low Cost
Producer, Technology Leadership, Customer Intimacy
► Investing aggressively to exploit secular growth opportunities
China industry expansion – Made in China 2025
Technology inflection from LCD to AMOLED
Explosion of G10.5+ panel capacity
► On track for 2020 target: $630M revenue & $0.80 EPS
Strategic investments bring top-line growth
Operating leverage creates margin expansion
Increasing free cash flow to fund growth investments
Lingering macro and growing geopolitical headwinds
3
Photronics at a Glance

    ► Largest merchant photomask                     Q3 2019 LTM Revenue by Product
      manufacturer
                                                                           IC 75%
    ► Unmatched global footprint
                                                                           FPD 25%

    ► Investing to exploit market
      disruptions with reciprocal customer                               535                 539
      commitments                            483
                                                             451

                                                   314             308         329
    ► Strong balance sheet to fund growth
                                                                                                   197

                                              2016            2017        2018           Q319 LTM
                                                         Revenue ($M)            Cash ($M)

4
Photomasks are Critical to Electronic Manufacturing

    Component                  Manufacturing      End
                 Photomask
    Design                     Process            User

5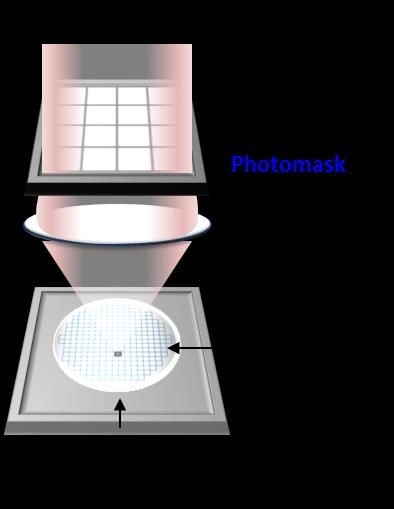
Core Competencies Underpin Sustainable Growth

                                   Cost control
     Low Cost Producer       Supply chain optimization

                                 Flexible delivery
    Operational Excellence          High yields

                                 Trusted partner
     Customer Intimacy       Wafer yield enhancement

                                Process know-how
     Technology Leader            Advanced PoR

6
Repositioned for Growth
► China Revenue ($M)
300.0
■ Total TAM ~$700M by 2022
■ Region with strongest growth potential 250.0 +46%
■ Supported by new manufacturing facilities
in 2019 200.0
► IC Captive
■ Approximately $2.6B TAM 150.0
+197%
■ We are seen as trusted partner
100.0
+37%
■ Commitments strengthen sustainability
► High-end revenue growth 50.0
■ High value and high growth 0.0
■ Supports China & captive initiatives China IC Captive High-End
2017 Q319 LTM
7Technology as a Tool to Support Business Growth
Growth Investment Cycle
Q3 2019 LTM FPD Revenue $134.5M
Mainstream
31%
High-End
Increase Develop High- 69%
Profitability End
and Cash Technology
Flow and Capability
Q3 2019 LTM IC Revenue $404.5M
Capture Share of
High-Growth, High- High-End
End Business 37%
Mainstream
63%
8Driving Sustainable, Profitable Growth
Long term (36+ months)
Strategic photomask partnerships
Adjacent market M&A
Future
Medium term (12-36 months)
China investments
FPD technology inflections
Realizing
Short term (6-12 months)
Repositioning the company
Improving high-end revenue
Implemented
9Developing and Growing China Business
China Revenue ($M) ► We already have growing business in
China
128
■ 24% of total revenue in Q319 LTM
• 17% of IC revenue
• 45% of FPD revenue
■ Growing strong since 2016
• IC +100% CAGR
• FPD +61% CAGR
► Manufacturing presence in China
31
aims to accelerate growth
■ Customer contracts help ramp facilities
more quickly
2016 Q319 LTM ■ Investment incentives reduce risk and
IC FPD improve returns
■ IC JV enables us to compete more
effectively
10Investing in China Operations
IC FPD
Location Xiamen Hefei
Investment Amount $160M $160M
Cleanroom Size ~2,500 m2 ~4,500 m2
Ownership Structure Majority-owned (50.01%) JV Wholly-owned
Technology High-end, mainstream, logic, memory Up to G10.5+, AMOLED
Incremental Revenue $150M (total for both operations; ~1/3 IC and ~2/3 FPD)
Customer commitments totaling ~$400M through 2021
Enables facilities to operate profitably
PLAB well positioned for these investments
Global merchant market and technology leader
Strong footprint in Asia
11
Balance sheet to support investmentReducing Risk of China Investment
China Investment ($M)
320 ~170Leveraging Technology Leadership for Mobile
Display AMOLED Adoption
Smartphone AMOLED Adoption ► Mobile devices moving from LCD to
50% AMOLED
■ Superior visual characteristics
40% ■ Lower power consumption
■ Enables flexible format
30% ■ Preferred for VR/AR devices
► Increases mask complexity
20%
AMOLED remains preferred ■ More mask layers per set
technology for mobile applications ■ Tighter specs on each layer
10%
► Established technology leadership
■ 1st firm with this P-800 mask writer
■ Produces highest resolution AMOLED
0% masks
2019 2020 2021 2022 2023 2024 2025
■ Competitive advantage vs. all merchants
Source: Internal Estimates
and captives
13G10.5+ Improved Glass Efficiency for Ultra-Large
Screen TV
75” 75”
75” G10.5+
75” 94% 75” 2940 mm x 3370 mm
73%
75”
75” 75”
G7.5
1950 mm x 2250 mm
G8.5
65” 65”
G6 2200 mm x 2500 mm
1500 mm x 1850 mm
65” 65” 65”
95%
65” 65” 65”
65”
88%
64%
65” 65” 65”
65”
14“Made in China 2025” Driving Growth in FPD Market
China FPD Mask Production ($M)
441 ► China represents fastest growing
display region
■ 51 fabs in production or under construction
■ Largest LCD display producer (Korea 2nd)
► Photomask opportunities in China are
attractive
168
■ Wide range of display technology,
G10.5+ including AMOLED & G10.5+
CAGR +62%
■ No merchant photomask producer with
high-end experience
2017 2023
■ No G10.5+ photomask producer
G10.5+ G8 G6 LTPS/AMOLED G5
Source: Internal Estimates
1551 China Display Fabs in Production by 2022
G10.5+ (5)
AMOLED (16)
LCD (30)
Photronics Locations
FPD Korea
FPD Hefei
FPD Taiwan
16 Image from https://commons.wikimedia.org/wiki/File:China-equirect.png“Made in China 2025” Driving Growth in IC Market
► China represents fastest
growing semiconductor region
■ Growing domestic producers
■ Investments by multi-nationals
► More investment needed to meet
national targets
■ 2023 forecast is 21%
■ China government target is 40% by
2020, 70% by 2025
► Photomask opportunities in
China are attractive
■ Wide range of nodes in logic and
memory
■ No strong domestic merchant mask
producer
1722 New China 12” IC Fabs
Logic (16)
Memory (6)
Photronics Locations
IC Korea
IC Xiamen
IC Taiwan
IC Boise (not shown)
18 Image from https://commons.wikimedia.org/wiki/File:China-equirect.pngImpact of US-China Trade Dispute
► Some of our customers beginning to feel impact (Q319)
► Tariffs
We do not ship, or plan to ship, any product from China to US
China counter-tariffs (product from US to China) have not yet been material
► Technology
Companies located in China recently added to the entity list do not have a material impact on
our IC business at this time
FPD business is not currently impacted by recent restrictions
► Due to dynamic and uncertain nature of ongoing dispute, future material impact
cannot be ruled out
19Strategic Priorities to Improve Shareholder Value
► Top line growth combined with continued focus on driving costs
out
► Disciplined focus on investments to improve ROIC
► Maintain strong balance sheet while returning cash to shareholders
Share repurchases
• Have repurchased $34M (3.7M shares) since July 2018
• Announced new $100M program in August 2019
Repaid $57.5M of convertible debt April 2019 (eliminated 5.5M potentially dilutive
shares)
Financial stability through economic downturn
Flexibility to invest in other growth opportunities (organic or M&A)
20Solid Financial Fundamentals
► Powerful operating leverage: target 50%
► Strong operating cash flow generator
► Positive free cash flow every fiscal year since 2009
► Solid balance sheet
21On Our Way to 2020 Target
Revenue ($M)
Key Success Factors
630 ► “Made in China 2025” – new facilities
539
► FPD technology inflections
► Repositioning the company
451
► Node migration (logic & memory)
► Growing business with captive
producers
► IC JV’s in China and Taiwan
► Stable mainstream business
► Cross-site collaboration to serve
global customers
2017 Q319 LTM 2020 Target
22Clear Capital Deployment Priorities
► Fund organic growth Cash & Debt ($M)
■ Geographic expansion into China
■ Investments to maintain technical leadership
329
■ Capacity expansion when reciprocated by
customer commitment 272
► Explore strategic M&A
■ Photomask industry – IC & FPD 197
■ Adjacencies to increase revenue diversification
148
► Debt repayment
■ Repaid converts ($57.5M) in April 2019;
removed 5.5M potentially dilutive shares 57
49
■ Local interest-subsidized China borrowing;
$49M outstanding end of Q319
► Share repurchase 2018 Q3 2019 2020 Estimate
■ Repurchased $33.8M (3.7M shares) since July Cash Debt Net Cash*
2018
■ Announced new $100M program August 2019
23 *Net cash defined as cash and cash equivalents less long-term borrowings (including current portion)Financial Summary
► Clear path to accelerate profitable growth
► Prudent stewardship of balance sheet
► Financial model to grow income faster than revenue
► On track to achieve financial targets
Revenue $630M & EPS $0.80 by 2020
Operating margin > 15%
Minimum $100M net cash
Improve ROIC – no projects accepted below hurdle rate
24A Compelling Investment Thesis
► Global leader in merchant photomask industry
Delivering growth by leveraging core competencies: Operational Excellence, Low Cost
Producer, Technology Leadership, Customer Intimacy
► Investing aggressively to exploit secular growth opportunities
China industry expansion – Made in China 2025
Technology inflection from LCD to AMOLED
Explosion of G10.5+ panel capacity
► On track for 2020 target: $630M revenue & $0.80 EPS
Strategic investments bring top-line growth
Operating leverage creates margin expansion
Increasing free cash flow to fund growth investments
Lingering macro and growing geopolitical headwinds
25Thank you for your interest!
For Additional Information:
R. Troy Dewar, CFA
Vice President, Investor Relations
203.740.5610
tdewar@photronics.comYou can also read