Investor presentation Responsible growth. Shared success - Givaudan
←
→
Page content transcription
If your browser does not render page correctly, please read the page content below
Investor presentation
Responsible growth. Shared success.

Givaudan products
drive millions of consumer decisions every day!

Key drivers of consumer repurchase decisions
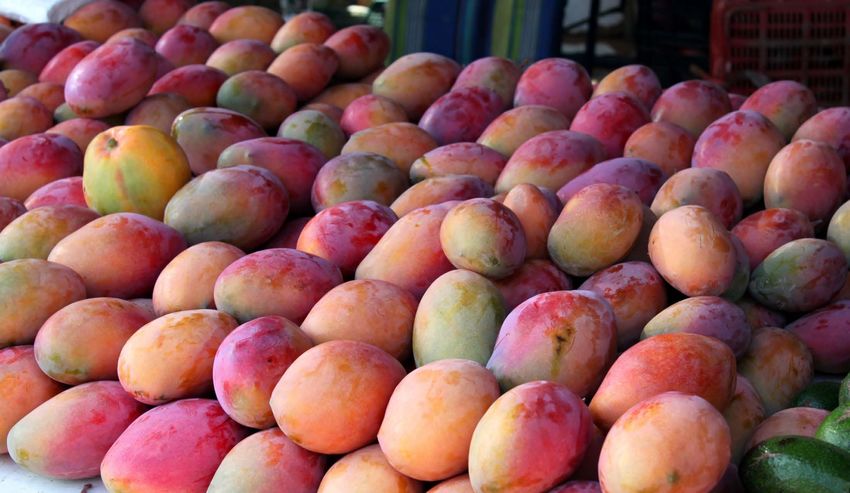
The fragrance and flavour industry
Fine Fragrances Flavours and Consumer Fragrances
Scent 78% Smell and taste 45%
4-6% 0.5% - 2%
of customers COGS of customers COGS
Brand image 30%
Price 15%
Overall experience 8%
Brand 5%
Fragrance image 3%
Packaging 10%
Other 6%
Source: AC Nielsen (European) study
Investor Presentation April-July 2018 3
The fragrance and flavour industry
The fragrance and flavour industry
End consumer markets

Our customers
Multi-national | Regional | Local | Foodservice | Private label

The cost of flavours and fragrances to our customers is typically between
0.5 – 5% of their product cost

      Food        Beverages       Fine Fragrances                         Household   Personal care   Cosmetics

                                  Investor Presentation April-July 2018                                           5
The fragrance and flavour industry
Total market is CHF 22 billion

             Others

> Givaudan market share above 25%

                              Investor Presentation April-July 2018   6
‘How to win business’ model
in a competitive bidding situation

Product life cycles are getting                                       Our submissions draw on leading
shorter – Our customers issue over 35,000                             global market knowledge
briefings per year:                                                   and capabilities

• To a small number of Fragrance and Flavour                          • Creation capability and our fragrance and flavour
  houses (typically 2 – 4)                                              ingredients palette and technology

• The brief defines the targeted consumer group                       • State-of-the art evaluation and application
  (region, socio-demographic) and cost                                  process

• As well as product and brand related                                • Consumer insight and local market
  information and requirements                                          understanding

                                                                      • Regulatory compliance and advice

> Revenue stream over the life cycle of the customers’ product

                                         Investor Presentation April-July 2018                                              7
Where are we now?

2017 Full Year Results
Good growth, in line with 2020 guidance

              Sales                                   EBITDA                                Net income                   FCF            Dividend

           CHF 5.1                                  CHF 1,089                                 CHF 720                  CHF 594        CHF 58.00,
           billion,                                  million,                                 million,                 million,

      up 4.9% like-                                  margin of                           up 11.7% year-              11.8% of sales   up 3.6% year-
        for-like*                                     21.6%                                 on-year                                      on-year

* LFL (like-for-like) excludes the impact of currency, acquisitions and disposals

                                                                             Investor Presentation April-July 2018                                    9
2017 Full Year Results
Sales performance: Good growth, in line with 2020 guidance

in million CHF
                                                                              5,051

                                                                                                                                          2,708
                                                                                                                              2,343

                                                                            Group                                           Fragrances   Flavours

% 2017 growth on LFL* basis                                                   4.9 %                                           4.5%         5.3%

% 2017 growth in CHF                                                           8.3%                                           5.1%        11.3%

* LFL (like-for-like) excludes the impact of currency, acquisitions and disposals

                                                                                    Investor Presentation April-July 2018                           10
Sales evolution by market
Balanced growth across all markets
in million CHF
2,867
2,566
2,184
2,097
FY2016 FY2017 FY2016 FY2017
Mature High growth
% of total sales 55% 57% 45% 43%
% 2017 growth on LFL* basis 5.1% 4.8%
* LFL (like-for-like) excludes the impact of currency, acquisitions and disposals
Investor Presentation April-July 2018 11Sales evolution by region
Strong Growth lead by North America & EAME
in million CHF 1,723
1,601
1,358 1,352
1,320
1,151
591 618
FY FY FY FY FY FY FY FY
2016 2017 2016 2017 2016 2017 2016 2017
LATAM APAC NA EAME
% 2017 growth on LFL* basis
4.8% 2.5% 7.0% 5.5%
* LFL (like-for-like) excludes the impact of currency, acquisitions and disposals
Investor Presentation April-July 2018 122018 First quarter sales
Sales performance: Good start to the year
2017 2018
In million CHF
1308
1242
704
666
576 604
Group Fragrances Flavours
% 2018 growth on LFL* basis 5.0% 5.7% 4.5%
% 2018 growth in CHF 5.4% 4.9% 5.8%
* LFL (like-for-like) excludes the impact of currency, acquisitions and disposals
Investor Presentation April-July 2018 13The value proposition for investors
Unrivalled capabilities

Depth and range of             Global reach                      Unmatched resources         Broadest product offering
customer relationships                                           to service our customers

 109                          68                                            46              Over    74,000
  Locations                 Creation and                             Production sites              Products sold per year
  worldwide              application centres

                                          Investor Presentation April-July 2018                                             15
Leading position in R&D
Culture of innovation
Pioneering R&D teams - new
business horizons
Diversity in skills State-of-the-art technologies
Wide range of competences Sustainable investments in novel
and skills – worldwide technologies
presence
Collaborations Innovative ingredients
Sustainable collaborations Unique ingredients palette -
with customers, suppliers, cost-effective – environmental
partners and emerging friendly
innovation ecosystems
Creative solutions
Passionate teams – extensive
consumer and trend
understanding
> Winning solutions - Shared success
Investor Presentation April-July 2018
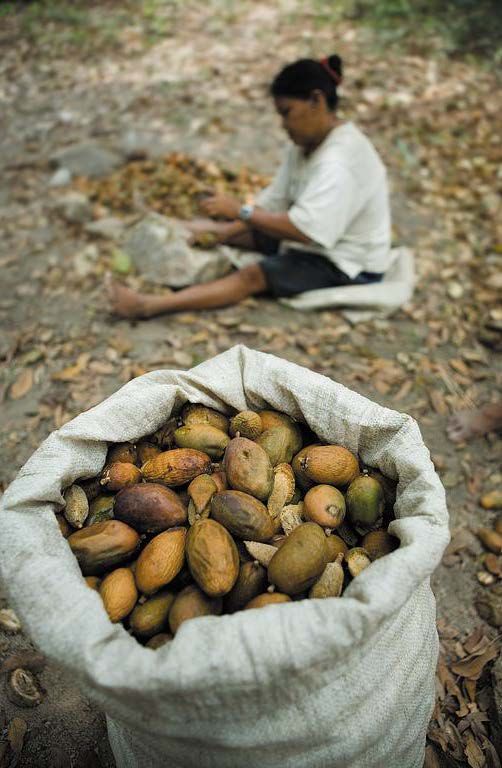
16Value creation
at the heart of our
procurement strategy
• Leadership through cost advantage
• Mitigate supply and price volatility
• Maximise supplier contribution to novel
solutions
• Responsibility over the complete supply chain
• Increased sourcing of natural raw materials to
satisfy demand
Today 60% of raw materials bought for
flavours are natural
20% of all raw materials bought for
fragrances are natural
60% of active beauty ingredients are natural
Confidential information of Givaudan 17Well balanced business with natural hedges
Geography
• 45% of sales in high growth
markets
• 55% in mature markets
Segments Customers and products
Balanced portfolio in most fragrance Diversified customer base
and flavour applications ranging from multinationals
to regional and local
customers, from premium
brands to private and white
label
Currency
• Creation and production
centres close to customers
• Sales and expenses balanced
across major currencies
protecting margins
Investor Presentation April-July 2018 18Dividend per share
Increasing 3.6% YoY
Free cash flow of CHF 7.1 Billion generated over the past 18 years
CHF 3,664 million of cash flow returned to shareholders as dividends
and CHF 504 million (net) through share buy-backs
50 54 56 58
47
36
20 20.6 21.5 22
17.6 18.8 19.5
15.4 16.3
720
Raw mats 662
8.1 SAP - Quest 604 597 594
6.5 7 549
FIS 512
FIS 437
390
340
273 295 289
262
203
157 145
117
2000 2001 2002 2003 2004 2005 2006 2007 2008 2009 2010 2011 2012 2013 2014 2015 2016 2017
Free Cash Flow Dividend
Investor Presentation April-July 2018 192020 strategy Responsible growth. Shared success.
Givaudan Business Solutions (GBS)

1.   Givaudan Business Solutions (GBS) is a unique organisation designed to improve
     internal efficiencies, leverage best practices from across the organisation and
     increase our agility so that we can better deliver for our customers.

2.   GBS will become the home for the newly harmonised processes of various
     functions within Givaudan.

3.   GBS will be implemented from now through 2020 following a strict transition
     methodology.

4.   The Company expects annual recurring savings of CHF 60 million as of 2020 when
     GBS is fully operational.

                               Investor Presentation April-July 2018                   21
Givaudan Business Solutions
Project fully on track
• Givaudan Business Solutions is well on track with the previously communicated costs and benefit
outlook fully confirmed, following the completion of the detailed design activities.
• The delivery centre locations in Budapest, Buenos Aires and Kuala Lumpur have been established and
more than 200 new employees have been recruited.
• First transition activities are well underway in Europe and in Asia Pacific, with the first handover of
activities planned in the first half of 2018.
Benefits Costs
60
45
20
(7)
(15)
(41)
(107)
Total
Cost (47) (77) (33) (13) CHF
Cash
Impact 170M
2017 2018 2019 2020
Investor Presentation April-July 2018 22Acquisition update
Acquired business complements organic growth
2014 2016 2018
Soliance Spicetec Centroflora Nutra
Active Beauty Flavours Naturals
Expressions
Parfumées
Acquired
Fragrances
businesses
contributed
CHF 315 Naturex
2015 2017 million to 2017
sales
Naturals
Induchem Activ International
Active Beauty
Vika B.V.
Flavours
• Investments in acquisitions since 2014 of CHF 691 million
• Integration activities completed or well on track, with good growth profile of acquired companies in 2017
• Confirmation of complementarity in core capabilities, naturals, integrated solutions and new business areas
In both divisions, our acquisitions are fully aligned with our 2020 strategic priorities
in delivering winning solutions to our customers
Investor Presentation April-July 2018 23Responsible growth.
Shared success.
Growing with Delivering Partnering for
our customers with excellence shared success
4-5% 12-17% Partner
Average organic sales
growth*
Average free
cash flow as
% of sales*
of choice
Creating additional value through acquisitions
Intention to maintain current dividend practice as part of this ambition
* Average from 2016 to 2020
Investor Presentation January - April 2018 24Responsible growth.
Shared success.
Growing with Delivering Partnering for
our customers with excellence shared success
High growth Health and Innovators Suppliers
markets well-being
Excellence in
execution
Consumer Integrated People Communities
preferred products solutions
Investor Presentation January - April 2018Disclaimer
No warranty and no liability: While Givaudan is making great efforts to include
accurate and up-to-date information, we make no representations or warranties,
expressed or implied, as to the accuracy or completeness of the information
provided on this handout and disclaim any liability for the use of it.
No offer and no solicitation: The information provided on this handout does not
constitute an offer of or solicitation for the purchase or disposal, trading or any
transaction in any Givaudan securities. Investors must not rely on this information
for investment decisions.
Forward-looking information: This handout may contain forward-looking
information. Such information is subject to a variety of significant uncertainties,
including scientific, business, economic and financial factors, and therefore actual
results may differ significantly from those presented.
Copyright © 2018 Givaudan SA. All rights reserved.
Investor Presentation April-July 2018 26You can also read