UK House Price Index - Hometrack
←
→
Page content transcription
If your browser does not render page correctly, please read the page content below
Research and Insight
                                                                                          November 2020 index
                                                                                        (published 21 December 2020)

UK House Price
Index
Housing market activity continues to run well ahead of 2019 levels

         +3.9%
            Current UK house
                                        +26%
                                   Total monetary value of homes
                                                                                          2x
                                                                                 Rate of price inflation for
              price growth               sold in 2020 v 2019                    houses versus flats - driven
                                                                                   by ‘search for space’

                               Executive summary
                               •   House price growth climbs to +3.9% - expected to plateau at 5% in 2021 Q1

                               •   Strong end to 2020 with demand and sales agreed >30% above last year.
                               •   2020 registered 40% more demand than 2019, and sales up 9% UK-wide
                                   housing market closure of nearly 2 months.

                               •   Strong rebound in sales activity in southern England pushes total value of
                                   homes sold in 2020 up 26%, - an extra £62bn in sales.

                               •   Average price inflation for houses (+4.3%) rising at twice the rate of flats
                                   (+1.8%) as buyers search for space.
                               •   Strong start expected for 2021 but housing market not immune from
                                   economic factors and price growth will slow to +1% by the end of 2021.

“2020 has been a
 rollercoaster year
 with the pandemic
 unlocking a sizable
 amount of latent
 demand for housing
 that has pushed
 prices higher and led
 to a 26% increase in
 the value of homes
 sold over the year.”

 Richard Donnell
 Research and Insight
 Director, Zoopla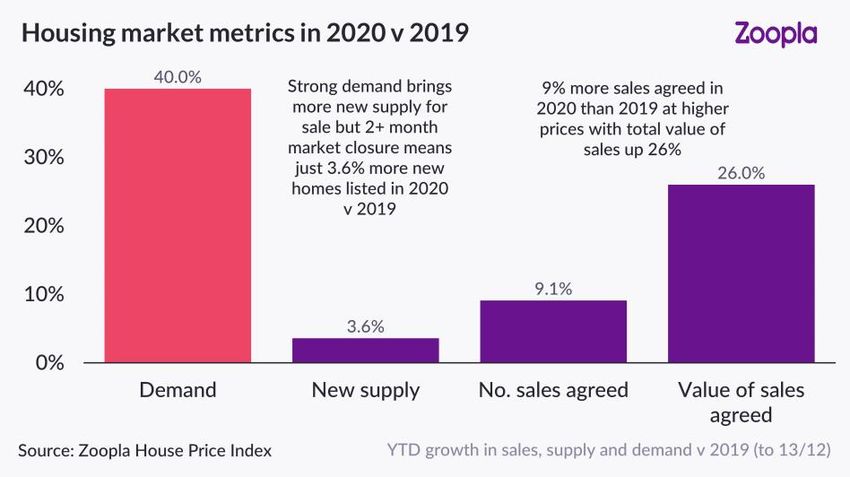
November 2020 | UK House Price Index | Page 2
3.9%
Annual UK house price inflation +3.9%
The annual rate of UK house price growth has moved higher to +3.9% in
November up from +1.3% a year ago. The 3-month growth rate peaked at 2% in
Annual UK house
price growth September and has slowed, suggesting annual growth will start to plateau at
c.5% in 2021 Q1.
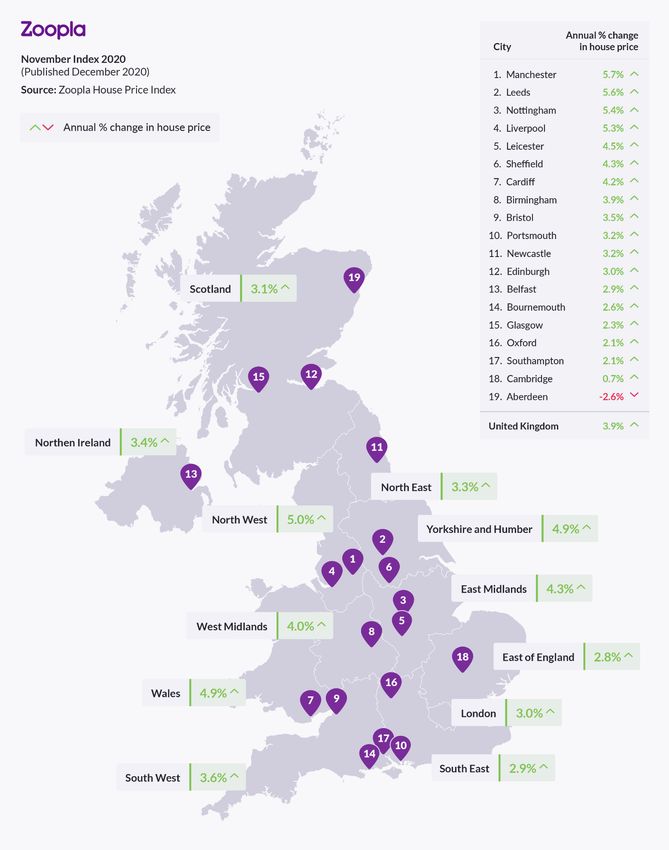
The impetus for house price growth is coming from northern England and
Wales where affordability remains less of a barrier to price growth. Average
prices in the North West are increasing at 5% followed by Wales and Yorkshire
and the Humber (both 4.9% - see map at page 6). At a city level, Manchester is
registering growth of 5.7% followed by Leeds, Nottingham and Liverpool all
recording growth over 5% per annum.
UK house price index summary, November 2020
3-month % year Average
change on year price
Jun-2020 0.3% 2.2% £217,500
Jul-2020 0.7% 2.5% £218,800
Aug-2020 1.1% 3.2% £220,400
Sep-2020 2.0% 3.7% £221,900
Oct-2020 1.4% 3.4% £221,800
Nov-2020 1.1% 3.9% £222,900
Source: Zoopla UK House Price Index
Demand for housing 40% higher over 2020 than 2019
Market conditions remain strong as we move towards the Christmas break.
Demand has slowed since the summer but remains 33% higher than a year ago
when the General Election impacted levels of activity. Over the whole of 2020
we have recorded 40% more demand for housing than in 2019. The flow of new
supply onto the market has been 4% higher than 2019 and this supply/demand
mismatch explains why house price growth is increasing.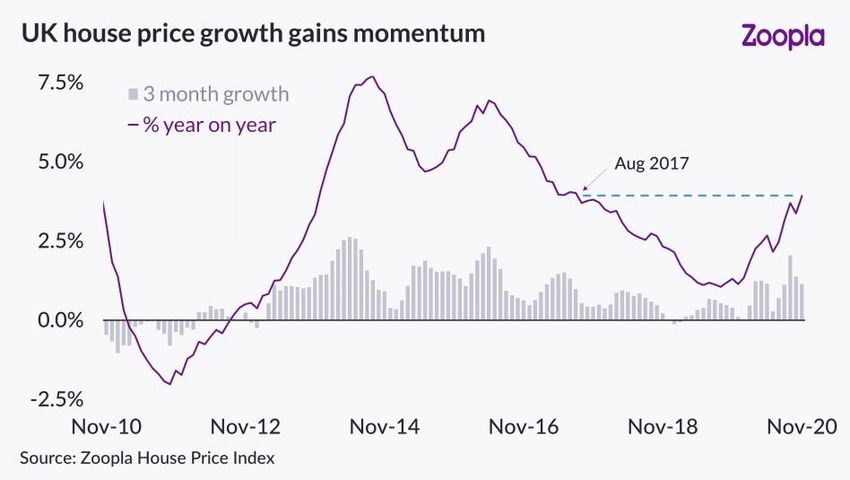
November 2020 | UK House Price Index | Page 3

+26%
                              South of England leads the recovery in new sales
                              Sales agreed continue to run ahead of last year by over 40%, in line with above
                              average demand. Over the course of 2020 we have recorded 9% more new
Monetary value of new sales
agreed in 2020 versus 2019    sales agreed than in 2019. These sales convert into completions after 3-4
                              months so a proportion of these new sales will not complete until 2021.

                              The rebound in sales has been strongest in the South East and Eastern regions
                              where they are more than 20% higher than 2019. Sales agreed have lagged in
                              Scotland, Wales and Northern Ireland as a result of longer market housing
                              market closures than in England over the year.

                              Value of sales agreed in 2020 is 26% higher than 2019
                              We have highlighted in previous editions how the COVID crisis has driven a
                              shift in the demographic profile of new sales, with a notable increase in affluent
                              demographics where house prices are higher.

                              A combination of more sales at higher prices means the total value of
                              residential property that has changed hands in 2020 is 26% higher than last
                              year. This equates to an additional £62bn of sales which takes the annual total
                              value to over £300bn.
                              This will significantly boost estate agency revenues and explains why the value
                              of mortgage approvals for home purchase in October is 68% higher than a year
                              ago (reflecting sales agreed 2-3 months prior, in the peak of the rebound).
                              There is a clear relationship between the number and value of sales agreed
                              across regions and countries.

                              Sales activity in the south of England has been lower than historical averages in
                              recent years, so this year’s bounce-back in activity – coupled with higher
                              average selling prices – means that the total value of homes sold in 2020 in the
                              East of England and the South East is up to 37% higher than in 2019.
                              Stronger housing market conditions in northern English regions last year,
                              explain why the growth in sales in these areas has been more in line with the
                              national average.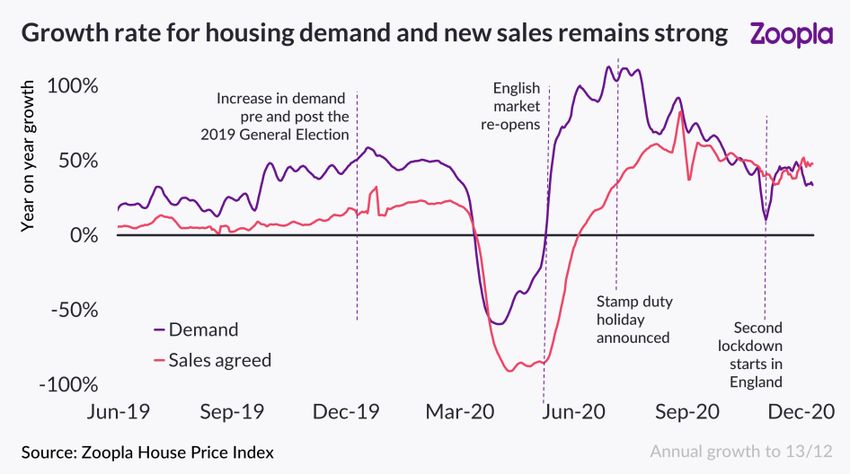
November 2020 | UK House Price Index | Page 4

+4.3%
                              Price growth for houses is more than double that for flats
                              The search for space has been a key feature of the rebound in market activity
                              as households re-evaluate their housing requirements. Demand for family
Annual growth rate for the
price of houses – more than   housing with gardens, parking and extra space to work from home has
double the rate for flats     continued to rise. For those looking to buy flats, buyers are prioritizing homes
                              with private outside space but not all homes can meet this requirement which
                              is then reflected in pricing levels and the time to sell.

                              Segmenting our house price index by property type shows that the search for
                              space is having an impact on price inflation with houses recording annual price
                              inflation 2x that for flats. There is a spread in growth rates by area but in all
                              cases the rate of growth for flats is lower than for houses.

                              Strong start to 2021 Q1
                              As we approach the final two weeks of the year, housing market activity is
                              slowing but remains unseasonably strong. The ‘once in a lifetime re-
                              assessment of housing’ kick-started by the pandemic has further to run in our
                              view. As households look to the future, and with no immediate end in sight to
                              restrictions, a proportion will continue to re-assess their housing priorities.

                              Stamp duty is a factor supporting demand, but we have questioned the scale of
                              the importance. A recent consumer survey by Zoopla found that 44% of
                              movers’ plans were not influenced by the stamp duty holiday - they remain
                              focused on the need to relocate and find more space and a better location.

                              We expect a seasonally strong start to 2021 with older, equity rich, long-time
                              owning households continuing to take a growing share of sales. Improved
                              availability of higher loan to value mortgages for those with deposits of 10% or
                              more are already increasing which will support first time buyers in 2021.
                              With a long Christmas weekend, and many households isolating in smaller
                              groups, we expect interest in housing to be stronger than usual ahead of the
                              traditional Boxing Day bounce when interest in housing jumps and the next
                              tranche of households start planning their next move.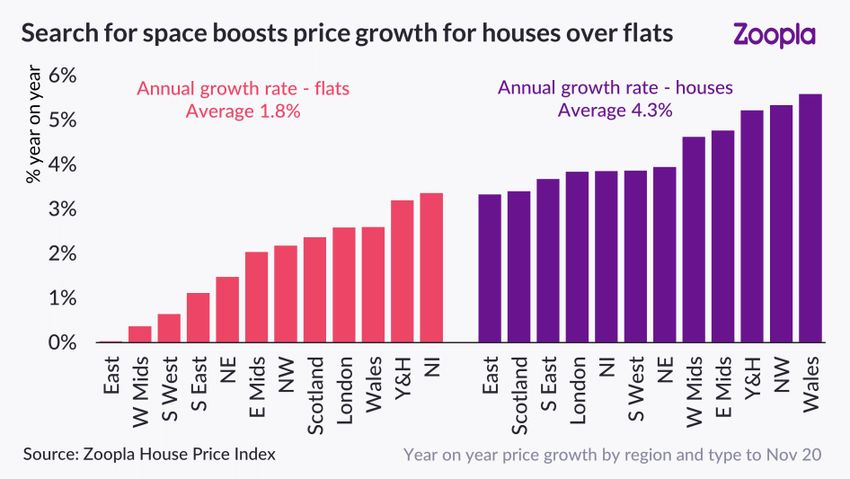
November 2020 | UK House Price Index | Page 5

+5.7%
Annual house price growth in
Manchester City Region

                               Housing market not immune from economic factors
                               While market activity is being boosted by latent demand unlocked by the
                               pandemic, the housing market is not immune to economic forces and rising
                               unemployment. Economic pressures are already impacting in parts of the
                               market, reducing the volume and share of sales in less wealthy areas, for
                               example.

                               Our previous report set out in detail our forecasts for completed sales and
                               house prices over 2021. We expect house price growth to slow to +1% by the
                               end of 2021 as demand starts to weaken over 2021 H2. The number of
                               completed housing transactions will be buoyed by a strong Q1 with sales
                               agreed over 2020 Q4 completing early next year. Overall, we expect the
                               number of completed housing transactions to match 2020 levels at 1.1m.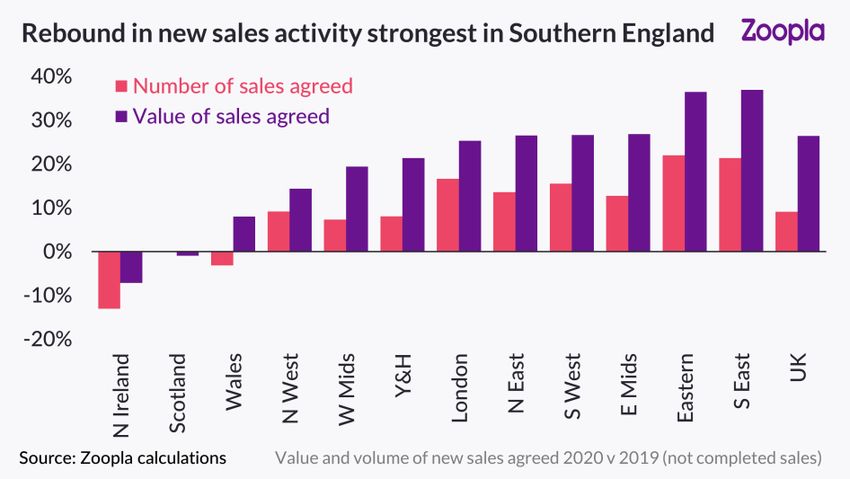
November 2020 | UK House Price Index | Page 6

House Price Index – Country, region and city summary
Note: The Zoopla house price index is repeat sales-based price index using sold prices, mortgage valuations and data for agreed
sales. The index uses more input data than any other and is designed to accurately track the change in pricing for UK housing.
November 2020 | UK House Price Index | Page 7

                      Zoopla UK house price index – City Summary - November 2020

                                                 Average  %yoy   %yoy                              Monthly              Annual
                                                   price Nov-20 Nov-19                               trend               trend

                       UK                       £222,900               3.9%           1.3%
                       20 city index            £259,900               3.5%           1.4%

                       Manchester               £179,200               5.7%           3.4%
                       Leeds                    £175,000               5.6%           2.3%
                       Nottingham               £164,800               5.4%           3.9%
                       Liverpool                £126,600               5.3%           2.8%
                       Leicester                £189,500               4.5%           4.2%
                       Sheffield                £143,200               4.3%           2.4%
                       Cardiff                  £215,700               4.2%           2.2%
                       Birmingham               £172,600               3.9%           2.7%
                       Bristol                  £287,800               3.5%           1.8%
                       Newcastle                £129,500               3.2%           0.3%
                       Portsmouth               £244,700               3.2%           1.0%
                       Edinburgh                £234,000               3.0%           4.0%
                       Belfast                  £140,700               2.9%           3.5%
                       London                   £485,100               2.8%           0.2%
                       Bournemouth              £294,000               2.6%           1.0%
                       Glasgow                  £121,500               2.3%           3.1%
                       Southampton              £229,400               2.1%           0.0%
                       Oxford                   £407,100               2.1%          -0.4%
                       Cambridge                £415,200               0.7%           1.6%
                       Aberdeen                 £141,500              -2.6%          -4.6%
                      Source: Zoopla House Price Index
                      Sparklines show last 12 months trend in annual and monthly growth rates – red bars are a negative value – each
                      series has its own axis settings providing a more granular view on price development

Contact               If you have any questions about our research please do get in touch.
                      Richard Donnell                                    David Ross
                      Director of Research & Insight                     Managing Director, Hometrack
                      richard.donnell@zoopla.co.uk                       dross@hometrack.com

Recent publications   Sign up for all the latest research from Zoopla at
                      advantage.zpg.co.uk
 UK
 Rental
 Market               The information and data in this report was correct at the time of publishing and high standards are
 Report
                      employed to ensure its accuracy. However, no reliance should be placed on the information
 2020 Q1
                      contained in this report and Zoopla Ltd and its group companies make no representation or
                      warranty of any kind regarding the content of this article and accept no responsibility or liability
                      for any decisions made by the reader based on the information and/or data shown here.
You can also read