Urban Agglomeration and Economic Growth: the role of Human Capital - AISRe
←
→
Page content transcription
If your browser does not render page correctly, please read the page content below
Urban Agglomeration and
Economic Growth: the role of
       Human Capital
                              Paolo Sestito
                               Banca d’Italia
                       Servizio Struttura Economica
Guido De Blasio, Andrea Lamorgese, Vincenzo Mariani, Sauro Mocetti and Andrea Petrella
 provided remarkable contributions to these slides on the basis of their work in progress.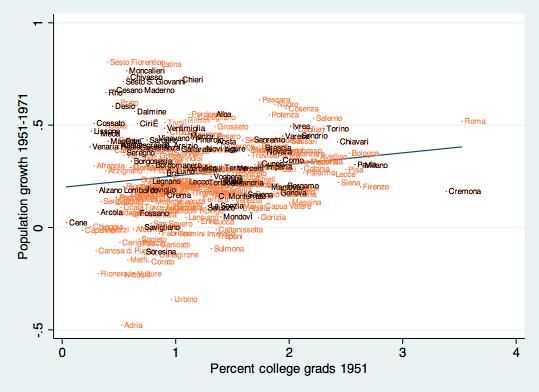
Economic growth is an increasingly urban
     phenomen: the international evidence
• From the early XX century, urban population growth
  outweighed national population growth (Duranton and Puga,
  2013; Giffoni, Gomellini and Pellegrino, 2015).
                                   Population growth rate
                                    (average per decade)

                          period    Urban       National
                USA    1920-2010     17.9        12.6
                Spain 1920-2010      18.1         8.9
                France 1937-2007     7.7          5.7
                Italy  1911-2001     7.2          4.9

• In 1971, 51% of population lived in non urban areas.
• From 1981 urban dwellers steadily increased above the 50%
  share.
Urban vs. non urban areas in Italy
Definitions (based on OECD)
• Urban area is the travel-work-area (LLM) surrounding a dense urban center.
• A dense urban center is a municipality or a cluster of neighboring municipalities
whose population density is equal or above 1.5K inhabitants per km2.
• There are 74 Urban areas in Italy.
• Non urban areas are the remaining ones (= non dense travel-to-work-areas).
Urban Non Urban Total LLM definition
1981 74 880 954 1981
1991 74 710 784 1991
2001 74 612 686 2001
2001 74 609 683 2011
2011 74 538 612 2011Economic growth is an increasingly urban
phenomen in Italy: population
Agglomeration Intensive margin Extensive margin Combined
Period 1981-1991
Non urban 0.7 -3.7 -3.0
Urban -0.3 3.7 3.4
Total population growth 0.4
Period 1991-2001
Non urban 0.4 -1.0 -0.7
Urban 0.0 1.0 1.0
Total population growth 0.4
Period 2001-2011
Non urban 1.8 -3.1 -1.3
Urban 2.5 3.1 5.6
Total population growth 4.3
Share of non-natives on area’s
Share of total population
Agglomeration population
1991 2001 2011 1991 2001 2011
Non urban 47.7 46.9 45.7 0.5 2.0 6.3
Urban 52.3 53.1 54.3 0.8 2.6 7.2
Note: Urban agglomerations vary according to the LLM classification released in each year. The extensive margin refers to the transition of
municipalities in and out of a given LLMEconomic growth is an increasingly urban
phenomen in Italy: income
Per capita fiscal Share of total Contributions to
income income income growth
Agglomeration
1998 2006 1998 2006 1998-2006
Non urban 11037 10661 37.8 36.4 4.1
Urban 14545 15486 62.2 63.7 10.3Economic growth is an increasingly urban
phenomen in Italy: Value added
1996-2002 (1) 2001-2005 (2)
Agglomeration VA per person Contribution VA per person
Share in Share Contribution
to VA
1996 2002 1996 2001 2005 in 2001 to VA growth
growth
Non urban 13330 16808 39.3 10.6 15805 17732 37.6 5.4
Urban 18975 24124 60.7 16.7 23115 25743 62.4 8.4
(1) Urban agglomerations according to LLM classification in 1991. (2) Urban agglomerations according to LLM classification in 2001.What matters for urban (and economic)
growth? Specialization vs diversification
• Urban centers are increasingly service and
innovation prone centers more than
production sites
share of total share of total
employment 2001 employment 2011
urban non-urban urban non-urban
Industry (including construction) 27.89 40.56 23.13 34.99
Services 71.62 58.19 76.57 64.13
KIS 37.78 28.12 38.68 28.83
- KIS high tech 4.21 1.28 3.97 1.26
- market-oriented KIS 7.28 4.37 8.85 5.40
- financial KIS 3.76 2.19 3.62 2.24
- other KIS 22.52 20.28 22.24 19.93The dissolving advantage of industrial districts and the
increasing premia associated to diversified urban centers
• Industrial agglomerations (distretti industriali) have been
extensively studied (also at the Bank of Italy)
• In recent years the benefits of these agglomerations seem to have
diminished, while the advantages of urban agglomerations have
raised:
Di Giacinto et al (JOEG 2014) and Andini et al (RSUE 2014)
provide evidence on both firm productivity and wages
• Whether the urban supremacy can be entirely explained by the
cluster of services, or an industrial base is still necessary to push the
local demand for nontradables si an open question (see Glaeser
2011 and Moretti 2012)Cities are increasingly where high skill people
live …
share of total share contributions to growth
population by educational attainment by educational attainment
in 2011 in 2011 in 2011
Educational attainment by degree non-urban urban non-urban urban non-urban urban
Bachelor 8.9 13.4 35.0 65.0 76.4 124.5
High school 28.9 31.4 42.5 57.5 34.1 33.8
Middle school 30.6 28.8 46.1 53.9 3.2 -2.4
Primary school 21.9 18.4 48.9 51.1 -16.2 -19.3
None 9.7 8.0 49.6 50.4 -22.6 -13.7
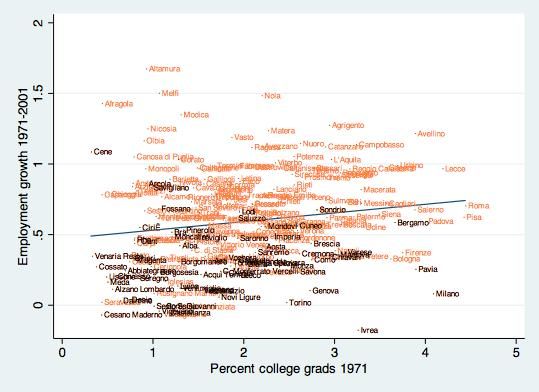
Notes: Residents above 6 years of age.… and high skill cities are the ones growing
moreCities accumulate more human capital mostly
by attracting the most skilled …
Graduates by residence (1) Share of graduates resident in urban areas
(percentage change)
Source: Istat, Indagine 2011 sull’inserimento professionale dei laureati.
Note: (1) Percentage change between the number of graduates resident in the 15 Italian main urban areas before enrollment and after graduation.… but not all cities are attracting:
the Mezzogiorno lacks of urban growth poles
Graduates by residence (1)
(percentage change)
Source: Istat, Indagine 2011 sull’inserimento professionale dei laureati.
Note: (1) Percentage change between the number of graduates resident in each urban area before enrollment and after graduation.Wages and cities
Wages and cities
(linear fit by education)
Source: ISTAT, LFS, 2008-2014, age group: 30-49The risk of rent dissipation: housing prices
differential across areas and within each LLM
geographical areas urban and non-urban areas
5,000
5,000
2,500
2,500
0
0
Centre-North South urban LLM non-urban LLM
gradient in metropolitan LLM gradient in metropolitan city
5,000
5,000
2,500
2,500
0
0
centre pheriphery centre pheripheryThe centre-pheriphery housing prices gradient
within each city(LLM) is not a constant feature
BARI BOLOGNA CATANIA FLORENCE
6000
6000
6000
6000
60
house price: % change wrt LLM average
4000
4000
4000
4000
40
2000
2000
2000
2000
0
0
0
0
0 20 40 60 0 20 40 60 0 20 40 60 0 20 40 60
20
GENOA MILAN NAPLES PALERMO
6000
6000
6000
6000
4000
4000
4000
4000
0
2000
2000
2000
2000
-20
0
0
0
0 20 40 60 0 20 40 60 0 20 40 60 0 0 20 40 60
ROME TURIN VENICE VERONA
6000
6000
6000
-40
6000
4000
4000
4000
4000
0 20 40 60
2000
2000
2000
distance from LLM centre (km)
2000
more congested LLMs less congested LLMs
0
0
0
0
0 20 40 60 0 20 40 60 0 20 40 60 0 20 40 60
• It does not exist in several • It is the steepest in the
depressed (South) centres most congested centresUrban incomes are overwhelmingly
“dedicated” to purchasing housing services
House prices and incomes
Total Non-urban Urban Metropolitan
LLMs LLMs LLMs
Core city
House price 2.021 1.438 2.474 3.005
House size 96,5 100,3 93,6 90,1
Average income (tax records) 21.225 18.044 23.364 24.598
(house price size)/income 9,2 8,0 9,9 11,0
Non-core city
House price 1.245 1.140 1.377 1.564
House size 101,0 102,1 99,6 94,9
Average income (tax records) 18.233 16.638 19.820 20.530
(house price size)/income 6,9 7,0 6,9 7,2Income inequality (within city) is
increasing with city density
.45
Gini index
.4
.35
0 500 1000 1500 2000 2500
population density
Centre-North South
Centre-North provinces South provincesRiferimenti bibliografici Antonio Accetturo, Michele Cascarano e Guido de Blasio (2015) “Evoluzione dei sistemi locali del lavoro e i confini delle città”. Manoscritto Antonio Accetturo, Andrea Lamorgese, Andrea Linarello e Andrea Petrella (2015) “Knowledge intensive services and manufacturing growth in Italian cities”. Manoscritto. Accetturo, Manaresi, Mocetti e Olivieri (2014) “Don't stand so close to me: the urban impact of immigration”, Regional Science and Urban Economics). Monica Andini, Guido de Blasio, Gilles Duranton e William C. Strange (2013) “ Marshallian labour market pooling: Evidence from Italy ”, Regional Science and Urban Economics, Elsevier, vol. 43(6), pages 1008-1022. Daria Ciriaci (2014) “ Does University Quality Influence the Interregional Mobility of Students and Graduates? The Case of Italy”, Regional Studies, Taylor & Francis Journals, vol. 48(10), pages 1592- 1608, October. Alberto Dalmazzo e Guido de Blasio (2011) “Amenities and skill-biased agglomeration effects: Some results on Italian cities”, Papers in Regional Science. Sabrina Di Addario e Andrea Lamorgese (2015) “Networks of inventors”. Manoscritto.
Lewis Dijkstra e Hugo Poelman (2012) “Cities in Europe: The new OECD-EC definition”, European
Commission Regional Focus 01/2012
(http://ec.europa.eu/regional_policy/en/information/publications/regional-focus/2012/cities-in-
europe-the-new-oecd-ec-definition)

Gilles Duranton e Diego Puga (2001) “Nursery Cities: Urban Diversity, Process Innovation, and the Life
Cycle of Products”, American Economic Review, American Economic Association, vol. 91(5), pages
1454-1477, December.

Valter Di Giacinto, Matteo Gomellini, Giacinto Micucci e Marcello Pagnini (2014) “Mapping local
productivity advantages in Italy: industrial districts, cities or both? ”, Journal of Economic Geography

Valter Di Giacinto, Giacinto Micucci e Alessandro Tosoni (2015) “La localizzazione dei Servizi ad alta
intensità di conoscenza (KIBS)”. Manoscritto.

Francesco Giffoni, Matteo Gomellini e Dario Pellegrino (2015) “Human Capital and Growth: the case of
Italian Cities”, manoscritto.

Edward L. Glaeser (2011) “Triumph of the City: How Our Greatest Invention Makes Us Richer, Smarter,
Greener, Healthier, and Happier”, Penguin.

Edward L. Glaeser e David C Maré (2001) "Cities and Skills," Journal of Labor Economics, University of
Chicago Press, vol. 19(2), pages 316-42, April.
Edward L. Glaeser, Jed Kolko e Albert Saiz (2001) "Consumer city," Journal of Economic Geography,
Oxford University Press, vol. 1(1), pages 27-50, January.

Andrea Lamorgese e Andrea Petrella (2015) “Il contributo delle città italiane alla crescita aggregata”.
Manoscritto.

Manzoli e Mocetti (2015) “I prezzi delle case e il gradiente centro-periferia: evidenze dalle città
Italiane”. Manoscritto.

Enrico Moretti (2012) The New Geography of Jobs, Houghton Mifflin Harcourt.
You can also read