COVID-19 longevity impact briefing Issue 020 - Tim Gordon, Matt Fletcher & Kishore Ananda Demographic Horizons team 2 June 2020 - Aon
←
→
Page content transcription
If your browser does not render page correctly, please read the page content below

COVID-19 longevity impact briefing
Issue 020
Tim Gordon, Matt Fletcher & Kishore Ananda
Demographic Horizons team
2 June 2020

Prepared by Aon

Introduction
As COVID-19 cases and deaths continue to rise, likely leading to significant media
coverage, this briefing aims to provide a balanced summary, in particular placing the     Summary
figures emerging in context.
                                                                                          ▪ Actual excess deaths to the week ended 22 May are materially higher than
                                                                                            official COVID-19 death counts with cumulative deaths in 2020 to date well
Information is emerging on a daily basis, so please                                         outside the range of the outcomes seen in recent years
(a) ensure that you have the latest version – see                                         ▪ In Italy, Spain and France, daily confirmed cases and deaths stabilised 2 to 3
    aon.com/unitedkingdom/retirement-investment/COVID-19/Demographic-Horizons-              weeks after lockdown and are now falling, although the rate of decline is lower
    COVID-19-longevity-impact, and                                                          than the initial rate of increase. This suggests that European-style social
                                                                                            distancing and lockdown
(b) bear in mind that the situation may have evolved since publication.
                                                                                              – is an effective strategy for inhibiting the spread of COVID-19, but
                                                                                              – initially at least, does not stop the spread of COVID-19 altogether.
In the UK, we have the benefit of Italy, France and Spain being ahead of us in terms of
COVID-19 outbreaks. Given that they have taken similar suppression measures at            ▪ The adjusted daily deaths figures suggest that the UK appears to be on a
equivalent stages of their own outbreak and have had similar experience to date, our        similar path to Italy in the short term.
primary approach for assessing the short-term outcome of COVID-19 is to review how        ▪ The impact on longevity for pension scheme members will additionally be
the UK is tracking these countries in terms of                                              affected by the indirect impact of COVID-19, including
▪ confirmed COVID-19 cases – potentially a leading indicator of what’s to come, but           – the health of the surviving population, and
  distorted by differences in testing practice both over time within countries and
                                                                                              – the economic, social and political consequences of tackling COVID-19
  between countries, and
                                                                                            In both of the above cases, the impact on longevity could be positive or negative.
▪ COVID-19 deaths – a relatively lagged indicator of what’s already happened, but
  more reliable when comparing experience over time and between countries.
We also have weekly total reported deaths for England & Wales from the ONS up to
22 May. These are more lagged than COVID-19 death counts (because there is an 11
day delay in publication of the ONS figures) but they are a much more reliable
indicator of actual mortality (because death recording is objective and regulated by
well-established and strongly-enforced processes).                                           Given the considerable uncertainty surrounding the data
We have two key observations:
                                                                                            available and projections of COVID-19, please seek advice
                                                                                           from Aon’s specialist Demographic Horizons team, via your
▪ Excess deaths to the week ended 22 May were higher than deaths mentioning
  COVID-19 on the death certificate, which in turn are higher than the widely
                                                                                          usual Aon consultant before making any decisions specifically
  disseminated counts based solely on hospital deaths                                              related to the longevity impact of COVID-19.
▪ The cumulative deaths in 2020 to 22 May are well outside the range of the
  outcomes seen in recent years

COVID-19 longevity impact briefing | Issue 020

Demographic Horizons team | 2 June 2020                                                                                             2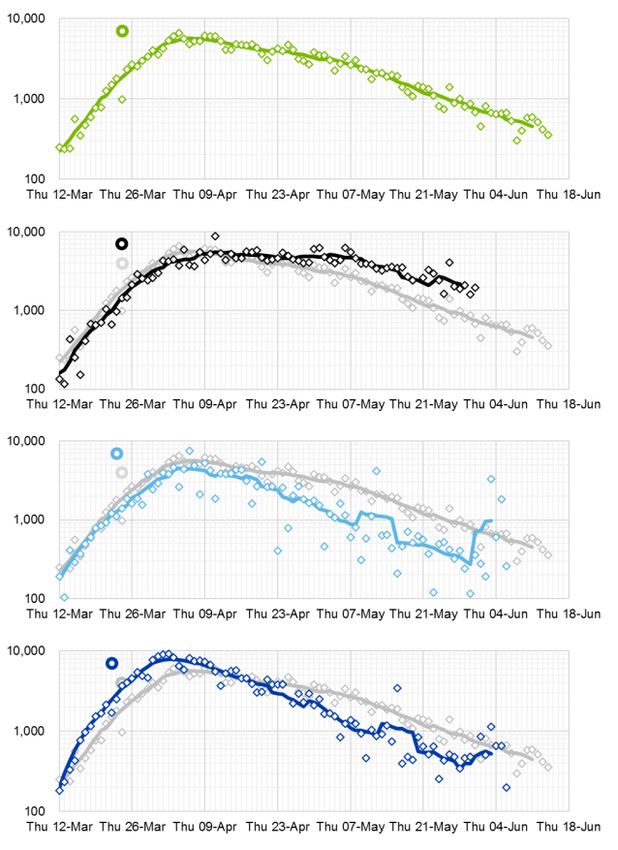
Weekly all cause deaths for England & Wales
This chart monitors cumulative weekly reported deaths in England          1
& Wales compared to the average for the previous three years.                           Cumulative deaths in calendar year v average for the
▪ The black line is 2020 compared with the average for 2017 to                                         previous three years
  2019.
▪ The grey shaded area shows the range of outcomes 2013 to
  2019 for comparison, with the dashed grey line representing the
  average. For example, the top of the grey area around 27 March
  relates to 2015 having around 20,000 more deaths to that date
  compared with the average over 2012-2014.

Observations
▪ The black line initially tracking towards the bottom of the shaded
  area shows that mortality at the start of 2020 was relatively light.
▪ In the week ending 27 March, significant numbers of deaths
  relating to COVID-19 started to be reported – the numbers were
  much higher in the following eight weeks.
▪ Deaths categorised by the ONS as ‘COVID-19’ are shown in red.
  There are 43,694 up to 22 May.
▪ ‘Non-COVID-19’ excess deaths are shown in yellow. The ONS
  indicated that 13,484 excess deaths up to 22 May were not
  categorised as COVID-19. (‘Excess deaths’ means additional
  deaths compared with 2020 proceeding from 13 March in line
  with previous average experience.)
▪ Up to week ending 22 May, total excess deaths are well outside
  the range of the outcomes seen in recent years.

                                                                         Data sources: Weekly reported deaths data published by the ONS up to week ending 22 May 2020.

COVID-19 longevity impact briefing | Issue 020

Demographic Horizons team | 2 June 2020                                                                                                  3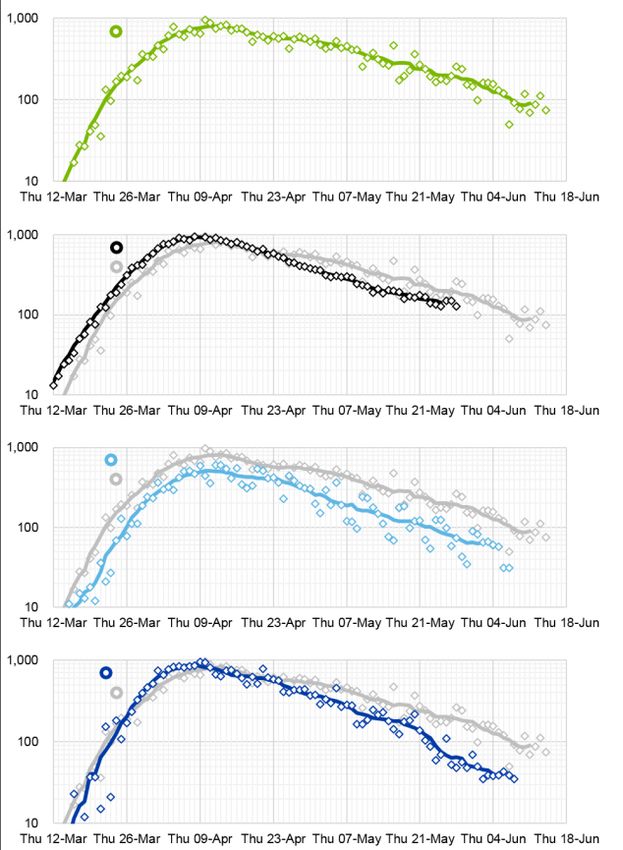
Actual ‘COVID-19’ deaths for England & Wales by age band

      2                       Total deaths by age band                                          3     Proportion of deaths by age band

These charts show the ‘Non-COVID-19’ and ‘COVID-19’ deaths reported in March and April 2020 by age band both in absolute terms and as a proportion of total deaths in each
age band. Note that these charts illustrate total rather than just excess deaths.

Observations
▪ ‘Non-COVID-19’ deaths are shown in yellow. The ONS indicated that 107,536 deaths in March and April 2020 were not categorised as relating to COVID-19
▪ Deaths categorised by the ONS as ‘COVID-19’ are shown in red. There were 33,365 such deaths in March and April 2020
▪ The first chart shows that both all-cause and ‘COVID-19’ deaths increase with age
▪ The second chart shows that the proportion of deaths attributed to ‘COVID-19’ remains stable at 20-25% within each age band for the age range relevant to pensioner
  populations (i.e. ages 55+)

Data sources: Weekly reported deaths data published by the ONS up to week ending 22 May 2020.
COVID-19 longevity impact briefing | Issue 020

Demographic Horizons team | 2 June 2020                                                                                          4
Actual ‘COVID-19’ deaths for England by IMD The Index of Multiple Deprivation (IMD) is a measure of deprivation 4 for small geographic areas, compiled and published by the Office Age standardised mortality rates as % difference for National Statistics (ONS) and based on various factors relating relative to the least deprived decile to deprivation. Using IMD allows us to investigate variation by socio-economic profile. We have banded IMD deciles into three broad socio- economic categories with ‘High’ being the least deprived and ‘Low’ being the most deprived. The chart shows age-standardised mortality rates relative to the least deprived (IMD decile 10) based on all deaths (grey) and ‘COVID-19’ deaths (red) reported in England between 1 March and 17 April 2020. Observations ▪ Age-standardised mortality rates based on all deaths are shown in dark grey whilst rates based on ‘COVID-19’ deaths are shown in red. ▪ As with all deaths the impact of COVID-19 increases with the level of deprivation. ▪ COVID-19 has had a proportionally greater impact in the most deprived category. The ‘COVID-19’ mortality rate for the ‘Low’ category is c.120% higher that the rate for the least deprived IMD decile. Data sources: Reported deaths by IMD between 1 Mar and 17 Apr 2020 published by the ONS ▪ The observed results of this analysis do not automatically mean that higher deprivation leads to higher impact of COVID-19 – for example, we also know that COVID-19 incidence is higher in cities which on average may have higher deprivation than other areas. COVID-19 longevity impact briefing | Issue 020 Demographic Horizons team | 2 June 2020 5
Daily confirmed cases and deaths by country
The charts show total daily confirmed cases and 5 Daily confirmed cases 6 Daily deaths
deaths. To aid comparison, the experience for other
countries has been time shifted such that the point in
time they had 500 confirmed cases matches the UK.
Testing and recording practices vary between countries Italy
and have changed over time, so firm conclusions
cannot necessarily be drawn from the data. (+14 days)
Observations
▪ In Italy, Spain and France, daily confirmed cases and
deaths stabilised 2 to 3 weeks after lockdown and UK
are now falling, although the rate of decline is lower
than the initial rate of increase. This suggests that
European-style social distancing and lockdown
– is an effective strategy for inhibiting the
spread of COVID-19, but
– initially at least, does not stop the spread of
COVID-19 altogether. France
▪ The adjusted daily deaths figures suggest that the (+6 days)
UK appears to be on a similar path to Italy in the
short term.
Spain
(+4 days)
Date of full lockdown ◇ Daily deaths ━ Weekly average daily deaths (lagged 3 days)
Data sources: European Centre for Disease Prevention and Control, Department of Health and Social Care, Public Health England and NHS England
COVID-19 longevity impact briefing | Issue 020
Demographic Horizons team | 2 June 2020 6Daily confirmed UK deaths
Italy (+14 days)
UK
(adjusted)
Full lockdown
◇ Daily deaths
━ Weekly average daily
deaths (lagged 3 days)
Data sources: European Centre for Disease Prevention and Control, Department of Health and Social Care, Public Health England and NHS England
COVID-19 longevity impact briefing | Issue 020
Demographic Horizons team | 2 June 2020 7Cumulative confirmed cases and deaths by country
Date of full
lockdown
7 Cumulative confirmed cases 8 Cumulative deaths
The charts show total cumulative confirmed cases and deaths. (This is a different presentation of the data underlying charts 5 and 6 on page 6 plus China and the USA.) To aid
comparison, the experience for other countries has been time shifted such that the point in time they had 500 confirmed cases matches the UK.
Testing and recording practices vary between countries and have changed over time, so firm conclusions cannot necessarily be drawn from the data.
Observations
▪ In Italy, Spain and France, cumulative confirmed cases and deaths stabilised 2 to 3 weeks after lockdown and are now flattening, although the rate of decline of daily cases
and deaths is lower than the initial rate of increase. This suggests that European-style social distancing and lockdown
– is an effective strategy for inhibiting the spread of COVID-19, but
– initially at least, does not stop the spread of COVID-19 altogether.
▪ The adjusted cumulative deaths figures suggest that the UK appears to be on a similar path to Italy in the short term.
Data sources: European Centre for Disease Prevention and Control, Department of Health and Social Care, Public Health England and NHS England
COVID-19 longevity impact briefing | Issue 020
Demographic Horizons team | 2 June 2020 8Appendix A. Specific data anomalies
The following is a list of data anomalies of which we are aware and, where applicable,
the adjustments we have made to the data.
1. Italy reported 90 new confirmed cases on 15 March and 6,230 on 16 March
suggesting a delay in reporting of cases relating to 15 March. The total number of
confirmed cases across these two dates has therefore been reallocated in line
with the observed pattern of emerging new cases during the preceding week.
2. The UK changed the timing definition of its daily death reporting on 25 March from
9 am to 5 pm and so the deaths figure for the UK on 25 March is for only an 8
hour period. No specific amendment has been made for this in our report.
3. France reported 2,028 additional deaths on 2-4 April that had occurred in nursing
homes over the past days and weeks. The French Government did not include
these deaths in their official count prior to this date, as their count only takes into
consideration deaths of hospitalized patients. For consistency with both the UK
data and the historic French data, these additional deaths have been removed.
4. Using deaths reported up to each date can give a less reliable picture than actual
deaths by date of death because of fluctuating reporting delays. For the UK we
have used scaled NHS England data to estimate UK deaths by date of death.
COVID-19 longevity impact briefing | Issue 020
Demographic Horizons team | 2 June 2020 9Aon Hewitt Limited Aon Hewitt Limited is authorised and regulated by the Financial Conduct Authority. Registered in England & Wales No. 4396810 Registered office: The Aon Centre | The Leadenhall Building | 122 Leadenhall Street | London | EC3V 4AN Aon Hewitt Limited does not accept or assume any responsibility for any consequences arising from any person using or relying on this material. Copyright © 2020 Aon Hewitt Limited. All rights reserved. COVID-19 longevity impact briefing | Issue 020 Demographic Horizons team | 2 June 2020 10
You can also read