The Future of Aging and its Impact on
Health Care: If We Live Healthier, Can We
               Live Longer?
         2 - 3 p.m. CDT | Sunday, June 6
←
→
Page content transcription
If your browser does not render page correctly, please read the page content below
The Future of Aging and its Impact on
Health Care: If We Live Healthier, Can We
Live Longer?
2 - 3 p.m. CDT | Sunday, June 6
Moderator
Jenny L. Boyer, MD, JD, PhD

Chair-Elect, AMA Senior Physicians
Section Governing Council

© 2020 American Medical Association. All rights reserved.
We take harassment and
                                                            conflicts of interest seriously.
                                                            Visit ama-assn.org/codeofconduct
                                                            to learn more.

                                                            Conduct Liaison for this meeting:
                                                            Lauren Robinson
                                                            lauren.robinson@ama-assn.org
                                                            (312) 464-4926

                                                            Confidential reporting:
                                                            lighthouse-services.com/ama
                                                            (800) 398-1496

© 2020 American Medical Association. All rights reserved.
Sponsored by the AMA’s
                          Senior Physicians
                          Section (SPS)

    Narayana Murali, MD
    Member since 2002

4
Speaker
S. Jay Olshansky, PhD
Professor, School of Public Health at the University of
Illinois at Chicago
Research Associate at the Center on Aging at the
University of Chicago and at the London School of
Hygiene and Tropical Medicine

 © 2020 American Medical Association. All rights reserved.
Speakers’ Disclosure
The content of this activity does not relate to
any product of a commercial interest as
defined by the ACCME; therefore, there are
no relevant financial relationships to disclose
at this time.

© 2020 American Medical Association. All rights reserved.
Objectives
Upon completion of this activity, the physician will be
able to:

• Assess recent estimates of the upper limits to human longevity
• Identify the most important risk factors for all the most common diseases
  associated with the biological process of aging
• Describe how to prevent or delay disease and disability.
• Examine the term “Longevity Dividend -- the social, economic, and health
  benefits that would accrue from successful efforts to slow aging in people.”
• Compare the pros and cons of altering the biological time clock.

  © 2020 American Medical Association. All rights reserved.
The future of aging and its impact on health
care: If we live healthier, can we live longer?
Daniel Perry
Richard A. Miller
Robert N. Butler

1
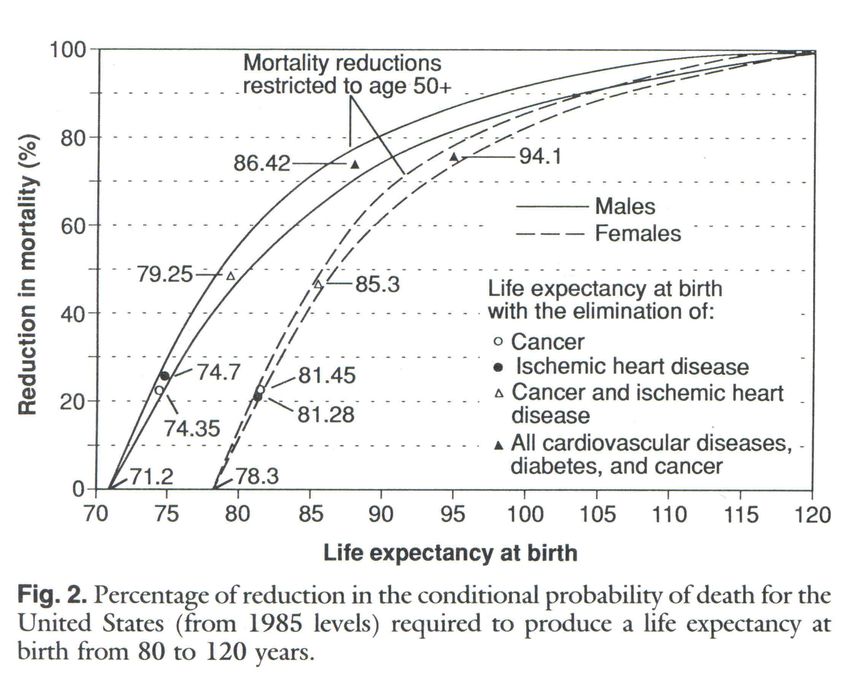
Source: Olshansky, Carnes and Cassel, 1990. Science.
Percentage reduction in death rates at all ages
 required to raise life expectancy at birth by
                   one year

    SOURCE: Olshansky, Carnes and Désesquelles, 2001.
    Prospects for Human Longevity. Science.
Seismic energy yield
7.0 – 7.1 = 200 kilotons
8.0 – 8.1 = 6 megatons
9.0 – 91 = 300
megatons
Richter Scale used
to measure energy
released during an
earthquake1687. Newton’s Law of Universal Gravitation
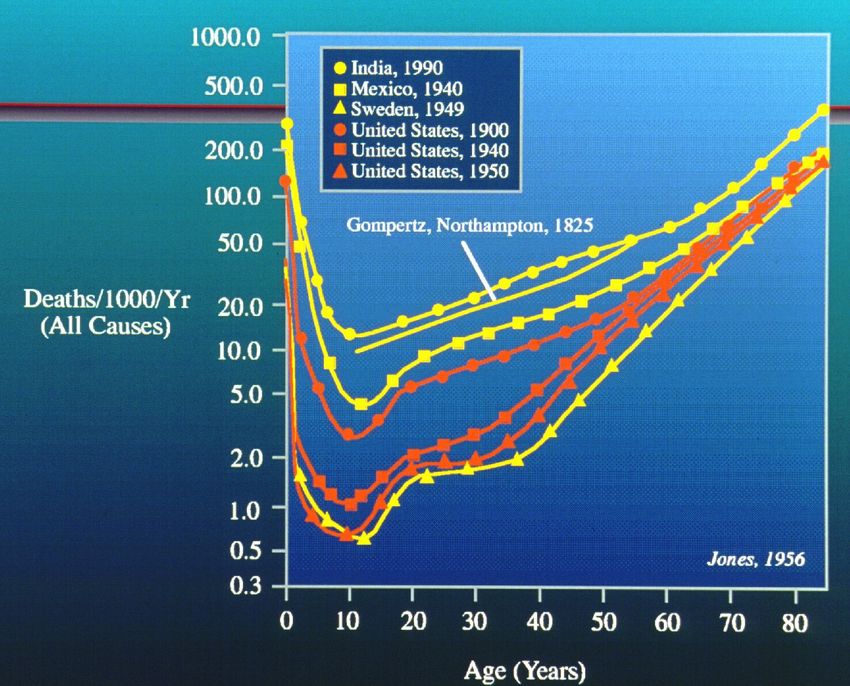
Gompertz (1825) – summarized in Olshansky and
Carnes (1997) Ever Since GompertzThe Bridge of Life The Chances of Death by Karl Pearson (1897)
Why does death occur
with such regularity?
"Nothing in biology makes
sense except in the light of
evolution."
Theodosius Dobzhansky
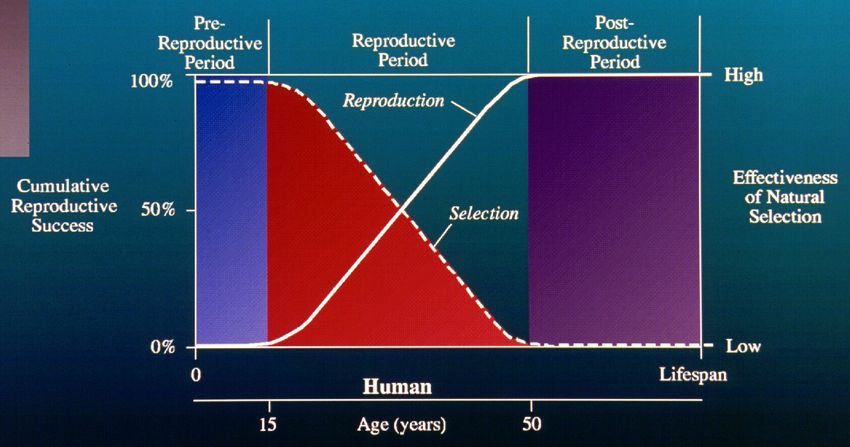
The American Biology Teacher, March 1973WHY Do We Age and Live as Long as We Do?
There is a remarkable consistency to the timing of death across species.
Duration of life is calibrated to the onset and length of a species’
reproductive window.
146,000 days
                                                                                     Greenland shark

                                                                       77,000 days
                                                                     bowhead whale
                                                       55,000 days
                                                        sea turtle

                          26,000 days
                           elephant

                                        45,000 days
                                        Human
             5,000 days                 (max)
                dog                     29,000 (avg)

1,000 days
  mouse
Olshansky, S.J. 2018. JAMA.320(13):1323-1324
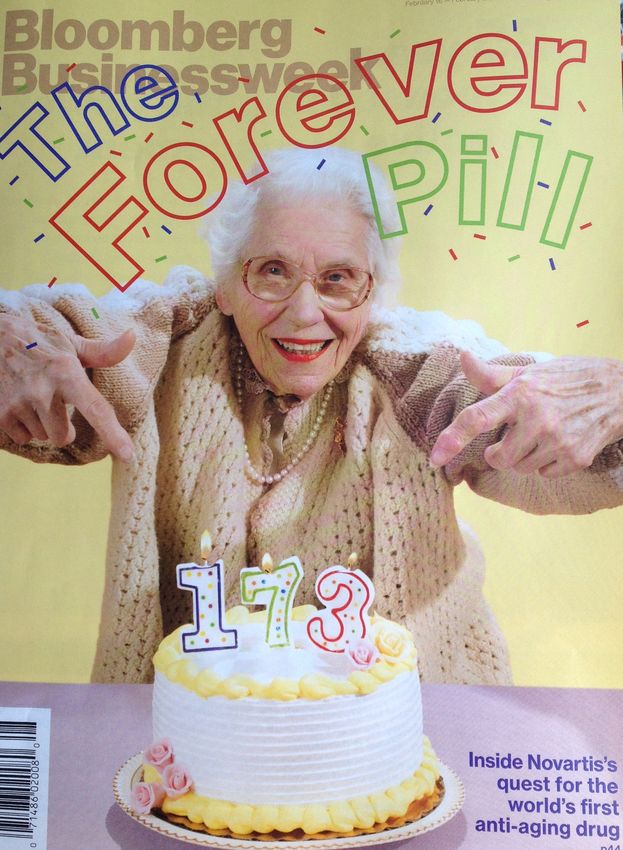
The Faustian Longevity Bargain
Faust’s Bargain
• Faust is disillusioned with his own limits
  to knowledge -- turns to suicide.

• Mephistopheles makes Faust an offer.
  Faust’s soul in exchange for unlimited
  knowledge and continuous youthful vigor.

• The story of Faust is a metaphor for a
  bargain that at first seems appealing,
  but with time is revealed to be a ruse.
The First Longevity Bargain

               The Offer
 • Declines in infant and child mortality
 • 30 years added to life expectancy at birth
 • Most get to survive past age 65

               The Price
 • Heart disease, cancer, stroke, Alzheimer’s, etc.
 • Dramatic increase in all fatal and disabling
   conditions of aging
 • An insatiable thirst for more longevity
The Latest Longevity Bargain
The Offer
• Reductions in cancer, stroke, and heart disease
• Incrementally smaller gains in longevity (weeks
and months)
• Decelerating increases in life expectancy
• Additional survival into extreme old age
The Price
• Our fears about Alzheimer’s disease and other
neurological conditions rising dramatically come true
• Increased prevalence and duration of frailty and
disability
• The Failures of Success becomes realityLogic Behind Longevity Dividend/Geroscience
• The timing of reproduction is
calibrated to the level of
hostility in the environment.
• Fixed genetic programs for growth and
development, reproduction, human body
design, and our life history are all byproducts.
77,000 days
1,000 days
• Duration of life is
calibrated to
reproduction and
limited by body design.Logic Behind Longevity Dividend/Geroscience
• Aging is an inadvertent
byproduct of fixed genetic
programs for early life events.
• In long-lived populations,
aging becomes the most
important risk factor for
the diseases and infirmities
linked to old age.
• Life extension caused
only by disease
reduction exposes the
saved population to an
elevated risk of aging
becoming an even more
powerful risk factor.Logic Behind Longevity Dividend/Geroscience
• Death is a zero sum game. When one
disease declines, another must rise –
known as competing risks or whack-a-
mole. It’s all about tradeoffs.
• Life expectancy will soon level
off or even decline as we
approach the limits of our body
design.
• We may be on the verge of an accelerated
increase in diseases we are most afraid of
– such as Alzheimer’sLogic Behind Longevity Dividend/Geroscience • A new paradigm in public health is required -- attack all fatal and disabling diseases at once by modulating the biological processes of aging. • Geroscience becomes the most effective method of primary prevention of all fatal and disabling diseases.
Do We Need to Know in Advance Which Scientific
 Pathways to the Longevity Dividend Will Work?

      Genetics of long-lived people

                          Caloric restriction

 Compounds with properties that
          appear to slow aging
Risk Factors for Heart Disease
100
80
Percent Increase
60
40
20
0
Hypertension Smoking Cholesterol Diabetes
Source: Aging as a Risk Factor. Kochanek KD, Xu J, Murphy SL, Miniño AM, Hsiang-Ching K (2011). Deaths: Preliminary Data from 2009. National
Vital Stats. Rep. (2009) 59(4):1-68. Change 1999 – 2009 in Deaths from Selected Diseases (comparison of data from Kochanek et al. (2011) Table 2 with
Heron et al (2009) Table 9). Heron M, Hoyert DL, Murphy SL, Xu J, Kochanek KD, Tejada-Vera B (2009). Deaths: Final data for 2006. .Natl Vital Stats.
Rep. 57(14):1-136. Interpreted as percentage increase in the risk of death for a specified disease independent of all other risk factors.Risk Factors for Heart Disease
6000
Percent Increase
4000
2000
0
Hypertension Smoking Cholesterol Diabetes Aging
Source: Aging as a Risk Factor. Kochanek KD, Xu J, Murphy SL, Miniño AM, Hsiang-Ching K (2011). Deaths: Preliminary
Data from 2009. National Vital Stats. Rep. (2009) 59(4):1-68. Change 1999 – 2009 in Deaths from Selected Diseases
(comparison of data from Kochanek et al. (2011) Table 2 with Heron et al (2009) Table 9). Heron M, Hoyert DL, Murphy SL,
Xu J, Kochanek KD, Tejada-Vera B (2009). Deaths: Final data for 2006. .Natl Vital Stats. Rep. 57(14):1-136.Risk Factors for Cancer
40
Percent Increase
30
20
10
0
Smoking Alcohol Diet Infection
Source: Aging as a Risk Factor. Kochanek KD, Xu J, Murphy SL, Miniño AM, Hsiang-Ching K (2011). Deaths: Preliminary
Data from 2009. National Vital Stats. Rep. (2009) 59(4):1-68. Change 1999 – 2009 in Deaths from Selected Diseases
(comparison of data from Kochanek et al. (2011) Table 2 with Heron et al (2009) Table 9). Heron M, Hoyert DL, Murphy SL,
Xu J, Kochanek KD, Tejada-Vera B (2009). Deaths: Final data for 2006. .Natl Vital Stats. Rep. 57(14):1-136.Risk Factors for Cancer
6000
5000
Percent Increase
4000
3000
2000
1000
0
Smoking Alcohol Diet Infection Aging
Source: Aging as a Risk Factor. Kochanek KD, Xu J, Murphy SL, Miniño AM, Hsiang-Ching K (2011). Deaths: Preliminary
Data from 2009. National Vital Stats. Rep. (2009) 59(4):1-68. Change 1999 – 2009 in Deaths from Selected Diseases
(comparison of data from Kochanek et al. (2011) Table 2 with Heron et al (2009) Table 9). Heron M, Hoyert DL, Murphy SL,
Xu J, Kochanek KD, Tejada-Vera B (2009). Deaths: Final data for 2006. .Natl Vital Stats. Rep. 57(14):1-136.Risk Factors for Alzheimer’s Disease
600
500
Percent Increase
400
300
200
100
0 x
oE
t
g
s
ac
Se
te
in
Ap
be
In
ok
Sm
ys
ia
D
Ph
Source: Aging as a Risk Factor. Kochanek KD, Xu J, Murphy SL, Miniño AM, Hsiang-Ching K (2011). Deaths: Preliminary
Data from 2009. National Vital Stats. Rep. (2009) 59(4):1-68. Change 1999 – 2009 in Deaths from Selected Diseases
(comparison of data from Kochanek et al. (2011) Table 2 with Heron et al (2009) Table 9). Heron M, Hoyert DL, Murphy SL,
Xu J, Kochanek KD, Tejada-Vera B (2009). Deaths: Final data for 2006. .Natl Vital Stats. Rep. 57(14):1-136.Risk Factors for Alzheimer’s Disease
100000
80000
Percent Increase
60000
40000
20000
0
x
oE
t
g
ng
s
ac
Se
te
in
i
Ap
be
In
Ag
ok
Sm
ia
ys
D
Ph
Source: Aging as a Risk Factor. Kochanek KD, Xu J, Murphy SL, Miniño AM, Hsiang-Ching K (2011). Deaths: Preliminary
Data from 2009. National Vital Stats. Rep. (2009) 59(4):1-68. Change 1999 – 2009 in Deaths from Selected Diseases
(comparison of data from Kochanek et al. (2011) Table 2 with Heron et al (2009) Table 9). Heron M, Hoyert DL, Murphy SL,
Xu J, Kochanek KD, Tejada-Vera B (2009). Deaths: Final data for 2006. .Natl Vital Stats. Rep. 57(14):1-136.Facilitator Jenny L. Boyer, MD, JD, PhD Chair-Elect, AMA Senior Physicians Section Governing Council © 2020 American Medical Association. All rights reserved.
Questions from Audience Members

52
If you have questions, contact
                                            Alice Reed, Group Manager,
                                          AMA Senior Physicians Section
                                                            alice.reed@ama-assn.org

© 2020 American Medical Association. All rights reserved.
You can also read