Gurit 1HY 2017 Results - Zurich, August 18, 2017
←
→
Page content transcription
If your browser does not render page correctly, please read the page content below
Gurit 1HY 2017 Results

Zurich, August 18, 2017
This presentation may include forward-looking statements that reflect the
 intentions, beliefs or current expectations and projections of Gurit Holding
 AG about the future results of operations, financial condition, liquidity,
 performance and similar circumstances.

 Such statements are made on the basis of assumptions and expectations
 which may prove to be erroneous, although Gurit Holding AG believes
 them to be reasonable at this time.

Slide 2                                                                         Corporate
Gurit Strategy 2021

Gurit Strategy 2021
Sales Growth Ambition by 2021 at ca. CHF 500 million
Organic – ca. CHF 450 million
Acquisitive – target CHF 50 million
Operating Profitability Ambition by 2021 is to maintain 8-10% RoS
Key Markets for Gurit Advanced Composites
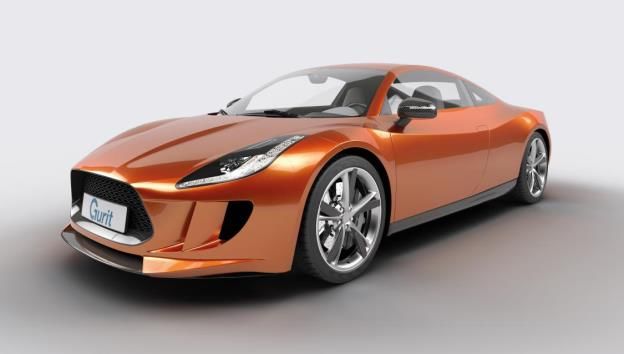
Wind, Aerospace and Automotive – 3 key strategic growth markets
Marine and Industrial – 2 key niche markets
Shareholder Dividend Pay-out Ratio
Pay-out ratio of 30-40% of NIAT per annum
Slide 4 Corporate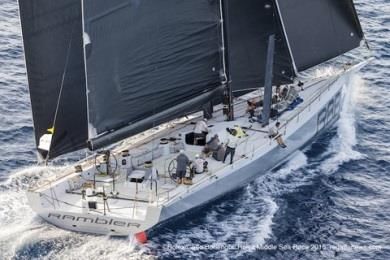
Key Strategic Achievements 1HY 2017
Product Range:
Integration of Volpiano PET business
Licensing agreement for patented Armacell recycled PET technology
JV for balsa wood production in Asia-Pacific
Renewal of distribution agreement for Maricell PVC
Aero: Additional OEM material qualification completed
Tooling:
Acquisition of PH Windsolutions (wind & aero automation solutions)
Set-up of another larger production hall in Taicang, China
Winning of a new major wind OEM
Automotive Components: growth effect from new contract wins setting in
Slide 5 Corporate
Gurit 1HY 2017 Business Update
Key Business Notes 1HY 2017
Profitability & Growth:
Operating profit margin at 12% of net sales for 1HY 2017
Slight dip in net sales due to challenging market environment
Wind market decline in India, other regions fair and in line with expectations
Aero business growing single-digit ahead of additional OEM qualification
Marine and Industrial EMEA hurt by ongoing weak demand
Tooling above expectations with slight growth over 2016 record year
M&A:
PH Windsolutions strengthens Tooling offering and provides for new
opportunities in the aerospace automation market
Slide 7 Corporate
Key Financial Notes 1HY 2017
Net Sales: -0.5% (-3.9% in reported CHF) to CHF 175m (1HY 2016: CHF 182m)
Op. Profit and RoS: CHF 21.2m (1HY 2016: CHF 19.1m) and 12.1% operating
profit margin (1HY 2016: 10.5%)
Net Profit of CHF 15.3m (1HY 2016: CHF 14.1m)
Equity Ratio solid at 77.5% (1HY 2016: 72.9%)
Investment lower in 1HY 2017:
Capex of CHF 4.0m (1HY 2016: CHF 7.5m): mainly Tooling and production
equipment replacement & upgrading
Slide 8 Corporate
Development by Key Markets

Wind Energy – Market Environment
GWEC Projected Global Annual Capacity*
80
70
63 54.6 59.4 60.9 64.7
60 Americas
52
40 Asia /
Pacific
20
EMEA
0
2014 2015 2016 2017 2018 2019 2020
* Source: GWEC Global Wind Statistics February 10, 2017
GWEC Outlook revised after 2016 drop in newly installed capacity
India much weaker as of Q2-2017, recovery expected for Q4-2017
Low single digit growth expected for 2017, Gurit estimation for newly installed wind
capacity globally for FY 2017 remains at some 57 GW
Slide 10 CorporateWind Energy Materials – Results & Outlook
Results & Achievements 1HY 2017
Net sales: CHF 69.1m (1HY 2016: CHF 73.5m)
Decline by -3% (currency-adjusted) due to weaker
Asian market; Europe and North America at a fair
level but not able to compensate the shortfall in
Asia (India)
Operations: Balsa JV in Indonesia signed to
secure sourcing from the Asian-Pacific region
MCHF Wind Energy: Quarterly Net Sales
Focus 2HY 2017: 50
40.8 39.1 39.8 39.1
Set up new Balsa capacity 40 33.7 36.4 36.1
33
Win additional PET business 30
Win additional Balsa business 20
10
0
Q3 Q4 Q1 Q2 Q3 Q4 Q1 Q2
2015 2016 2017
Slide 11 CorporateTooling – Results & Outlook
Results & Achievements 1HY 2017
Net sales: CHF 35.6m (1HY 2016: CHF 36.8m)
Increase by 0.5% (currency-adjusted) over 2016
record year level, mainly due to multi megawatt
demand in China
Operations: Factory expansion in Taicang, China
Focus 2HY 2017:
Stronger 2HY 2017 expected MCHF Tooling: Quarterly Net Sales
Finalize integration of PH Windsolutions 30
Gain additional mould orders for the 20.5 20.4
20 16.8 15.9 16.3 18
European production site 14.2 15.2
Win another new major European-based client 10
for 2018
0
Q3 Q4 Q1 Q2 Q3 Q4 Q1 Q2
2015 2016 2017
Slide 12 CorporateAerospace – Market Environment
Aircraft Deliveries by Type*
750 688
629 635 A380
500 A350
306
A330
250
Single
0 aisle
2014 2015 2016 1HY
2017
* Source: Airbus Order Book
Commercial aerospace market expected to continue to grow at a CAGR of 4.6% to 2020
according to DTTL / Deloitte Global
Combined Airbus & Boeing order books show backlog of >12.000 aircraft, equivalent to
8-9 years of production
Slide 13 CorporateAerospace – Results & Outlook
Results & Achievements 1HY 2017
Net sales: CHF 25.1m (1HY 2016: CHF 24.3m)
Increase by 3.3% due to stronger build rates and
demand situation in Europe
Operations: Material qualification for another global
aerospace OEM achieved
New product development with better
price/performance ratio bearing fruit in Europe MCHF Aerospace: Quarterly Net Sales
20
Focus 2HY 2017: 12.6 11.7 12.7
13.8
11.5 10.6 11.3
Set up supply chain for new OEM program, achieve 9.2
10
first smaller revenue contributions
Further enhance and broaden product offering
0
Q3 Q4 Q1 Q2 Q3 Q4 Q1 Q2
2015 2016 2017
Slide 14 CorporateOther Material Markets – Market Environment
Market demand
European Marine luxury and leisure markets show continued low build rates.
Automotive material qualifications positive, market growth yet still low.
Other material markets (construction and industrial): project-driven business hit by
ongoing liquidity crunch in the MEA region
Slide 15 CorporateOther Material Markets – Results & Outlook
Results & Achievements 1HY 2017
Net sales: CHF 35.5m (1HY 2016: CHF 38.2m)
Decrease by -7.1% due to continued hesitant order
situation in the European marine sector as well as a
lack of large builds in industrial markets due to end
customer situation in MEA
Automotive materials with slight single-digit growth,
yet on a low overall level
Focus 2HY 2017: MCHF Other Material Markets:
Automotive materials: keep pushing for new 30 Quarterly Net Sales
customers and projects
20.4 20.1
Marine & Industrial: no sign of fundamental 20 16.5 18.1 17.4 17.6 17.9
market growth 13.5
Continued market development and support 10
activities for new material markets
0
Further enhancement and broadening of Q3 Q4 Q1 Q2 Q3 Q4 Q1 Q2
product offering 2015 2016 2017
Slide 16 CorporateComposite Components – Results & Outlook
Results & Achievements 1HY 2017
Net sales: CHF 9.8m (1HY 2016: CHF 9.4m)
Increase of 14.8% (currency-adjusted) as a result of
newly won business
Operations: Ramp up for additional series
production programs
Focus 2HY 2017:
Participate in increased bidding activities MCHF Composite Components:
and win further orders Quarterly Net Sales
10
Further deploy industrialization of production
process (until mid-2018) 5.9 5.6 5 4.4 4.7 4.8 5
Deploy new material ranges to lower cost per 3.3
component
0
Q3 Q4 Q1 Q2 Q3 Q4 Q1 Q2
2015 2016 2017
Slide 17 CorporateFinancial Results 1HY 2017
Net Sales Analysis by Markets
Net sales in MCHF
177.8 181.6 182.3 169.7 175.2 Overall slight net sales
reduction mainly from
Composite Materials mainly
due to soften Asian wind
energy demand
Composite Materials
presented with mixed market
1HY 2015 2HY 2015 1HY 2016 2HY 2016 1HY 2017 conditions
Materials Components Tooling
Composite Components
back on growth track
Net salesx 1HY 2017 1HY 2016 ∆ 1HY 2017 ∆ 1HY 2017 Tooling on target
in MCHF vs 1HY 2016 vs 1HY 2016
FX adj.
Wind Energy 69.1 73.5 -5.9% -3.0%
Other Material markets 60.6 62.5 -3.1% -0.4%
Composite Materials 129.7 136.0 -4.6% -1.8%
Composite Components 9.8 9.4 4.3% 14.8%
Tooling 35.6 36.8 -3.3% 0.5%
Total Net Sales 175.2 182.3 -3.9% -0.5%
Slide 19 CorporateOperating Profit and EBIT Development
Operating profit (% Net sales)
Operating profit at 12.1%
RONA (incl. Goodwill)
above medium term target of
RONA (excl. Goodwill)
8 - 10% of net sales.
21.1%
18.2% 17.7%
Main positive drivers:
16.4%
14.2% 18.3%
Favorable business line
15.9% 15.4%
and product mix
14.3%
12.4% Marked improvement in
Composite
12.1%
10.5%
10.4%
9.5%
Components earnings
8.9%
Operational efficiency
1HY 2HY 1HY 2HY 1HY improvements
2015 2015 2016 2016 2017
Positive RONA trend
continued based on
increased operating profit on
a stable asset basis
Slide 20 CorporateOperating Profit Bridge 1HY 2016 to 1HY 2017
25
in MCHF
12.1%
0.9
20 10.5%
2.5
-1.0 -1.0
3.4
-2.9
15 -0.8 1.0
21.2
10
19.1
5
0
Operating Volume and Sales price Material Material Operational Bad debts One-offs Other Operating
profit 1HY product mix changes, price usage efficiencies (Delta 1HY effects profit 1HY
2016 net changes, efficiencies and loading 17 / 1 HY 16) 2017
net
Slide 21 CorporateIncome Tax Expenses
in MCHF
6
25%
5
21% 0.9
0.3 -0.4
4
3
5.1
2 4.3
1
0
Tax expense at Not Other Not Actual tax
average expected capitalized effects, recoverable expense
rates tax losses net WHT on IC
dividends
Income tax expenses burdened by unfavorable effects from not capitalized tax
losses and not recoverable taxes on intercompany dividends.
Slide 22 CorporateProfit and Loss
Consolidated P&L 1HY 2017 1HY 2016 Variance
MCHF % NS MCHF % NS MCHF %-pts
Net sales 175.2 100.0% 182.3 100.0% -7.1 0.0%
Gross margin 92.7 52.9% 94.0 51.6% -1.3 1.3%
Personnel expenses -40.4 -23.1% -42.2 -23.1% 1.8 0.1%
Other expenses -31.1 -17.7% -30.2 -16.6% -0.8 -1.2%
Operating profit before one-offs 21.2 12.1% 21.6 11.8% -0.4 0.3%
One-off items 0.0 0.0% -2.5 -1.4% 2.5 1.4%
Operating profit 21.2 12.1% 19.1 10.5% 2.1 1.6%
Financial & exchange result -0.8 -0.4% -0.4 -0.2% -0.4 -0.2%
Taxes -5.1 -2.9% -4.6 -2.5% -0.5 -0.4%
Net result 15.3 8.7% 14.1 7.7% 1.2 1.0%
Earnings per bearer share CHF 32.78 CHF 30.16
Improved Operating profit margin and Net result mainly driven by favorable
Gross Margin in % of Net Sales and overall reduced personnel expenses.
Earnings per bearer share increased by 8.7%.
Slide 23 CorporateBalance Sheet
Consolidated Assets Jun 2017 Dec 2016 Variance
MCHF % MCHF % MCHF %
Cash and cash equivalents 32.9 13% 38.6 16% -5.7 -2%
Trade receivables 64.2 26% 61.3 25% 2.9 1%
Inventories 51.6 21% 46.2 19% 5.4 2%
Other current assets 20.9 8% 20.5 8% 0.4 0%
Deferred income tax assets 2.6 1% 2.9 1% -0.3 0%
Property, plant and equipment 70.2 28% 73.0 29% -2.7 -1%
Intangible assets 5.8 2% 5.8 2% 0.0 0%
Other non-current assets 1.1 0% 0.8 0% 0.2 0%
TOTAL ASSETS 249.3 100% 249.1 100% 0.2 0%
Consolidated Liabilities and Equity Jun 2017 Dec 2016 Variance
MCHF % MCHF % MCHF %
Borrowings 0.2 0% 1.4 1% -1.2 0%
Trade payables 25.0 10% 22.7 9% 2.3 1%
Other current liabilities 25.8 10% 29.3 12% -3.5 -1%
Deferred income tax liabilities 3.3 1% 2.6 1% 0.8 0%
Provisions 1.7 1% 2.1 1% -0.4 0%
Other non-current liabilities 0.0 0% 0.1 0% -0.1 0%
Equity 193.2 77% 190.8 77% 2.4 1%
TOTAL LIABILITIES AND EQUITY 249.3 100% 249.1 100% 0.2 0%
Trade working capital remains at 26% of annualized net sales (2016 year-end: 24%)
Solid balance sheet: Net cash of CHF 33m, Equity ratio of 77.5% and Quick Ratio of 227%
Slide 24 CorporateCash Flow
Consolidated Cash Flow 1HY 2017 1HY 2016 Change
MCHF MCHF MCHF
EBIT 21.2 19.1 2.1
Depreciation, amortisation, impairment 5.0 7.0 -2.0
Change in working capital -11.4 -7.3 -4.1
Other cash flow from operating activities -3.7 -6.2 2.5
Net cash flows from operating activities 11.1 12.6 -1.5
Purchase of PPE and Intangibles -4.0 -7.5 3.5
Proceeds from sale of PPE 0.1 0.0 0.0
Free Cash flow 7.1 5.1 2.0
Change in borrowings -1.2 -5.1 3.9
Distribution to shareholders -9.3 -7.0 -2.3
Loans granted, net of repayments -0.3 -0.4 0.1
Purchase of treasury shares -0.9 -0.6 -0.3
CHANGE IN CASH AND CASH EQUIVALENTS -4.7 -8.0 3.4
Free cash flow improved by MCHF 2 compared to prior half year
Low capital expenditures in 1HY 2017, with an anticipated increase in 2HY
Further reduction of borrowings
Slide 25 CorporateFinancial Results 1HY 2017 Conclusion
Outlook FY 2017 (Confirmed)
Net Sales
Low single-digit level revenue growth expected for FY 2017 on
assumption of wind India recovery in Q4-2017
Operating Profitability
Operating profit margin is expected to reach the upper end of the
guided range of 8 to 10 percent of net sales, including an anticipated
non-recurring one-time expense in the range of around 1% of annual
operating profitability.
Slide 27 CorporateQuestions & Answers
You can also read