7th Annual Latam CEO Conference - ITAU

Page created by Calvin Schroeder
 
CONTINUE READING
7th Annual Latam CEO Conference - ITAU
May 2012

7th Annual Latam CEO
Conference
ITAU
7th Annual Latam CEO Conference - ITAU
Agenda

         Company overview

         Financial results

         Projects under development

                                      2
7th Annual Latam CEO Conference - ITAU
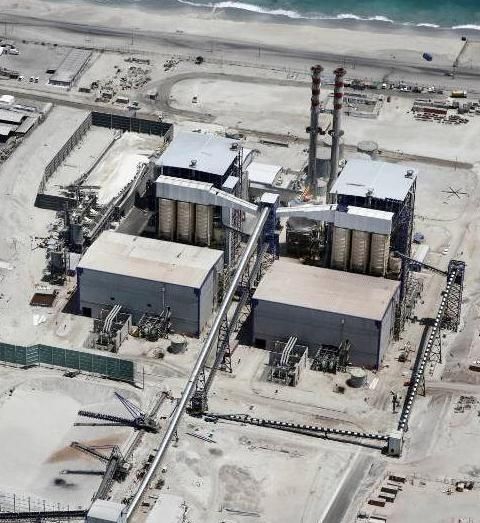
Mature and stable energy sector with investor
                         Company overview                                      friendly regulatory framework

    Structure of Chile’s energy sector
                              Market share            Expected growth              Clients         Generation by fuel
                                                                                                                   2                             Main players
                                                        (2012-2018)1                                     type                                (% of installed capacity)

                                                          6.5%
 SING                        25% capacity
                             26% demand
                                                                           90%        10%           70%            4%      26%      47%      32%        21%         -         4,580
                                                                         un- regulated regulated   Coal           Diesel Gas/LNG    ECL      Gener     Endesa     Others       MW

SIC
           Santiago          74% capacity                 5.8%
                                                                                                   44%                               41%       20%        17%           22%   12,480
                             73% demand                                                            Hidro                            Endesa    Colbun      Gener      Others    MW

                                                                           40%        60%           3%     8%     22%      23%

                                                                         Un-regulated regulated    Others Diesell Coall   Gas/LNG

                                                         SING highlights
      Aysén and              1%        capacity
      Magallanes
                             1%        demand             Close to 100% of installed capacity based on coal, diesel and gas (including LNG). No
                                                           exposure to hydrology.
                                                          Unregulated clients (mainly mining co’s) represent over 90% of total demand
                                                          6.5% expected CAGR in physical sales for 2012-2018
                                                                                                                                                                                   3
Sourde: CNE, CDEC-SIC, CDEC-SING, E.CL
¹ Based on internal projections; ² gross generation
7th Annual Latam CEO Conference - ITAU
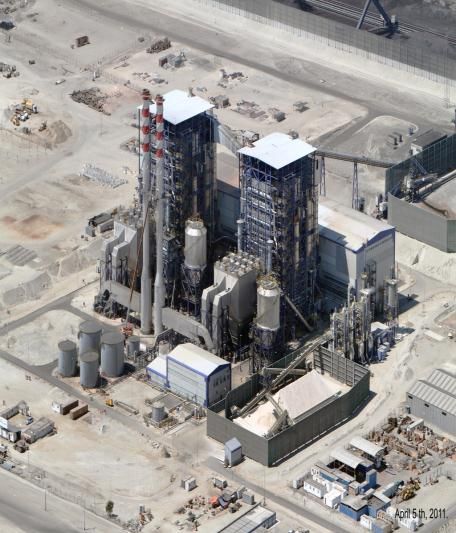
One of the most traded shares in
             Company overview                                                   the Santiago Stock Exchange
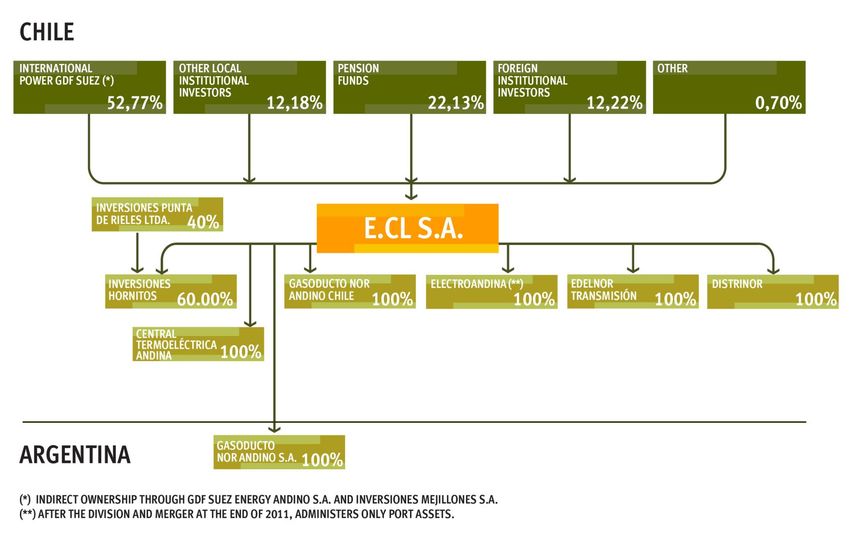
Ownership structure

   (*) Indirect ownership through GDF Suez Energy Andino S.A. and Inversiones Mejillones S.A.
   (**)After its division and merger with E.CL at the end of 2011, Electroandina kept port assets only

                                                                                                                  4
7th Annual Latam CEO Conference - ITAU
SING:
           Company overview         installed capacity and generation mix

317

200

488

339                 24
                         227
              250

                         518
781           531

                         277   21
      10      158

                                                                            5
7th Annual Latam CEO Conference - ITAU
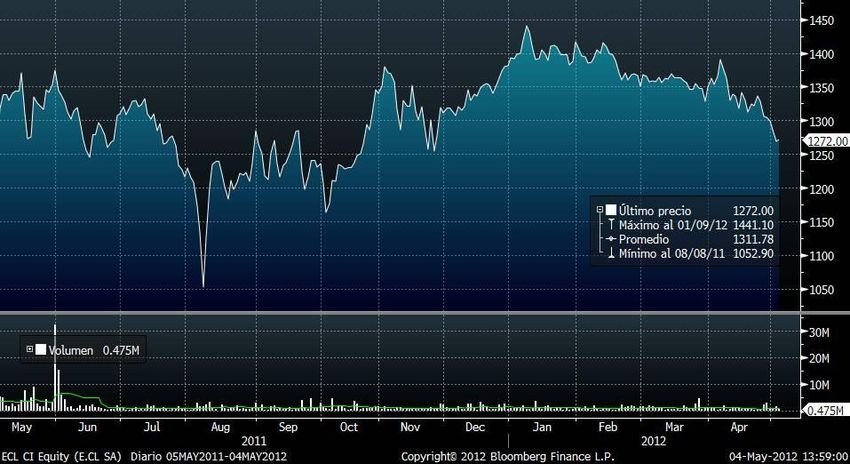
Strong project pipeline....
   Company overview

Current and expected base capacity (MW)

2500                      Approx. 200MW commited LNG
                          capacity to supply EMEL,
                           starting 2012;

                          Availability to commit remainder
                                                                  375                 2.146
2000                      gas capacity at LNG market
                          price beyond 2012.

                                                       651
                                                                        Environmental approval for
                                                                        2 x 375MW coal fired
1500               339 MW of                                            power plant in Mejillones +
                   base-load coal                                       a port facility
                   generation in 2011

                                    339
1000

                790

 500

   0
           Current coal and       CTA/CTH              LNG      Mejillones        Expected base       6
            hydro capacity                                                         load capacity
7th Annual Latam CEO Conference - ITAU
Largest electricity supplier in Chile’s
                      Company overview                                                   northern grid (SING)

Installed Capacity
(~ 50% market share)

Installed capacity                                      E.CL assets

                                                                                                      Technology
15%                                         1%                                                          Coal
Diesel                                      Hydro                                                       Diesel/FO
& F.O.                                                                                                  Natural gas
                                                        Chapiquiña (10MW)                               Hydro

                                                        Diesel Arica (14MW)

32%                                         52%
                                                        Diesel Iquique (43MW)
Gas/                                         Coal
Diesel
                                                        TE Tocopilla (1,004MW)                 Collahuasi
                   2,135
                    MW                                  Tocopilla puerto                       El Abra
                                                                                              Chuquicamata
                                                        C. Tamaya (104MW)
                                                                                            Gaby
                                                                                                                       Gas transmission and
                                                        Mantos Blancos1 (29MW)
                                                                                                                      distribution operations

                                                        TE Mejillones (592MW)
                                                                                               Escondida
                                                        CT Andina (169MW)
                                                                                                                                  Norandino pipeline to
                                                                                      2,461 kms of high voltage                   Agentina (Salta region)
                                                        CT Hornitos (170MW)               transmission lines

                                                                                                                                                            7
   ¹ 1 Owned by a mining company but operated by E-CL
7th Annual Latam CEO Conference - ITAU
One of E.CL’s most relevant events in 2011 was
              Company overview                     the start-up of the Andina (CTA) and Hornitos
                                                          (CTH) power plants in Mejillones

Central Termoeléctrica Andina (“CTA”)

                              Characteristics

                              Gross capacity         168.8 MW

                              Location               Mejillones

                              Total capex (inc.
                                                    US$496mm
                              contingencies)
                                                      July 15,
                              COD
                                                       2011
                                                                  Central Termoeléctrica Hornitos (“CTH”)
                                                     Codelco:
                              Contract              150MW / 21
                                                       years                                     Characteristics

                              Ownership                100%                                      Gross capacity      170.1 MW

                                                                                                 Location             Mejillones

                                                                                                 Total capex (inc.
                                                                                                                     US$380mm
                                                                                                 contingencies)

                                                                                                 COD                 Aug 5, 2011
                                                                                                                      Esperanza:
                                                                                                 Contract            150MW / 15
                                                                                                                        years
                                                                                                 Ownership              60%

                                                                                                                                   8
7th Annual Latam CEO Conference - ITAU
Long – term contracts with creditworthy
                                     Company overview                                                        customers

Average demand (MW) and remaining life (years) of current contracts

    Contracts as of 31.12.2011
    Contracts in effect since 01.01. 2012

                         500
                                                                                                                                         Codelco (A+)
                                                                                              Contracts average
                         450
                                                                                              remaining life of 10
                                                                                                    years
                         400

                         350

                                                                                                                                               Emel
                         300
                                                                                                                                               (BBB)

                         250
   Avergae demand (MW)

                         200

                         150
                                                                      Freeport-MM
                                                                          (BBB)           Barrick (A-)
                         100
                                                       BHP Billiton                                                         Antofagasta plc
                                               Other
                          50                                                    Xstrata
                           SQM            Anglo                                  (BBB)
                                         American
                           0
                               1.0                  4.0                       7.0                     10.0                 13.0               16.0
                                                                                     Remaining life of contracts (years)

                                                                                                                                                        9
7th Annual Latam CEO Conference - ITAU
Agenda

         Company overview

         Financial results

         Projects under development

                                  10
Strong 2011 results due to increased physical
                                                   energy sales, higher average monomic price
                      Financial results                and higher non – recurring earnings

                  US$ millions                                    2010                    2011                   Var %

Operating revenues                                               1,121.0                 1,256.6                  12%

Operating income                                                  240.2                   254.8                    6%

EBITDA                                                            337.8                   368.3                    9%

Non-recurring earnings                                             42.5                    52.3                   23%

EBITDA without non-recurring earnings                             295.3                   316.3                    7%

Total non operating results                                        4.7                    (29.1)                 (720%)

Net income                                                        200.2                   178.6                  (11%)

Energy sales(GWh)                                                 7,335                   7,480                    2%

 The company’s revenues increased due to an increase in physical electricity sales and a higher average realized monomic price.
 Net income decreased by 11% due to an increase in interest expense and a negative variation in foreign exchange differences.
 Despite temporary outages of some of our coal-fired plants in the 4Q, 2011 EBITDA increased due to the contribution of the new CTA
  and CTH power plants and significant non-recurring earnings.
 Non-recurring earnings were primarily related to compensations from gas producers in 2010 and liquidated damages on plant
  construction delays in 2011.
                                                                                                                                   11
After - tax income reached US$ 40.1
                                                                million in 1Q12. This represented an 18%
                      Financial results                                increase compared to 1Q11

                  US$ millions                                    1Q11                    1Q12                  Var %

Operating revenues                                                302.1                    292.1                (3%)

Operating income                                                   54.0                    52.3                 (3%)

EBITDA                                                             79.2                    84.1                  6%

Total non operating results                                        (8.7)                   (4.8)                (45%)

Net income                                                         34.0                    40.1                 18%

Energy sales(GWh)                                                 1,800                    2,256                25%

Net Generation(GWh)                                               1,589                    1,967                24%

 Revenues decreased due to the combination of a lower average realized monomic tariff with an increase in physical sales explained by
  the power supply contract with regulated clients, which became effective on January 1, 2012.
 EBITDA reached US$ 84 million in the first quarter, a 6% increase compared to 1Q11.
 Net income increased 18%, not only due to the EBITDA increase, but also due to foreign- exchange earnings and a reduction in the
  income tax rate.
 Gross generation increased as a result of the contribution of the new coal-fired power plants, CTA and CTH.

                                                                                                                                     12
Strong financial profile…
                          Financial results

Main financial indicators

   Sales (US$ million)                                                     EBITDA (US$ million)

    1200                                                                     400
    1000
                                                                             300
     800                                                -3%                                                            6%
     600         1.053     1.121   1.257
                                                                             200           358    338   368
     400
                                                 302          292            100                                  79        84
     200
        0                                                                       0
                 2009     2010     2011          1Q11         1Q12                     2009      2010   2011     1Q11       1Q12

   Sales breakdown                                                         Costs breakdown
                         Regulated customers
                                               16%
                                sales
           74%                                                4%                    43%                                     16%

 Unregulated customers                                   Spot energy and      Fuels and                                   Spot energy and
         sales                                            capacity sales      lubricants                                 capacity purchases

                                                              6%                    28%                                     13%

                                                       Other operating         Otros operating                         Depreciation and
                                                          revenues               costs                                  amortization

                    Total 1Q12= US$ 292 million                                              Total 1Q12 = US$ 239.8 million               13
Coupled with a conservative debt
                     Financial results                                       structure

Total debt /EBITDA                                                  Net debt /EBITDA

 3.0x                                                               3.0x

 2.0x                                                               2.0x

 1.0x       2,1x          2,2x     2,0x         1,9x                1.0x         1,6x      1,7x       1,5x        1,3x

  .0x                                                                  .0x
            2009        2010       2011     Mar -2012                            2009      2010      2011        Mar-2012
                                                LTM                                                               LTM

EBITDA/ Interest expenses                                          Credit ratings
25.0x                                       interest expense          S&P and Fitch international investment-grade ratings :
                                           related to the CTA
20.0x                                     project financing and        • S&P: BBB- (Stable Outlook)
                                                  144A
                                                                       • Fitch: BBB- (Stable Outlook)
15.0x
            23,2x       24,1x
10.0x                                                                 Local investment-grade ratings by Fitch, Feller and
                                  12,1x         9,8x                   ICR
 5.0x
                                                                       • Feller: A (Stable Outlook)
  .0x                                                                  • Fitch: A (Stable Outlook)
            2009        2010      2011      Mar - 2012
                                                LTM                    • ICR: A (Stable Outlook)

                                                                                                                                14
An attractive shareholder return
                       Financial results

      E.CL Share (as of May 4,2012):
      •    Market Cap: US$ 2.77 bn
      •    Price: CH$ 1,272
                                       Source: Bloomberg

Return and Dividend per share

                          30% payout                       50% pay out            50% pay out
                          ratio                            ratio                  ratio

                                                                                0.085

                                                                                0.06
                                                                                1

                                                                                                            15
Agenda

         Compañía

         Resultados 1T12

         Projects under development

                                16
E.CL is embarked on an investment
                                                               program to reduce particle matter and gas
                     Projects under development                   emissions in order to meet stricter
                                                                       environmental standards

New regulation on particle matter and gas emissions by thermoelectric plants

       Stricter particle-matter and gas emission requirements were approved by Chilean authorities in 2011
       Investing to comply with new emission requirements: Est. US$170 MM CAPEX in 2011–2015
       The works include the installation of desulphurization and oxide-reduction systems in Units 1 and 2 in Mejillones and Units
        12, 13, 14 and 15 of the Tocopilla plant.

                                                                                                                                      17
E.CL is committed to continued
                                                              environmental improvement
                   Projects under development

Development of non-conventional
   renewable energy (NCRE)

                                            Solar power project studies          Second-generation fuels
                                                                                    from microalgae

     Calama wind-farm project                                                  Steam for injection in coal-fired
                                         Use of biomass in coal-fired units
            (100 MW)                                                            units' cycles generated from
                                                                                         solar power
                                                                                                                   18
Potential acquisition of GDF Suez's
                                         NCRE assets in the SIC: Eólica Monte
            Projects under development            Redondo ("EMR")"

Eólica Monte Redondo

                                             EMR owns a wind farm with 24 aerogenerators with total
                                              capacity of 48 MW in the SIC.

                                             EMR owns a 34 MW hydro plant under construction in the SIC.

                                                                                                     19
Our plan includes new investments to meet the
                                              increased power demand in the north of Chile
                 Projects under development

Infraestructura Energética Mejillones:

                                                                                            Capacity Demand-
                                                          Company             Project                          Full Capacity- yr
                                                                                                   MW

                                                   Antofagasta Minerals   Antucoya               45MW                2014

                                                   BHP                    Escondida OGP       800 -1000 MW           2015

                                                   Collahuasi             Collahuasi           50-170MW           2015-2018
                                                                          expansion
                                                                          Phase I-II
                                                   Quadra FNX Mining      Sierra Gorda           190MW               2015

                                                   Teck                   Quebrada Blanca        210MW               2016
                                                                          Hip.

                                                   International PBX      Copaquire              80MW                2017
                                                   Ventures

                                                    The Infraestructura Energética Mejillones project consists of up to two
                                                     coal-fired power plants, each with gross capacity of 375 MW, and a
                                                     new port facility.

                                                    The closing of PPAs is the key item that will trigger the decision to
                                                     build one or two of these units.

                                                                                                                         20
This presentation may contain certain forward-looking statements and information relating to E.CL S.A. (“E.CL” or the “Company”) that reflect the current views and/or expectations of the Company and its management
with respect to its business plan. Forward-looking statements include, without limitation, any statement that may predict, forecast, indicate or imply future results, performance or achievements, and may contain words
like “believe”, “anticipate”, “expect”, “envisage”, “will likely result”, or any other words or phrases of similar meaning. Such statements are subject to a number of significant risks, uncertainties and assumptions. We
caution that a number of important factors could cause actual results to differ materially from the plans, objectives, expectations, estimates and intentions expressed in this presentation. In any event, neither the
Company nor any of its affiliates, directors, officers, agents or employees shall be liable before any third party (including investors) for any investment or business decision made or action taken in reliance on the
information and statements contained in this presentation or for any consequential, special or similar damages. The Company does not intend to provide eventual holders of shares with any revised forward-looking
statements of analysis of the differences between any forward-looking statements and actual results. There can be no assurance that the estimates or the underlying assumptions will be realized and that actual results of
operations or future events will not be materially different from such estimates.

This presentation and its contents are proprietary information and may not be reproduced or otherwise disseminated in whole or in part without E.CL’s prior written consent.                                     21
You can also read