2020 Bulkers Ltd. Company Presentation 12 January 2021 - Cision
←
→
Page content transcription
If your browser does not render page correctly, please read the page content below
2020 Bulkers Ltd.
Company Presentation
12 January 2021
                       |
Disclaimer

This presentation (the "Presentation") has been prepared by 2020 Bulkers Ltd. (the "Company") and is made 12 January, 2021 solely for information purposes. The
Presentation does not constitute any recommendation to buy, sell or otherwise transact with any securities issued by the Company.

No representation, warranty or undertaking, express or implied, is made by the Company and no reliance should be placed on the fairness, accuracy, completeness or
correctness of the information or the opinions contained herein. The Company shall have no responsibility or liability whatsoever (for negligence or otherwise) for any loss
arising from the use by any person or entity of the information set forth in the Presentation. All information set forth in the Presentation may change materially and without
notice. In making the Presentation public the Company undertakes no obligation to provide additional information or to make updates thereto. The information set forth in the
Presentation should be considered in the context of the circumstances prevailing at the date hereof and has not been and will not be updated to reflect material developments
which may occur after such date unless specifically stated in such update(s).

Matters discussed in the Presentation include "forward looking statements". "Forward looking statements" are statements that are not historical facts and are usually identified
by words such as "believes", "expects", "anticipates", "intends", "estimates", "will", "may", "continues", "should" etc. These "forward looking statements" reflect the Company's
beliefs, intentions and current expectations concerning, among other things, the Company's results, financial condition, liquidity position, prospects, growth and strategies.
"Forward looking statements" include statements regarding: objectives, goals, strategies, outlook and growth prospects, future plans, events or performance and potential for
future growth, liquidity, capital resources and capital expenditures, economic outlook and industry trends, developments in the Company's market, the impact of regulatory
initiatives and the strength of the Company's competitors. "Forward looking statements" involve risks and uncertainties because they relate to events and depend on
circumstances that may or may not occur in the future. The "forward looking statements" included herein are based upon various assumptions, many of which, in turn, are
based upon further assumptions. This includes, without limitation, the Company's review of historical operating trends, data contained in the Company's records and data
available from third parties. Although the Company believes that these assumptions were reasonable when the relevant statements were made, they are inherently subject to
significant known and unknown risks, uncertainties, contingencies and other factors which are difficult or impossible to predict and which are beyond the Company's control.
"Forward looking statements" are not guarantees of future performance and such risks, uncertainties, contingencies and other important factors which are inherent thereto
could cause the actual results of operation, financial condition and liquidity position of the Company or the industry in which it operates to differ materially from those results
which, expressed or implied, are contained herein. No representation to the effect that at any of the "forward looking statements" or forecasts will come to pass or that any
forecasted result will be achieved are made.

The Presentation and the information contained herein does not constitute or form a part of and should not be construed as an offer for sale or subscription or of solicitation or
invitation of any offer to subscribe for or purchase any securities issued by the Company.

                                                                                                                                                                                      2|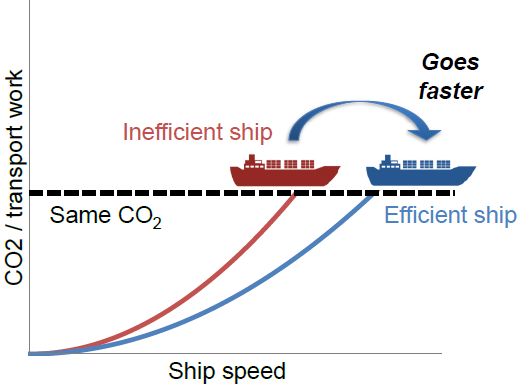
Profitable every quarter following delivery of the first vessel
                          2020 Bulkers has been profitable every quarter since delivery of the first vessel in August 2019
               18
                                                                                                                               15,7
               16
               14
                                                                                                            10,8
 US$ Million

               12                                                                                                                     10,6
               10                                                              7,8
                8                             6,9                                                                  7,2
                6                                                                     4,4                                                    4,8
                                                     3,5
                4   2,2                                                                                                  2,4
                            0,9     0,8                       1,2
                2                                                                              0,3
                0
                          Q3 2019                   Q4 2019                          Q1 2020                   Q2 2020            Q3 2020
                                                                    Revenues    EBITDA         Net profit

                                                               Strong performance driven by

- Modern fleet of fuel efficient Newcastlemax vessels with scrubbers, earning a significant premium to standard Capesize vessels

- Low cash breakeven driven by attractive financing and low G&A costs

- Proactive risk management. We protected downside through adding fixed charter coverage in early 2020

                                                                                                                                                   3|
The Capesize market is off to a strong start in 2021
40 000
35 000
30 000
25 000
20 000
15 000
10 000
5 000
0
2. jan. 2. feb. 2. mar. 2. apr. 2. mai. 2. jun. 2. jul. 2. aug. 2. sep. 2. okt. 2. nov. 2. des.
2015-21 max-min range 2020 2021 2015-21 average
- Year to date Capesize rates are the strongest seen since 2015
- Market is supported by strong iron ore volumes with YTD Brazilian exports +15% and Australian exports +19% YoY
- Strong coal exports out of USG and USEC
- Staggered Lunar Holidays in China may contribute to a stronger than usual first quarter
- Lower fleet growth in 2021 with orderbook of 16 million DWT, compared to 25 million DWT delivered in 2020
4|We are positioned to take advantage of a stronger spot market
Ship name Built Charterer Rate Charter expiry
Bulk Sandefjord Aug 19 Koch Index linked + scrubber benefit Aug 22
Bulk Santiago Sep 19 Koch Index linked + scrubber benefit Nov 21 - Jan 22
Bulk Seoul Oct 19 Koch Index linked + scrubber benefit Dec 21 - Feb 22
Bulk Shanghai Nov 19 Glencore 18500 gross + scrubber benefit Mar-Jul 21
Bulk Shenzhen Jan 20 Koch Brazil Round Voyage, etimated TCE USD 18,500 net Apr 21
Bulk Sydney Jan 20 Koch Index linked + scrubber benefit Jan 23
Bulk Sao Paulo May 20 Glencore Index linked + scrubber benefit May-Jul 23
Bulk Santos Jun 20 Glencore Index linked + scrubber benefit May-Jul 23
Q1 2021
- 6 vessels on index linked vessels with scrubber profit share
- 2 vessels fixed at approximately US$18,500 per day, with additional scrubber share for one vessel
- Operating cash breakeven estimated at US$12,900 per day for vessels trading on index linked charters
Q2 - Q4 2021
- All 8 vessels exposed to the spot market from April-July
- Estimated cash breakeven of US$14,400 per day with all vessels trading spot
5|Our dividend potential is significant
Q1 2021 Indicative dividend capacity (annual run rate) Q2-Q4 2021 Indicative dividend capacity (annual run-rate)
30 40
28
36
35
25
23
30 29
20
17 25
NOK per share
NOK per share
22
15 20
12
15
15
10
7 10
8
5
5
1
1
0 0
10 000 15 000 20 000 25 000 30 000 35 000 10 000 15 000 20 000 25 000 30 000 35 000
Capesize rate Capesize rate
Indicative calculations. Actual results may vary
6|Million tons
55
60
65
70
75
80
85
90
95
100
jan. 15
jul. 15
jan. 16
jul. 16
jan. 17
jul. 17
jan. 18
jul. 18
jan. 19
China steel production
jul. 19
Sources: Shipping intelligence network, Arrow shipbroking group
jan. 20
jul. 20
Million tons
100
120
0
20
40
60
80
2007
2008
2009
2010
2011
2012
2013
2014
2015
2016
Chinese demand is strong, inventories are low
2017
China iron ore imports
2018
2019
2020
Million tons
15
20
25
30
35
40
45
okt.11
apr.12
okt.12
apr.13
okt.13
apr.14
okt.14
apr.15
okt.15
apr.16
okt.16
apr.17
okt.17
apr.18
okt.18
apr.19
okt.19
China steel mill’s iron ore stocks
apr.20
7|
okt.20Steel production is recovering to pre Covid-19 levels
Global steel production is back above pre-Covid levels China leading the recovery, rest of world is accelerating
40% 15%
10%
30%
5%
20%
0%
10% -5%
-10%
0%
-15%
-10%
-20%
-25%
-20%
-30%
-30%
0 1 2 3 4 5 6 7 8 9 10 11 12 13 14 15 16 17 18 19 20 21 22 23 -35%
months after the onset of crisis jan feb mar apr mai jun jul aug sep okt nov
2008 Global Financial Crisis Covid-19 China ex-China
Source: Arrow shipbroking group
8|Limited supply growth on the horizon and high scrapping activity
Capesize orderbook as % of fleet Capesize bulk newbuild contracts Capesize scrapping
90 14
120
80
12
100
70
10
80 60
Million DWT
50 8
Million DWT
60
40
6
40 30
4
20
20
10 2
0
0
01.01.1996
01.03.1997
01.05.1998
01.07.1999
01.09.2000
01.11.2001
01.01.2003
01.03.2004
01.05.2005
01.07.2006
01.09.2007
01.11.2008
01.01.2010
01.03.2011
01.05.2012
01.07.2013
01.09.2014
01.11.2015
01.01.2017
01.03.2018
01.05.2019
01.07.2020
0
2017 2018 2019 2020
Clarkson Research Services Limited
9|Fleet growth could turn negative during 2H 2021
Capesize – 2021 expected monthly net fleet growth
2,0
Estimated net fleet growth - Mill DWT
1,5
1,0
0,5
0,0
Jan Feb Mar Apr May Jun Jul Aug Sept Oct Nov Dec
-0,5
Source: Clarksons Research Services. Scrapping assumed by at same levels as 2020
10 |10%
15%
20%
25%
30%
35%
40%
0%
5%
jan. 14
mai. 14
sep. 14
jan. 15
mai. 15
sep. 15
jan. 16
mai. 16
sep. 16
jan. 17
mai. 17
sep. 17
Source: Clarksons Research Services, Arrow Shipbroking Group
jan. 18
mai. 18
sep. 18
jan. 19
mai. 19
sep. 19
jan. 20
Freight costs Brazil-China as a % of cargo value
mai. 20
sep. 20
10%
12%
14%
16%
0%
2%
4%
6%
8%
jan. 14
mai. 14
sep. 14
jan. 15
mai. 15
sep. 15
jan. 16
mai. 16
Current freight rates are low compared to commodity prices
sep. 16
jan. 17
mai. 17
sep. 17
jan. 18
mai. 18
sep. 18
jan. 19
mai. 19
sep. 19
jan. 20
Freight costs Australia-China as a % of cargo value
mai. 20
sep. 20
11 |Congestion is low
Share of global Capesize fleet (DWT) in congestion
17%
16%
15%
14%
13%
12%
11%
10%
9%
jan.20 feb.20 mar.20 apr.20 mai.20 jun.20 jul.20 aug.20 sep.20 okt.20 nov.20 des.20 jan.21
Arrow Shipbroking Group
12 |Share of Capesize fleet in drydock is down from early 2020 levels
Share of Capesize fleet (DWT) in drydock
7,00%
6,00%
5,00%
4,00%
3,00%
2,00%
1,00%
0,00%
2015
2016
2017
2018
2019
2020
2021
Source: Oceanbolt
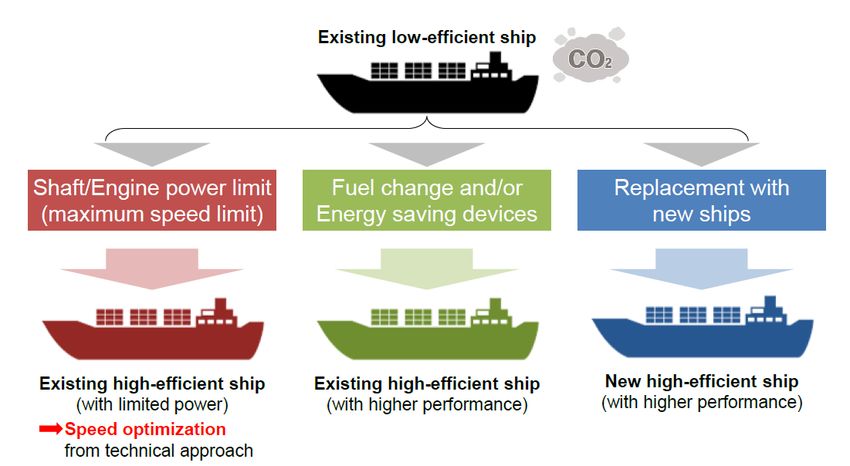
13 |EEXI – New IMO regulations to reduce CO2 emissions
Summary Emission reduction through goal-based measure
In 2018, the IMO adopted a target to reduce CO2 intensity from
international shipping by 40% from 2008 levels by 2030
As a consequence, the EEXI (Energy Efficiency Existing Ship
Index) is expected to be introduced in October 2022
EEXI sets limits to the amount of CO2 that can be emitted per
ton of transport supply (DWT * nautical miles) and will applied
to all existing ships
Non-compliant ships may comply by applying performance
Alternatives for complying
enhancing measures (requires a significant investment) and/or
reducing the engine’s power output.
A significant part of the trading fleet may not be able to comply
and may have to be retired
The implementation of EEXI is expected to reduce the average
sailing speed of the global fleet, particularly for older vessels
Efficient ships may be favored by charterers and command a
larger earnings premium following the implementation of EEXI
Source: IMO, Arrow Shipbroking group
14 |You can also read